This is a list of electoral district results for the 1912 Queensland state election. [1]
At the time, the voting system in Queensland was based on contingency voting, which was similar to the modern optional preferential voting system. In electorates with 3 or more candidates, preferences were not distributed if a candidate received more than 50% of the primary vote.
If none received more than 50%, all except the top two candidates were eliminated from the count and their preferences distributed between the two leaders, with the one receiving the most votes declared the winner.
Party | Candidate | Votes | % | ±% | |
---|---|---|---|---|---|
Liberal | John Appel | unopposed | |||
Liberal hold | Swing | ||||
Party | Candidate | Votes | % | ±% | |
---|---|---|---|---|---|
Liberal | Alfred Luke | 2,287 | 69.2 | ||
Labor | John Connelly | 1,020 | 30.8 | ||
Total formal votes | 3,307 | 98.6 | |||
Informal votes | 48 | 1.4 | |||
Turnout | 3,355 | 71.9 | |||
Liberal hold | Swing | ||||
Party | Candidate | Votes | % | ±% | |
---|---|---|---|---|---|
Labor | Edward Land | 1,387 | 68.6 | ||
Liberal | Jasper Harvey | 635 | 31.4 | ||
Total formal votes | 2,022 | 96.9 | |||
Informal votes | 64 | 3.1 | |||
Turnout | 2,086 | 56.3 | |||
Labor hold | Swing | ||||
Party | Candidate | Votes | % | ±% | |
---|---|---|---|---|---|
Labor | T.J. Ryan | 1,649 | 72.3 | ||
Liberal | Albert Catchlove | 633 | 27.7 | ||
Total formal votes | 2,282 | 98.4 | |||
Informal votes | 38 | 1.6 | |||
Turnout | 2,320 | 65.3 | |||
Labor hold | Swing | ||||
Party | Candidate | Votes | % | ±% | |
---|---|---|---|---|---|
Liberal | Edwin Caine | 1,868 | 55.1 | ||
Labor | Myles Ferricks | 1,519 | 44.9 | ||
Total formal votes | 3,387 | 98.8 | |||
Total formal votes | 42 | 1.2 | |||
Turnout | 3,429 | 76.4 | |||
Liberal gain from Labor | Swing |
Party | Candidate | Votes | % | ±% | |
---|---|---|---|---|---|
Liberal | James Cribb | 1,860 | 50.2 | ||
Labor | William Hefferan | 1,844 | 49.8 | ||
Total formal votes | 3,704 | 99.0 | |||
Informal votes | 36 | 1.0 | |||
Turnout | 3,740 | 81.6 | |||
Liberal hold | Swing | ||||
Party | Candidate | Votes | % | ±% | |
---|---|---|---|---|---|
Labor | Mick Kirwan | 2,281 | 50.4 | ||
Liberal | Edward Forrest | 2,249 | 49.6 | ||
Total formal votes | 4,530 | 98.9 | |||
Informal votes | 51 | 1.1 | |||
Turnout | 4,581 | 73.3 | |||
Labor gain from Liberal | Swing |
Party | Candidate | Votes | % | ±% | |
---|---|---|---|---|---|
Liberal | Walter Barnes | 2,315 | 56.9 | ||
Labor | Hugh McMinn | 1,752 | 43.1 | ||
Total formal votes | 4,067 | 99.4 | |||
Informal votes | 23 | 0.6 | |||
Turnout | 4,090 | 85.7 | |||
Liberal hold | Swing | ||||
Party | Candidate | Votes | % | ±% | |
---|---|---|---|---|---|
Labor | George Barber | 1,926 | 55.7 | ||
Liberal | James Macleod | 1,531 | 44.3 | ||
Total formal votes | 3,457 | 99.4 | |||
Informal votes | 22 | 0.6 | |||
Turnout | 3,479 | 83.2 | |||
Labor hold | Swing | ||||
Party | Candidate | Votes | % | ±% | |
---|---|---|---|---|---|
Labor | John Huxham | 2,276 | 55.5 | ||
Liberal | William Stephens | 1,824 | 44.5 | ||
Total formal votes | 4,100 | 99.3 | |||
Informal votes | 27 | 0.7 | |||
Turnout | 4,127 | 87.5 | |||
Labor gain from Liberal | Swing |
Party | Candidate | Votes | % | ±% | |
---|---|---|---|---|---|
Independent | William Murphy | 1,174 | 53.5 | ||
Labor | Charles Collins | 1,020 | 46.5 | ||
Total formal votes | 2,194 | 99.0 | |||
Informal votes | 21 | 1.0 | |||
Turnout | 2,215 | 70.7 | |||
Independent gain from Labor | Swing |
Party | Candidate | Votes | % | ±% | |
---|---|---|---|---|---|
Liberal | Bernard Corser | 1,603 | 53.1 | ||
Labor | Alfred Jones | 1,415 | 46.9 | ||
Total formal votes | 3,018 | 98.3 | |||
Informal votes | 53 | 1.7 | |||
Turnout | 3,071 | 78.0 | |||
Liberal hold | Swing | ||||
Party | Candidate | Votes | % | ±% | |
---|---|---|---|---|---|
Liberal | Colin Rankin | 1,623 | 58.4 | ||
Labor | Albert Whitford | 1,157 | 41.6 | ||
Total formal votes | 2,780 | 99.1 | |||
Informal votes | 26 | 0.9 | |||
Turnout | 2,806 | 71.3 | |||
Liberal hold | Swing | ||||
Party | Candidate | Votes | % | ±% | |
---|---|---|---|---|---|
Labor | William McCormack | 1,411 | 51.3 | ||
Independent | John Mann | 1,341 | 48.7 | ||
Total formal votes | 2,752 | 98.7 | |||
Informal votes | 37 | 1.3 | |||
Turnout | 3,241 | 77.9 | |||
Labor gain from Independent | Swing |
Party | Candidate | Votes | % | ±% | |
---|---|---|---|---|---|
Liberal | Donald Gunn | 1,793 | 55.6 | ||
Labor | Tom Crawford | 1,430 | 44.4 | ||
Total formal votes | 3,223 | 99.4 | |||
Informal votes | 18 | 0.6 | |||
Turnout | 3,241 | 77.9 | |||
Liberal hold | Swing | ||||
Party | Candidate | Votes | % | ±% | |
---|---|---|---|---|---|
Liberal | Robert Williams | 1,569 | 53.3 | ||
Labor | John Mullan | 1,374 | 46.7 | ||
Total formal votes | 2,943 | 98.6 | |||
Informal votes | 42 | 1.4 | |||
Turnout | 2,985 | 82.9 | |||
Liberal gain from Labor | Swing |
Party | Candidate | Votes | % | ±% | |
---|---|---|---|---|---|
Labor | Ted Theodore | 1,774 | 75.1 | ||
Liberal | Archibald Frew | 588 | 24.9 | ||
Total formal votes | 2,362 | 97.4 | |||
Informal votes | 64 | 2.6 | |||
Turnout | 2,426 | 69.9 | |||
Labor hold | Swing | ||||
Party | Candidate | Votes | % | ±% | |
---|---|---|---|---|---|
Liberal | Henry Douglas | 1,393 | 58.3 | ||
Labor | Harry Ryan | 996 | 41.7 | ||
Total formal votes | 2,389 | 99.2 | |||
Informal votes | 20 | 0.8 | |||
Turnout | 2,409 | 76.9 | |||
Liberal hold | Swing | ||||
Party | Candidate | Votes | % | ±% | |
---|---|---|---|---|---|
Liberal | Harry Walker | 2,206 | 64.5 | ||
Labor | William Jones | 1,216 | 35.5 | ||
Total formal votes | 3,422 | 99.1 | |||
Informal votes | 31 | 0.9 | |||
Turnout | 3,453 | 75.0 | |||
Liberal hold | Swing | ||||
Party | Candidate | Votes | % | ±% | |
---|---|---|---|---|---|
Liberal | Francis Grayson | 2,049 | 75.7 | ||
Labor | Percy McCawley | 656 | 24.3 | ||
Total formal votes | 2,705 | 98.8 | |||
Informal votes | 33 | 1.2 | |||
Turnout | 2,738 | 67.0 | |||
Liberal hold | Swing | ||||
Party | Candidate | Votes | % | ±% | |
---|---|---|---|---|---|
Liberal | William Vowles | 1,992 | 57.1 | ||
Labor | Robert Turnbull | 1,497 | 42.9 | ||
Total formal votes | 3,489 | 99.5 | |||
Informal votes | 19 | 0.5 | |||
Turnout | 3,508 | 75.4 | |||
Liberal hold | Swing | ||||
Party | Candidate | Votes | % | ±% | |
---|---|---|---|---|---|
Liberal | William Bebbington | 1,962 | 62.2 | ||
Labor | James Desmond | 1,040 | 33.0 | ||
Independent | William Binns | 151 | 4.8 | ||
Total formal votes | 3,153 | 98.8 | |||
Informal votes | 38 | 1.2 | |||
Turnout | 3,191 | 75.8 | |||
Liberal hold | Swing | ||||
Party | Candidate | Votes | % | ±% | |
---|---|---|---|---|---|
Labor | William Gillies | 1,254 | 52.4 | ||
Liberal | Michael Woods | 1,141 | 47.6 | ||
Total formal votes | 2,395 | 98.4 | |||
Informal votes | 38 | 1.6 | |||
Turnout | 2,433 | 76.9 | |||
Labor gain from Liberal | Swing |
Party | Candidate | Votes | % | ±% | |
---|---|---|---|---|---|
Liberal | Robert Roberts | 1,851 | 55.7 | ||
Labor | George Walden | 1,473 | 44.3 | ||
Total formal votes | 3,324 | 99.3 | |||
Informal votes | 22 | 0.7 | |||
Turnout | 3,346 | 74.5 | |||
Liberal hold | Swing | ||||
Party | Candidate | Votes | % | ±% | |
---|---|---|---|---|---|
Liberal | Richard Trout | 2,076 | 53.4 | ||
Labor | William Lloyd | 1,814 | 46.6 | ||
Total formal votes | 3,890 | 99.6 | |||
Informal votes | 15 | 0.4 | |||
Turnout | 3,905 | 87.0 | |||
Liberal hold | Swing | ||||
Party | Candidate | Votes | % | ±% | |
---|---|---|---|---|---|
Liberal | Arnold Wienholt | unopposed | |||
Liberal hold | Swing | ||||
Party | Candidate | Votes | % | ±% | |
---|---|---|---|---|---|
Liberal | Ernest Bell | 2,130 | 72.6 | -27.4 | |
Labor | Arthur Laban | 508 | 17.3 | +17.3 | |
Liberal | Charles Jenkinson | 294 | 10.0 | 10.0 | |
Total formal votes | 2,932 | 98.8 | |||
Informal votes | 35 | 1.2 | |||
Turnout | 2,967 | ||||
Liberal hold | Swing | N/A | |||
Party | Candidate | Votes | % | ±% | |
---|---|---|---|---|---|
Liberal | Kenneth Grant | 1,925 | 58.8 | ||
Labor | Charles Bluett | 1,348 | 41.2 | ||
Total formal votes | 3,273 | 97.0 | |||
Informal votes | 101 | 3.0 | |||
Turnout | 3,374 | 74.0 | |||
Liberal hold | Swing | ||||
Party | Candidate | Votes | % | ±% | |
---|---|---|---|---|---|
Labor | John May | unopposed | |||
Labor hold | Swing | ||||
Party | Candidate | Votes | % | ±% | |
---|---|---|---|---|---|
Labor | David Bowman | 2,456 | 60.0 | ||
Liberal | Edwin Fowles | 1,640 | 40.0 | ||
Total formal votes | 4,096 | 99.2 | |||
Informal votes | 34 | 0.8 | |||
Turnout | 4,130 | 83.6 | |||
Labor hold | Swing | ||||
Party | Candidate | Votes | % | ±% | |
---|---|---|---|---|---|
Labor | William Hamilton | 1,249 | 74.4 | ||
Liberal | Francis North | 429 | 25.6 | ||
Total formal votes | 1,678 | 96.4 | |||
Informal votes | 63 | 3.6 | |||
Turnout | 1,741 | 46.6 | |||
Labor hold | Swing | ||||
Party | Candidate | Votes | % | ±% | |
---|---|---|---|---|---|
Liberal | George Mackay | 1,529 | 45.7 | ||
Labor | George Ryland | 1,409 | 42.1 | ||
Independent Labor | Daniel Mulcahy | 407 | 12.2 | ||
Total formal votes | 3,345 | 98.7 | |||
Informal votes | 44 | 1.3 | |||
Turnout | 3,389 | 80.1 | |||
Two-party-preferred result | |||||
Liberal | George Mackay | 1,581 | 52.7 | ||
Labor | George Ryland | 1,417 | 47.3 | ||
Liberal gain from Labor | Swing |
Party | Candidate | Votes | % | ±% | |
---|---|---|---|---|---|
Labor | William Lennon | 1,472 | 56.7 | ||
Liberal | Frederick O'Rourke | 1,124 | 43.3 | ||
Total formal votes | 2,596 | 99.4 | |||
Informal votes | 15 | 0.6 | |||
Turnout | 2,611 | 67.3 | |||
Labor hold | Swing | ||||
Party | Candidate | Votes | % | ±% | |
---|---|---|---|---|---|
Liberal | James Blair | 2,145 | 53.1 | ||
Labor | William Ryott Maughan | 1,897 | 46.9 | ||
Total formal votes | 4,042 | 99.1 | |||
Informal votes | 35 | 0.9 | |||
Turnout | 4,077 | 77.2 | |||
Liberal hold | Swing | ||||
Party | Candidate | Votes | % | ±% | |
---|---|---|---|---|---|
Labor | John Gilday | 2,266 | 55.2 | ||
Liberal | Arthur Hawthorn | 1,837 | 44.8 | ||
Total formal votes | 4,103 | 99.3 | |||
Informal votes | 27 | 0.7 | |||
Turnout | 4,130 | 87.1 | |||
Labor gain from Liberal | Swing |
Party | Candidate | Votes | % | ±% | |
---|---|---|---|---|---|
Labor | James O'Sullivan | 1,445 | 57.5 | ||
Liberal | Osborn Fenwick | 1,070 | 42.5 | ||
Total formal votes | 2,515 | 97.8 | |||
Informal votes | 56 | 2.2 | |||
Turnout | 2,571 | 77.5 | |||
Labor hold | Swing | ||||
Party | Candidate | Votes | % | ±% | |
---|---|---|---|---|---|
Labor | James Larcombe | 1,432 | 50.0 | ||
Liberal | James Brennan | 1,269 | 44.3 | ||
Independent Liberal | Frank Lennon | 164 | 5.7 | ||
Total formal votes | 2,865 | 98.2 | |||
Informal votes | 52 | 1.8 | |||
Turnout | 2,917 | 74.6 | |||
Two-party-preferred result | |||||
Labor | James Larcombe | 1,448 | 52.4 | ||
Liberal | James Brennan | 1,313 | 47.6 | ||
Labor gain from Liberal | Swing |
Party | Candidate | Votes | % | ±% | |
---|---|---|---|---|---|
Liberal | James Allan | 2,204 | 55.5 | ||
Labor | James Sharpe | 1,765 | 44.5 | ||
Total formal votes | 3,969 | 99.4 | |||
Informal votes | 22 | 0.6 | |||
Turnout | 3,991 | 83.6 | |||
Liberal hold | Swing | ||||
Party | Candidate | Votes | % | ±% | |
---|---|---|---|---|---|
Labor | Herbert Hardacre | 1,702 | 74.8 | ||
Liberal | William Fox | 575 | 25.2 | ||
Total formal votes | 2,277 | 98.4 | |||
Informal votes | 36 | 1.6 | |||
Turnout | 2,313 | 61.9 | |||
Labor hold | Swing | ||||
Party | Candidate | Votes | % | ±% | |
---|---|---|---|---|---|
Liberal | William Drayton Armstrong | unopposed | |||
Liberal hold | Swing | ||||
Party | Candidate | Votes | % | ±% | |
---|---|---|---|---|---|
Liberal | James Stodart | 2,127 | 68.7 | ||
Labor | Wolfgang Arnold | 971 | 31.3 | ||
Total formal votes | 3,098 | 98.9 | |||
Informal votes | 34 | 1.1 | |||
Turnout | 3,132 | 77.6 | |||
Liberal hold | Swing | ||||
Party | Candidate | Votes | % | ±% | |
---|---|---|---|---|---|
Liberal | Walter Paget | 1,937 | 62.1 | ||
Labor | Charles Tait | 1,182 | 37.9 | ||
Total formal votes | 3,119 | 96.1 | |||
Informal votes | 127 | 3.9 | |||
Turnout | 3,246 | 69.5 | |||
Liberal hold | Swing | ||||
Party | Candidate | Votes | % | ±% | |
---|---|---|---|---|---|
Labor | John Hunter | 1,819 | 62.4 | ||
Liberal | Aaron Hoskin | 1,095 | 37.6 | ||
Total formal votes | 2,914 | 99.1 | |||
Informal votes | 26 | 0.9 | |||
Turnout | 2,940 | 70.4 | |||
Labor hold | Swing | ||||
Party | Candidate | Votes | % | ±% | |
---|---|---|---|---|---|
Labor | William Bertram | 2,096 | 51.2 | ||
Liberal | David Hunter | 2,000 | 48.8 | ||
Total formal votes | 4,096 | 98.7 | |||
Informal votes | 53 | 1.3 | |||
Turnout | 4,149 | 84.2 | |||
Labor gain from Liberal | Swing |
Party | Candidate | Votes | % | ±% | |
---|---|---|---|---|---|
Liberal | Edward Corser | 1,750 | 50.1 | ||
Labor | William Mitchell | 1,740 | 49.9 | ||
Total formal votes | 3,490 | 98.6 | |||
Informal votes | 48 | 1.4 | |||
Turnout | 3,538 | 79.0 | |||
Liberal hold | Swing | ||||
Party | Candidate | Votes | % | ±% | |
---|---|---|---|---|---|
Liberal | Edward Corser | 1,791 | 50.02 | -0.08 | |
Labor | William Mitchell | 1,789 | 49.98 | +0.08 | |
Total formal votes | 3,580 | 99.6 | +1.0 | ||
Informal votes | 16 | 0.4 | -1.0 | ||
Turnout | 3,596 | 80.2 | +1.2 | ||
Liberal hold | Swing | -0.08 | |||
Party | Candidate | Votes | % | ±% | |
---|---|---|---|---|---|
Liberal | Thomas Welsby | 2,119 | 50.05 | ||
Labor | Peter McLachlan | 2,115 | 49.95 | ||
Total formal votes | 4,234 | 98.9 | |||
Informal votes | 47 | 1.1 | |||
Turnout | 4,281 | 85.5 | |||
Liberal hold | Swing | ||||
Party | Candidate | Votes | % | ±% | |
---|---|---|---|---|---|
Liberal | Edward Swayne | 1,730 | 68.8 | ||
Labor | Philip Kirwan | 785 | 31.2 | ||
Total formal votes | 2,515 | 98.6 | |||
Informal votes | 36 | 1.4 | |||
Turnout | 2,551 | 63.9 | |||
Liberal hold | Swing | ||||
Party | Candidate | Votes | % | ±% | |
---|---|---|---|---|---|
Labor | John Payne | 1,394 | 71.8 | ||
Liberal | John Cross | 547 | 28.2 | ||
Total formal votes | 1,941 | 97.9 | |||
Informal votes | 42 | 2.1 | |||
Turnout | 1,983 | 52.7 | |||
Labor hold | Swing | ||||
Party | Candidate | Votes | % | ±% | |
---|---|---|---|---|---|
Liberal | James Crawford | 1,874 | 53.0 | ||
Labor | James Stopford | 1,659 | 47.0 | ||
Total formal votes | 3,533 | 99.5 | |||
Informal votes | 19 | 0.5 | |||
Turnout | 3,552 | 77.7 | |||
Liberal hold | Swing | ||||
Party | Candidate | Votes | % | ±% | |
---|---|---|---|---|---|
Labor | Thomas Foley | 1,974 | 61.7 | ||
Liberal | William Little | 1,226 | 38.3 | ||
Total formal votes | 3,200 | 98.9 | |||
Informal votes | 34 | 1.1 | |||
Turnout | 3,234 | 76.3 | |||
Labor hold | Swing | ||||
Party | Candidate | Votes | % | ±% | |
---|---|---|---|---|---|
Liberal | Godfrey Morgan | 1,725 | 56.2 | ||
Labor | Frank Allen | 1,346 | 43.8 | ||
Total formal votes | 3,071 | 97.6 | |||
Informal votes | 74 | 2.4 | |||
Turnout | 3,145 | 72.8 | |||
Liberal hold | Swing | ||||
Party | Candidate | Votes | % | ±% | |
---|---|---|---|---|---|
Liberal | James Forsythe | 2,400 | 77.7 | ||
Labor | Gideon Dennis | 688 | 22.3 | ||
Total formal votes | 3,088 | 99.1 | |||
Informal votes | 29 | 0.9 | |||
Turnout | 3,117 | 71.1 | |||
Liberal hold | Swing | ||||
Party | Candidate | Votes | % | ±% | |
---|---|---|---|---|---|
Liberal | John White | 1,569 | 56.9 | ||
Labor | Henry Cattermull | 1,188 | 43.1 | ||
Total formal votes | 2,757 | 98.5 | |||
Informal votes | 41 | 1.5 | |||
Turnout | 2,798 | 78.3 | |||
Liberal hold | Swing | ||||
Party | Candidate | Votes | % | ±% | |
---|---|---|---|---|---|
Liberal | Robert Hodge | 2,379 | 63.8 | ||
Labor | Maurice Harland | 1,348 | 36.2 | ||
Total formal votes | 3,727 | 98.7 | |||
Informal votes | 48 | 1.3 | |||
Turnout | 3,775 | 69.5 | |||
Liberal hold | Swing | ||||
Party | Candidate | Votes | % | ±% | |
---|---|---|---|---|---|
Liberal | George Fox | 1,490 | 60.7 | ||
Labor | George Martens | 966 | 39.3 | ||
Total formal votes | 2,456 | 97.3 | |||
Informal votes | 69 | 2.7 | |||
Turnout | 2,525 | 68.3 | |||
Liberal hold | Swing | ||||
Party | Candidate | Votes | % | ±% | |
---|---|---|---|---|---|
Liberal | Edward Archer | 1,105 | 53.6 | -7.1 | |
Labor | Joseph Whiteley | 971 | 46.4 | +7.1 | |
Total formal votes | 2,051 | 98.7 | +1.4 | ||
Informal votes | 25 | 1.3 | -1.4 | ||
Turnout | 2,076 | 63.0 | -5.3 | ||
Liberal hold | Swing | -7.1 | |||
Party | Candidate | Votes | % | ±% | |
---|---|---|---|---|---|
Liberal | Thomas Bridges | 2,301 | 65.1 | ||
Labor | Robert McCormack | 1,232 | 34.9 | ||
Total formal votes | 3,533 | 99.5 | |||
Informal votes | 17 | 0.5 | |||
Turnout | 3,550 | 79.9 | |||
Liberal hold | Swing | ||||
Party | Candidate | Votes | % | ±% | |
---|---|---|---|---|---|
Liberal | Digby Denham | 2,213 | 58.3 | ||
Labor | Charles Martin | 1,580 | 41.7 | ||
Total formal votes | 3,793 | 99.5 | |||
Informal votes | 20 | 0.5 | |||
Turnout | 3,813 | 85.6 | |||
Liberal hold | Swing | ||||
Party | Candidate | Votes | % | ±% | |
---|---|---|---|---|---|
Labor | John Fihelly | 2,678 | 57.6 | ||
Liberal | John Walsh | 1,973 | 42.4 | ||
Total formal votes | 4,651 | 98.8 | |||
Informal votes | 58 | 1.2 | |||
Turnout | 4,709 | 84.6 | |||
Labor gain from Liberal | Swing |
Party | Candidate | Votes | % | ±% | |
---|---|---|---|---|---|
Liberal | Donald Mackintosh | 1,850 | 60.6 | ||
Labor | Matthias Dwyer | 1,204 | 39.4 | ||
Total formal votes | 3,054 | 99.6 | |||
Informal votes | 13 | 0.4 | |||
Turnout | 3,067 | 73.2 | |||
Liberal hold | Swing | ||||
Party | Candidate | Votes | % | ±% | |
---|---|---|---|---|---|
Labor | Edward Breslin | 1,590 | 50.03 | ||
Liberal | John Kessell | 1,588 | 49.97 | ||
Total formal votes | 3,178 | 98.8 | |||
Informal votes | 39 | 1.2 | |||
Turnout | 3,217 | 78.4 | |||
Labor hold | Swing | ||||
Party | Candidate | Votes | % | ±% | |
---|---|---|---|---|---|
Liberal | John Kessell | 1,512 | 51.6 | +1.6 | |
Labor | Edward Breslin | 1,416 | 48.4 | -1.6 | |
Total formal votes | 2,928 | 99.2 | +0.4 | ||
Informal votes | 23 | 0.8 | -0.4 | ||
Turnout | 2,951 | 70.6 | +7.8 | ||
Liberal gain from Labor | Swing | +1.6 |
Party | Candidate | Votes | % | ±% | |
---|---|---|---|---|---|
Labor | Vern Winstanley | 1,704 | 58.6 | ||
Liberal | Frederick Johnson | 1,202 | 41.4 | ||
Total formal votes | 2,906 | 99.6 | |||
Informal votes | 12 | 0.4 | |||
Turnout | 2,918 | 81.4 | |||
Labor hold | Swing | ||||
Party | Candidate | Votes | % | ±% | |
---|---|---|---|---|---|
Labor | John Adamson | 1,705 | 55.5 | ||
Liberal | George Curtis | 1,366 | 44.5 | ||
Total formal votes | 3,071 | 99.1 | |||
Informal votes | 27 | 0.9 | |||
Turnout | 3,098 | 67.0 | |||
Labor hold | Swing | ||||
Party | Candidate | Votes | % | ±% | |
---|---|---|---|---|---|
Liberal | Henry Stevens | 1,412 | 44.1 | ||
Independent | William Ruhno | 941 | 29.4 | ||
Labor | Patrick Madden | 687 | 21.5 | ||
Independent | John Rea | 159 | 5.0 | ||
Total formal votes | 3,199 | 99.4 | |||
Informal votes | 19 | 0.6 | |||
Turnout | 3,218 | 79.1 | |||
Two-candidate-preferred result | |||||
Liberal | Henry Stevens | 1,468 | 58.0 | ||
Independent | William Ruhno | 1,062 | 42.0 | ||
Liberal hold | Swing | ||||
Party | Candidate | Votes | % | ±% | |
---|---|---|---|---|---|
Liberal | Thomas Bouchard | 1,914 | 50.4 | ||
Labor | Joseph Sherry | 1,882 | 49.6 | ||
Total formal votes | 3,796 | 99.3 | |||
Informal votes | 26 | 0.7 | |||
Turnout | 3,822 | 77.5 | |||
Liberal hold | Swing | ||||
Party | Candidate | Votes | % | ±% | |
---|---|---|---|---|---|
Liberal | Henry Somerset | unopposed | |||
Liberal hold | Swing | ||||
Party | Candidate | Votes | % | ±% | |
---|---|---|---|---|---|
Liberal | Andrew Petrie | 2,648 | 64.7 | ||
Labor | Daniel Dowling | 1,447 | 35.3 | ||
Total formal votes | 4,095 | 99.4 | |||
Informal votes | 23 | 0.6 | |||
Turnout | 4,118 | 82.1 | |||
Liberal hold | Swing | ||||
Party | Candidate | Votes | % | ±% | |
---|---|---|---|---|---|
Liberal | Edward Macartney | 2,734 | 70.5 | ||
Labor | Lewis McDonald | 1,145 | 29.5 | ||
Total formal votes | 3,879 | 99.8 | |||
Informal votes | 9 | 0.2 | |||
Turnout | 3,888 | 81.2 | |||
Liberal hold | Swing | ||||
Party | Candidate | Votes | % | ±% | |
---|---|---|---|---|---|
Liberal | James Tolmie | 1,784 | 59.3 | ||
Labor | Michael Alke | 1,225 | 40.7 | ||
Total formal votes | 3,009 | 99.6 | |||
Informal votes | 13 | 0.4 | |||
Turnout | 3,022 | 72.8 | |||
Liberal hold | Swing | ||||
Party | Candidate | Votes | % | ±% | |
---|---|---|---|---|---|
Liberal | Robert Philp | 1,908 | 54.3 | ||
Labor | Alexander Austin | 1,604 | 45.7 | ||
Total formal votes | 3,512 | 98.3 | |||
Informal votes | 60 | 1.7 | |||
Turnout | 3,572 | 72.7 | |||
Liberal hold | Swing | ||||
Party | Candidate | Votes | % | ±% | |
---|---|---|---|---|---|
Labor | Harry Coyne | 1,758 | 65.4 | ||
Liberal | Duncan McDonald | 932 | 34.6 | ||
Total formal votes | 2,690 | 95.3 | |||
Informal votes | 134 | 4.7 | |||
Turnout | 2,824 | 69.7 | |||
Labor hold | Swing | ||||
Party | Candidate | Votes | % | ±% | |
---|---|---|---|---|---|
Liberal | George Barnes | 1,915 | 59.4 | ||
Labor | Angus Sinclair | 1,307 | 40.6 | ||
Total formal votes | 3,222 | 98.8 | |||
Informal votes | 38 | 1.2 | |||
Turnout | 3,260 | 70.3 | |||
Liberal hold | Swing | ||||
Party | Candidate | Votes | % | ±% | |
---|---|---|---|---|---|
Liberal | Charles Booker | 1,866 | 57.1 | ||
Labor | Andrew Thompson | 1,400 | 42.9 | ||
Total formal votes | 3,266 | 99.2 | |||
Informal votes | 27 | 0.8 | |||
Turnout | 3,293 | 81.2 | |||
Liberal hold | Swing | ||||
Party | Candidate | Votes | % | ±% | |
---|---|---|---|---|---|
Liberal | Hugh Macrossan | 2,488 | 57.1 | ||
Labor | Walter Crampton | 1,837 | 42.9 | ||
Total formal votes | 4,285 | 99.3 | |||
Informal votes | 32 | 0.7 | |||
Turnout | 4,317 | 85.0 | |||
Liberal hold | Swing | ||||
The Australian electoral system comprises the laws and processes used for the election of members of the Australian Parliament. The system presently has a number of distinctive features including compulsory enrolment, compulsory voting, majority-preferential instant-runoff voting in single-member seats to elect the lower house, the House of Representatives, and the use of the single transferable vote proportional representation system to elect the upper house, the Senate.
Electoral systems for the legislatures of the individual Australian states and territories are broadly similar to the electoral system used in federal elections in Australia.
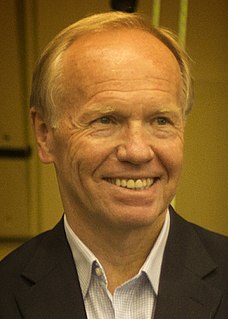
Elizabeth Anne Cunningham is an Australian politician. She was an independent member of the Legislative Assembly of Queensland from 1995 to 2015, representing the electorate of Gladstone. A conservative MLA in a traditionally Labor district, Cunningham is perhaps most well known for having brought Rob Borbidge's Coalition minority government to power in 1996, following the loss of the Mundingburra by-election by the then Goss Labor government.
The Edmonton provincial electoral district also known as Edmonton City from 1905 to 1909, was a provincial electoral district in Alberta, Canada mandated to return members to the Legislative Assembly of Alberta from 1905 to 1917 and again from 1921 to 1959.
Elections were held in the Australian state of Queensland on 13 June 1998 to elect the 89 members of the state's Legislative Assembly.
The Queensland Court of Disputed Returns is a court that adjudicates disputes concerning Queensland Government and local government elections and state referendums in Queensland, Australia. The Court is a division of the Supreme Court of Queensland.
Elections were held in the state of Western Australia on 31 March 1962 to elect all 50 members to the Legislative Assembly. The Liberal-Country coalition government, led by Premier Sir David Brand, won a second term in office against the Labor Party, led by Opposition Leader Albert Hawke.
The Nunawading Province by-election of 1985 was a by-election in the Nunawading Province for the Victorian Legislative Council held on 17 August 1985. It was ordered by the Court of Disputed Returns after it found that the Chief Electoral Officer drew a name at random when the 1985 Victorian state election had resulted in a dead heat between the top two candidates. The Chief Electoral Officer had drawn the name of the ALP candidate. After the Court ordered a new election, the outcome was that the Liberal candidate Rosemary Varty was returned.
This is a list of electoral district results for the 1989 Queensland state election.
This is a list of electoral district results for the 1950 Queensland state election.
This is a list of electoral district results for the 1941 Queensland state election.
This is a list of electoral district results for the 1938 Queensland state election.
This is a list of electoral district results for the 1935 Queensland state election.
This is a list of electoral district results for the 1932 Queensland state election.
This is a list of electoral district results for the 1929 Queensland state election.
This is a list of electoral district results for the 1926 Queensland state election.
This is a list of electoral district results for the 1923 Queensland state election.
This is a list of electoral district results for the 1920 Queensland state election.
This is a list of electoral district results for the 1918 Queensland state election.
This is a list of electoral district results for the 1915 Queensland state election.