Tasmanian state election, 20 March 2010 [1] Contents | ||||||
---|---|---|---|---|---|---|
Enrolled voters | 357,315 | |||||
Votes cast | 335,353 | Turnout | 93.85 | −1.03 | ||
Informal votes | 14,915 | Informal | 4.45 | +0.01 | ||
Summary of votes by party | ||||||
Party | Primary votes | % | Swing | Seats | Change | |
Liberal | 124,933 | 38.99 | +7.17 | 10 | +3 | |
Labor | 118,168 | 36.88 | −12.39 | 10 | −4 | |
Greens | 69,233 | 21.61 | +4.97 | 5 | +1 | |
Socialist Alliance | 646 | 0.20 | +0.04 | 0 | 0 | |
Independent | 7,458 | 2.33 | +0.72 | 0 | 0 | |
Total | 320,438 | 25 |
This is a list of House of Assembly results for the 2010 Tasmanian election.
Party | Candidate | Votes | % | ±% | |
---|---|---|---|---|---|
Quota | 10,617 | ||||
Liberal | Michael Ferguson (elected 1) | 15,911 | 25.0 | +25.0 | |
Liberal | Peter Gutwein (elected 3) | 9,060 | 14.2 | +0.7 | |
Liberal | Michele McGinty | 1,244 | 2.0 | +2.0 | |
Liberal | Nick Pedley | 536 | 0.8 | +0.8 | |
Liberal | Pam Dakin | 413 | 0.6 | +0.6 | |
Labor | Michelle O'Byrne (elected 2) | 11,380 | 17.9 | -5.4 | |
Labor | Brian Wightman (elected 5) | 3,191 | 5.0 | +5.0 | |
Labor | Scott McLean | 3,090 | 4.9 | +4.9 | |
Labor | Brant Webb | 2,699 | 4.2 | +4.2 | |
Labor | Michelle Cripps | 1,627 | 2.6 | +2.6 | |
Greens | Kim Booth (elected 4) | 8,853 | 13.9 | +4.6 | |
Greens | Jeremy Ball | 2,226 | 3.5 | +1.7 | |
Greens | Peter Whish-Wilson | 1,209 | 1.9 | +1.9 | |
Greens | Sally Day | 675 | 1.1 | +1.1 | |
Greens | Bev Ernst | 380 | 0.6 | +0.6 | |
Independent | Tim Parish | 484 | 0.8 | +0.8 | |
Independent | Peter Kaye | 279 | 0.4 | +0.4 | |
Independent | Jim Collier | 162 | 0.3 | -0.1 | |
Independent | Mark Webb | 158 | 0.2 | +0.2 | |
Independent | Sven Wiener | 121 | 0.2 | +0.2 | |
Total formal votes | 63,698 | 95.3 | 0.0 | ||
Informal votes | 3,162 | 4.7 | 0.0 | ||
Turnout | 66,860 | 93.8 | -1.1 | ||
Party total votes | |||||
Liberal | 27,164 | 42.6 | +8.9 | ||
Labor | 21,987 | 34.5 | -15.2 | ||
Greens | 13,343 | 21.0 | +7.4 | ||
Independent | Tim Parish | 484 | 0.8 | +0.8 | |
Independent | Peter Kaye | 279 | 0.4 | +0.4 | |
Independent | Jim Collier | 162 | 0.3 | -0.1 | |
Independent | Mark Webb | 158 | 0.2 | +0.2 | |
Independent | Sven Wiener | 121 | 0.2 | +0.2 | |
Party | Candidate | Votes | % | ±% | |
---|---|---|---|---|---|
Quota | 10,747 | ||||
Liberal | Jeremy Rockliff (elected 2) | 10,994 | 17.1 | +1.9 | |
Liberal | Adam Brooks (elected 4) | 6,972 | 10.8 | +10.8 | |
Liberal | Brett Whiteley | 5,547 | 8.6 | -0.1 | |
Liberal | Leonie Hiscutt | 2,715 | 4.2 | +4.2 | |
Liberal | Grant Dunham | 1,201 | 1.9 | +1.9 | |
Liberal | Philip Lamont | 1,115 | 1.7 | +1.7 | |
Liberal | Colin Lamont | 594 | 0.9 | +0.9 | |
Labor | Bryan Green (elected 1) | 11,221 | 17.4 | -7.0 | |
Labor | Brenton Best (elected 3) | 7,087 | 11.0 | +0.9 | |
Labor | Shane Broad | 3,303 | 5.1 | +5.1 | |
Labor | Judy Richmond | 2,309 | 3.6 | +3.6 | |
Labor | Kay Eastley | 2,027 | 3.1 | +3.1 | |
Greens | Paul O'Halloran (elected 5) | 5,718 | 8.9 | +2.1 | |
Greens | Ted Field | 894 | 1.4 | +1.4 | |
Greens | Clair Gilmour | 781 | 1.2 | +1.2 | |
Greens | David Henderson | 746 | 1.2 | +1.2 | |
Greens | Melissa Houghton | 735 | 1.1 | +1.1 | |
Independent | Timothy Kidd | 270 | 0.4 | +0.4 | |
Independent | Valerie Blake | 247 | 0.4 | +0.4 | |
Total formal votes | 64,476 | 95.1 | -0.3 | ||
Informal votes | 3,297 | 4.9 | +0.3 | ||
Turnout | 67,773 | 94.1 | -1.0 | ||
Party total votes | |||||
Liberal | 29,138 | 45.2 | +8.6 | ||
Labor | 25,947 | 40.2 | -11.2 | ||
Greens | 8,874 | 13.8 | +3.4 | ||
Independent | Timothy Kidd | 270 | 0.4 | +0.4 | |
Independent | Valerie Blake | 247 | 0.4 | +0.4 | |
Party | Candidate | Votes | % | ±% | |
---|---|---|---|---|---|
Quota | 10,630 | ||||
Labor | David Bartlett (elected 2) | 10,169 | 15.9 | +2.9 | |
Labor | Scott Bacon (elected 4) | 7,356 | 11.5 | +11.5 | |
Labor | Lisa Singh | 3,833 | 6.0 | -3.4 | |
Labor | Graeme Sturges | 1,185 | 1.9 | -7.7 | |
Labor | Madeleine Ogilvie | 608 | 1.0 | +1.0 | |
Liberal | Matthew Groom (elected 3) | 9,602 | 15.1 | +15.1 | |
Liberal | Richard Lowrie | 3,138 | 4.9 | +1.3 | |
Liberal | Elise Archer (elected 5) | 2,999 | 4.7 | +1.5 | |
Liberal | Matt Stevenson | 1,834 | 2.9 | +2.9 | |
Liberal | Jenny Branch | 1,428 | 2.2 | +2.2 | |
Greens | Cassy O'Connor (elected 1) | 10,336 | 16.2 | +12.3 | |
Greens | Helen Burnet | 3,142 | 4.9 | +4.9 | |
Greens | Peter Cover | 875 | 1.4 | +1.4 | |
Greens | Penelope Ann | 811 | 1.3 | +1.3 | |
Greens | Kartika Franks | 713 | 1.1 | +1.1 | |
Independent | Andrew Wilkie | 5,382 | 8.4 | +8.4 | |
Socialist Alliance | Melanie Barnes | 365 | 0.6 | +0.6 | |
Total formal votes | 63,776 | 96.2 | +0.5 | ||
Informal votes | 2,541 | 3.8 | -0.5 | ||
Turnout | 66,317 | 93.0 | +0.7 | ||
Party total votes | |||||
Labor | 23,151 | 36.3 | -10.5 | ||
Liberal | 19,001 | 29.8 | +3.1 | ||
Greens | 15,877 | 24.9 | +0.8 | ||
Independent | Andrew Wilkie | 5,382 | 8.4 | +8.4 | |
Socialist Alliance | 365 | 0.6 | +0.2 | ||
Party | Candidate | Votes | % | ±% | |
---|---|---|---|---|---|
Quota | 10,675 | ||||
Liberal | Will Hodgman (elected 1) | 20,302 | 31.7 | +9.7 | |
Liberal | Jacquie Petrusma (elected 5) | 2,500 | 3.9 | +3.9 | |
Liberal | Tony Mulder | 2,106 | 3.3 | +3.3 | |
Liberal | Jillian Law | 884 | 1.4 | +1.4 | |
Liberal | David Compton | 576 | 0.9 | +0.9 | |
Labor | Lara Giddings (elected 3) | 9,648 | 15.1 | +4.6 | |
Labor | David O'Byrne (elected 4) | 4,846 | 7.6 | +7.6 | |
Labor | Daniel Hulme | 2,214 | 3.5 | +2.5 | |
Labor | Ross Butler | 1,854 | 2.9 | +1.2 | |
Labor | Kate Churchill | 964 | 1.5 | +1.5 | |
Greens | Nick McKim (elected 2) | 15,462 | 24.1 | +8.2 | |
Greens | Wendy Heatley | 621 | 1.0 | +1.0 | |
Greens | Adam Burling | 495 | 0.8 | +0.8 | |
Greens | Deborah Brewer | 478 | 0.7 | +0.7 | |
Greens | Mark Harrison | 459 | 0.7 | +0.7 | |
Independent | John Forster | 355 | 0.6 | +0.6 | |
Socialist Alliance | Jenny Forward | 281 | 0.4 | +0.4 | |
Total formal votes | 64,045 | 96.2 | +0.1 | ||
Informal votes | 2,548 | 3.8 | -0.1 | ||
Turnout | 66,593 | 94.7 | -0.5 | ||
Party total votes | |||||
Liberal | 26,368 | 41.2 | +9.2 | ||
Labor | 19,526 | 30.5 | -15.6 | ||
Greens | 17,515 | 27.3 | +7.4 | ||
Independent | John Forster | 355 | 0.6 | +0.6 | |
Socialist Alliance | 281 | 0.4 | 0.0 | ||
Party | Candidate | Votes | % | ±% | |
---|---|---|---|---|---|
Quota | 10,741 | ||||
Labor | Michael Polley (elected 4) | 8,302 | 12.9 | -8.3 | |
Labor | David Llewellyn | 6,612 | 10.3 | -8.1 | |
Labor | Rebecca White (elected 5) | 6,453 | 10.0 | +10.0 | |
Labor | Heather Butler | 2,540 | 3.9 | -2.1 | |
Labor | Nick Wright | 2,357 | 3.7 | +3.7 | |
Labor | Brendan Sullivan | 1,293 | 2.0 | +2.0 | |
Liberal | Rene Hidding (elected 2) | 7,608 | 11.8 | -2.3 | |
Liberal | Mark Shelton (elected 3) | 5,263 | 8.2 | +8.2 | |
Liberal | Jane Howlett | 4,497 | 7.0 | +2.5 | |
Liberal | Jim Playsted | 4,027 | 6.2 | +6.2 | |
Liberal | Leigh Gray | 1,867 | 2.9 | +2.9 | |
Greens | Tim Morris (elected 1) | 9,108 | 14.1 | +3.6 | |
Greens | Karen Cassidy | 1,593 | 2.5 | +1.0 | |
Greens | Jackie Graham | 1,039 | 1.6 | +1.6 | |
Greens | Karl Stevens | 1,013 | 1.6 | +1.6 | |
Greens | Sharon Prior | 871 | 1.4 | +1.4 | |
Total formal votes | 64,443 | 95.0 | -0.3 | ||
Informal votes | 3,367 | 5.0 | +0.3 | ||
Turnout | 67,810 | 93.7 | -1.4 | ||
Party total votes | |||||
Labor | 27,557 | 42.8 | -9.5 | ||
Liberal | 23,262 | 36.1 | +6.1 | ||
Greens | 13,624 | 21.1 | +5.8 | ||
The House of Assembly, or Lower House, is one of the two chambers of the Parliament of Tasmania in Australia. The other is the Legislative Council or Upper House. It sits in Parliament House in the state capital, Hobart.
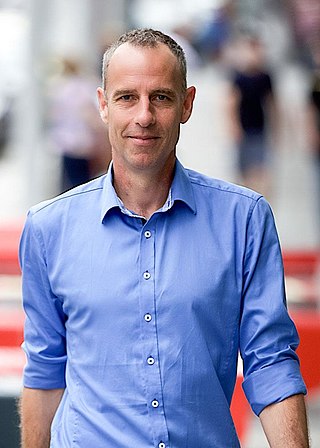
Nicholas James McKim is an Australian politician, currently a member of the Australian Senate representing Tasmania. He was previously a Tasmanian Greens member of the Tasmanian House of Assembly elected at the 2002 election, representing the Franklin electorate from 2002 to 2015, and led the party from 2008 until 2014. On 21 April 2010, he became the first member of the Greens in any Australian ministry. From February 2020 until June 2022, he served as co-deputy leader of the Australian Greens.
A general election for the Tasmanian House of Assembly was held on Saturday 20 July 2002. The Labor government led by Premier Jim Bacon was won a second term against the Liberal Party Opposition headed by Opposition Leader Bob Cheek in a landslide. The election was marked by a strong swing to both the Labor Party and the Tasmanian Greens at the expense of the Liberals, with Cheek losing his own seat.
The 1998 Tasmanian state election was held on Saturday, 29 August 1998 in the Australian state of Tasmania to elect 25 members of the Tasmanian House of Assembly. The number of members was reduced from 35 to 25. The election used the Hare-Clark proportional representation system—five members were elected from each of five electorates. The quota required for election increased from 12.5% to 16.7%.
The 1996 Tasmanian state election was held on 24 February 1996 in the Australian state of Tasmania to elect 35 members of the Tasmanian House of Assembly. The election used the Hare-Clark proportional representation system — seven members were elected from each of five electorates. The quota required for election was 12.5% in each division.
The 1986 Tasmanian state election was held on 8 February 1986 in the Australian state of Tasmania to elect 35 members of the Tasmanian House of Assembly. The election used the Hare-Clark proportional representation system — seven members were elected from each of five electorates. The quota required for election was 12.5% in each division.
The 1982 Tasmanian state election was held on 15 May 1982 in the Australian state of Tasmania to elect 35 members of the Tasmanian House of Assembly. The election used the Hare-Clark proportional representation system — seven members were elected from each of five electorates. The quota required for election was 12.5% in each division.
The 1969 Tasmanian state election was held on 10 May 1969 in the Australian state of Tasmania to elect 35 members of the Tasmanian House of Assembly. The election used the Hare-Clark proportional representation system — seven members were elected from each of five electorates.
The 1972 Tasmanian state election was held on 22 April 1972 in the Australian state of Tasmania to elect 35 members of the Tasmanian House of Assembly. The election used the Hare-Clark proportional representation system — seven members were elected from each of five electorates.
The 1976 Tasmanian state election was held on 11 December 1976 in the Australian state of Tasmania to elect 35 members of the Tasmanian House of Assembly. The election used the Hare-Clark proportional representation system — seven members were elected from each of five electorates.
The 1979 Tasmanian state election was held on 28 July 1979 in the Australian state of Tasmania to elect 35 members of the Tasmanian House of Assembly. The election used the Hare-Clark proportional representation system — seven members were elected from each of five electorates. The quota required for election was 12.5% in each division.
This is a list of House of Assembly results for the 2006 Tasmanian election.
This is a list of House of Assembly results for the 2002 Tasmanian election.
This is a list of House of Assembly results for the 1998 Tasmanian election.
This is a list of House of Assembly results for the 1996 Tasmanian election.
This is a list of House of Assembly results for the 1992 Tasmanian election.
This is a list of House of Assembly results for the 1989 Tasmanian election.
This is a list of House of Assembly results for the 1986 Tasmanian election.
This is a list of House of Assembly results for the 1982 Tasmanian election.
This is a list of House of Assembly results for the 1979 Tasmanian election.