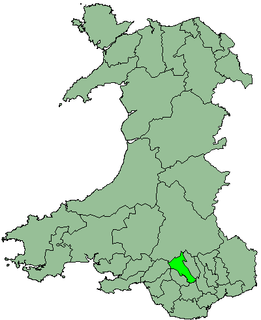
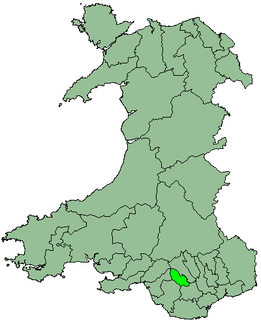
The first election to Rhondda Cynon Taf County Borough Council was held on 4 May 1995. [1] It was followed by the 1999 election. On the same day there were elections to the other 21 local authorities in Wales and community councils in Wales.
Rhondda Cynon Taf County Borough Council is the governing body for Rhondda Cynon Taf, one of the Principal Areas of Wales. The council headquarters are located in the town of Clydach Vale.
All council seats were up for election. These were the first elections held following local government reorganisation and the abolition of Mid Glamorgan County Council. The ward boundaries for the new authority were based on the previous Cynon Valley Borough Council, Rhondda Borough Council and Taff Ely Borough Council although the number of members elected for individual wards was reduced.
Mid Glamorgan is a preserved county of Wales. From 1974 until 1996 it was also an administrative county with a county council.
Cynon Valley is one of many former coal mining valleys within the South Wales Valleys of Wales. Cynon Valley lies between Rhondda and the Merthyr Valley and takes its name from the River Cynon. Cynon Valley has two main towns; Aberdare located in the North of the Valley and Mountain Ash located in the South of the Valley.
Rhondda was a local government district in the geographical area of the Rhondda Valley, south Wales.
Labour won a majority of the seats. [2]
Party | Seats | Gains | Losses | Net gain/loss | Seats % | Votes % | Votes | +/− | |
---|---|---|---|---|---|---|---|---|---|
Labour | 54 | ||||||||
Conservative | 0 | ||||||||
Liberal Democrat | 1 | ||||||||
Plaid Cymru | 14 | ||||||||
Independent | 3 | ||||||||
Green | 0 | ||||||||
Independent Labour | 1 | ||||||||
Other parties | 1 |
Most sitting members of Mid Glamorgan County council sought election to the new authority. A number were also members of the previous district councils but others contested a ward against a sitting district councillor.
The boundaries were identical to those of the same ward on the previous Cynon Valley Borough Council.
Party | Candidate | Votes | % | ± | |
---|---|---|---|---|---|
Labour | B. Fitzgerald* | 1,399 | 38.01% | ||
Labour | Anthony Christopher* | 1,364 | 37.06% | ||
Plaid Cymru | C.M. Badham | 459 | 12.47% | ||
Plaid Cymru | G. Lewis | 458 | 12.44% | ||
Majority | 905 | 24.59% | |||
Turnout | 3680 | 49% | |||
Registered electors | 3,975 | ||||
Labour hold | Swing |
The boundaries were identical to those of the same ward on the previous Cynon Valley Borough Council.
Party | Candidate | Votes | % | ± | |
---|---|---|---|---|---|
Plaid Cymru | A.D. Griffiths* | 958 | 24.56% | ||
Plaid Cymru | B.J. Walter Codd* | 936 | 24% | ||
Labour | B.R. Loveridge | 731 | 18.74% | ||
Labour | J. Rosser | 725 | 18.59% | ||
Independent Plaid | H.E. Davies* | 550 | 14.10% | ||
Majority | 205 | 5.26% | |||
Turnout | 3900 | 55.9% | |||
Registered electors | 3,731 | ||||
Plaid Cymru hold | Swing |
The boundaries were identical to those of the same ward on the previous Cynon Valley Borough Council.
Party | Candidate | Votes | % | ± | |
---|---|---|---|---|---|
Labour | Alby .L. Davies* | 1,288 | 29.06% | ||
Independent Labour | Stuart .G. Gregory* | 1,088 | 24.54% | ||
Labour | P.C. Brown* | 971 | 21.91% | ||
Plaid Cymru | B. Hicks | 624 | 14.08% | ||
Plaid Cymru | D. Surfield | 367 | 8.28% | ||
Green | John Matthews | 94 | 2.12% | ||
Majority | 117 | 2.64% | |||
Turnout | 4432 | 49.1% | |||
Registered electors | 4,846 | ||||
Labour hold | Swing | ||||
Independent Labour win (new seat) |
The boundaries were identical to those of the same ward on the previous Cynon Valley Borough Council.
Party | Candidate | Votes | % | ± | |
---|---|---|---|---|---|
Labour | Shah .M. Imtiaz* | 1,437 | 34.29% | ||
Labour | Mike Forey* | 1,292 | 31% | ||
Plaid Cymru | D.A. Walters | 728 | 17.47% | ||
Plaid Cymru | S. Thomas | 710 | 17.04% | ||
Majority | 564 | 13.53% | |||
Turnout | 4167 | 44% | |||
Registered electors | 5,044 | ||||
Labour hold | Swing |
Party | Candidate | Votes | % | ± | |
---|---|---|---|---|---|
Plaid Cymru | W. John Daniel* | 1,369 | 18.14% | ||
Labour | J.A. Evans* | 1,347 | 17.85% | ||
Plaid Cymru | E.A. Daniel | 1,316 | 17.44% | ||
Plaid Cymru | A. Mason* | 1,307 | 17.32% | ||
Labour | M. James* | 1,114 | 14.76% | ||
Labour | D.E. Morgan* | 1,092 | 14.47% | ||
Majority | 9 | 0.12% | |||
Turnout | 7545 | 42.5% | |||
Registered electors | 6,626 | ||||
Plaid Cymru hold | Swing | ||||
Labour hold | Swing | ||||
Plaid Cymru win (new seat) |
The boundaries were identical to those of the same ward on the previous Taff Ely Borough Council.
Party | Candidate | Votes | % | ± | |
---|---|---|---|---|---|
Labour | Daniel Ifor Williams | 830 | 74.57% | ||
Plaid Cymru | M. Eileen Dobbin* | 283 | 25.43% | ||
Majority | 547 | 49.15% | |||
Turnout | 1113 | 34.2% | |||
Registered electors | 2,706 | ||||
Labour gain from Plaid Cymru | Swing | ||||
Party | Candidate | Votes | % | ± | |
---|---|---|---|---|---|
Independent | A.D. Hughes | 472 | 51.47% | ||
Labour | S.M. Harry* | 445 | 48.53% | ||
Majority | 27 | 2.94% | |||
Turnout | 917 | 35.6% | |||
Registered electors | 2,593 | ||||
Independent (Politician) gain from Labour | Swing | ||||
The boundaries were identical to those of the same ward on the previous Taff Ely Borough Council.
Party | Candidate | Votes | % | ± | |
---|---|---|---|---|---|
Labour | Graham Stacey* | 609 | 59.07% | ||
Plaid Cymru | R.D. Boundford | 422 | 40.93% | ||
Majority | 187 | 18.14% | |||
Turnout | 1031 | 46.7% | |||
Registered electors | 2,256 | ||||
Labour hold | Swing |
Party | Candidate | Votes | % | ± | |
---|---|---|---|---|---|
Labour | Wendy .E. Morgan | 496 | 48.44% | ||
Independent | Steve Belzak* | 393 | 38.38% | ||
Plaid Cymru | G.R. Davies | 135 | 13.08% | ||
Majority | 103 | 10.06% | |||
Turnout | 1024 | 48.5% | |||
Registered electors | 2,111 | ||||
Labour gain from Independent | Swing | ||||
Party | Candidate | Votes | % | ± | |
---|---|---|---|---|---|
Labour | M.M. Evans* | 922 | 73.58% | ||
Plaid Cymru | E.L. Smith | 331 | 26.42% | ||
Majority | 591 | 47.17% | |||
Turnout | 1253 | 38.7% | |||
Registered electors | 3,500 | ||||
Labour hold | Swing |
Party | Candidate | Votes | % | ± | |
---|---|---|---|---|---|
Labour | E.T. Jones* | 796 | 62.14% | ||
Plaid Cymru | R.W. Jones | 439 | 34.27% | ||
Green | S. Davies | 46 | 3.59% | ||
Majority | 357 | 27.87% | |||
Turnout | 1,281 | 53% | |||
Registered electors | 2,418 | ||||
Labour hold | Swing |
Party | Candidate | Votes | % | ± | |
---|---|---|---|---|---|
Labour | Eurwen Davies* | 1,241 | 33.6% | ||
Labour | A.M. Ellis* | 1,199 | 32.47% | ||
Plaid Cymru | I. Griffiths | 720 | 19.5% | ||
Independent | M.D. Simons | 313 | 8.48% | ||
Green | R. Gair | 220 | 5.96% | ||
Majority | 479 | 12.97% | |||
Turnout | 3,693 | 43.7% | |||
Registered electors | 4,779 | ||||
Labour hold | Swing | ||||
Labour hold | Swing |
Party | Candidate | Votes | % | ± | |
---|---|---|---|---|---|
Labour | Annette Davies | 1,511 | 42.88% | ||
Labour | K. Rees | 1,105 | 31.36% | ||
Plaid Cymru | V. Thomas | 734 | 20.83% | ||
Green | K. Franks | 174 | 4.94% | ||
Majority | 371 | 10.58% | |||
Turnout | 3,524 | 52.8% | |||
Registered electors | 3,628 | ||||
Labour win (new seat) | |||||
Labour win (new seat) |
Party | Candidate | Votes | % | ± | |
---|---|---|---|---|---|
Residents | Aurfron Roberts | 878 | 62.94% | ||
Labour | C.E. Cowley* | 517 | 37.06% | ||
Majority | 361 | 25.88% | |||
Turnout | 1,395 | 54% | |||
Registered electors | 2,601 | ||||
Residents (Politician) gain from Labour | Swing | ||||
Party | Candidate | Votes | % | ± | |
---|---|---|---|---|---|
Labour | Judith G. Burford* | 756 | 73.04% | ||
Plaid Cymru | M.A. Wiley | 279 | 26.96% | ||
Majority | 477 | 46.09% | |||
Turnout | 1,035 | 48.3% | |||
Registered electors | 2,172 | ||||
Labour hold | Swing |
Party | Candidate | Votes | % | ± | |
---|---|---|---|---|---|
Labour | Joyce Cass* | 708 | 69.1% | ||
Liberal Democrat | Robert .G. Fox* | 316 | 30.9% | ||
Majority | 392 | 38.28% | |||
Turnout | 1,024 | 53.8% | |||
Registered electors | 1,910 | ||||
Labour win (new seat) |
Party | Candidate | Votes | % | ± | |
---|---|---|---|---|---|
Independent | A.J. Wells | 327 | 47.88% | ||
Labour | A.J. Jenkins | 288 | 42.17% | ||
Plaid Cymru | G.E. Rees* | 68 | 9.96% | ||
Majority | 39 | 5.71% | |||
Turnout | 683 | 43.8% | |||
Registered electors | 1,609 | ||||
Independent win (new seat) |
Party | Candidate | Votes | % | ± | |
---|---|---|---|---|---|
Labour | W.A. Myring* | 922 | 65.81% | ||
Plaid Cymru | L.M. Lewis | 479 | 34.19% | ||
Majority | 443 | 31.62% | |||
Turnout | 1401 | 44.1% | |||
Registered electors | 3,172 | ||||
Labour hold | Swing |
Party | Candidate | Votes | % | ± | |
---|---|---|---|---|---|
Labour | G. Waters* | 497 | 61.06% | ||
Plaid Cymru | J.R. Dilworth | 317 | 38.94% | ||
Majority | 180 | 22.11% | |||
Turnout | 814 | 35.2% | |||
Registered electors | 2,311 | ||||
Labour hold | Swing |
Janet Davies, leader of the Taff Ely Borough Council since 1991, was defeated by a Labour opponent.
Janet Marion Davies is a Plaid Cymru Welsh politician. She was the National Assembly for Wales Member for South Wales West from 1999 to 2007, retiring at the 2007 election.
Party | Candidate | Votes | % | ± | |
---|---|---|---|---|---|
Labour | W.R. Thomas | 659 | 63.67% | ||
Plaid Cymru | Janet Davies* | 376 | 36.33% | ||
Majority | 283 | 27.34% | |||
Turnout | 1,035 | 57.3% | |||
Registered electors | 1,810 | ||||
Labour gain from Plaid Cymru | Swing | ||||
Party | Candidate | Votes | % | ± | |
---|---|---|---|---|---|
Plaid Cymru | Islwyn Wilkins | 714 | 50.57% | ||
Labour | Eddie J. Thomas* | 698 | 49.43% | ||
Majority | 16 | 1.13% | |||
Turnout | 1412 | 46.6% | |||
Registered electors | 3,110 | ||||
Plaid Cymru gain from Labour | Swing | ||||
Party | Candidate | Votes | % | ± | |
---|---|---|---|---|---|
Labour | David .F. Stone* | 741 | 26.86% | ||
Labour | Mike .W. Kear | 729 | 26.42% | ||
Plaid Cymru | Dennis .R. Watkins | 661 | 23.96% | ||
Plaid Cymru | Bernard .P. Channon | 628 | 22.76% | ||
Majority | 68 | 2.46% | |||
Turnout | 2,759 | 35% | |||
Registered electors | 4,196 | ||||
Labour hold | Swing | ||||
Labour win (new seat) |
Party | Candidate | Votes | % | ± | |
---|---|---|---|---|---|
Labour | E. Emanuel* | 663 | 65.3% | ||
Plaid Cymru | C. Coombe | 353 | 34.7% | ||
Majority | 310 | 30.5% | |||
Turnout | 1,016 | 54% | |||
Registered electors | 1,882 | ||||
Labour hold | Swing |
Party | Candidate | Votes | % | ± | |
---|---|---|---|---|---|
Labour | B. Jones* | 1,057 | 64.14% | ||
Plaid Cymru | G. Evans | 591 | 35.86% | ||
Majority | 466 | 28.28% | |||
Turnout | 1,648 | 55.2% | |||
Registered electors | 2,998 | ||||
Labour hold | Swing |
Party | Candidate | Votes | % | ± | |
---|---|---|---|---|---|
Plaid Cymru | Pauline Jarman* | 764 | 66.78% | ||
Labour | E. Rose | 380 | 33.22% | ||
Majority | 384 | 33.57% | |||
Turnout | 1,144 | 49.33% | |||
Registered electors | 2,319 | ||||
Plaid Cymru hold | Swing |
Party | Candidate | Votes | % | ± | |
---|---|---|---|---|---|
Labour | G. Davies | 719 | 27.6% | ||
Plaid Cymru | C.T. Benney* | 709 | 27.22% | ||
Plaid Cymru | J.I. Lordac* | 670 | 25.72% | ||
Labour | I. Jones | 507 | 19.46% | ||
Turnout | 2,605 | 40.1% | |||
Registered electors | 3,571 | ||||
Labour gain from Plaid Cymru | Swing | ||||
Plaid Cymru hold | Swing |
Party | Candidate | Votes | % | ± | |
---|---|---|---|---|---|
Labour | T. Dower* | 1,114 | |||
Plaid Cymru | P.A.M. Butler* | 1,032 | |||
Labour | J. Lewis | 999 | |||
Plaid Cymru | D.M. Lewis* | 792 | |||
Turnout | |||||
Labour win (new seat) | |||||
Plaid Cymru win (new seat) |
Party | Candidate | Votes | % | ± | |
---|---|---|---|---|---|
Labour | J. Jenkins | 1,177 | |||
Labour | D. Thomas | 1,083 | |||
Plaid Cymru | R. Davey | 674 | |||
Plaid Cymru | M. Davey | 623 | |||
Turnout | |||||
Labour win (new seat) | |||||
Labour win (new seat) |
Party | Candidate | Votes | % | ± | |
---|---|---|---|---|---|
Plaid Cymru | Leanne Wood | 1,427 | |||
Labour | B. Rowland* | 1,204 | |||
Labour | D.M. Davies* | 1,135 | |||
Plaid Cymru | D.J. Davies | 1,071 | |||
Turnout | |||||
Plaid Cymru win (new seat) | |||||
Labour win (new seat) |
Party | Candidate | Votes | % | ± | |
---|---|---|---|---|---|
Labour | D. Barnsley* | 833 | |||
Plaid Cymru | G.R. Benney | 205 | |||
Majority | |||||
Turnout | |||||
Labour win (new seat) |
Party | Candidate | Votes | % | ± | |
---|---|---|---|---|---|
Plaid Cymru | Jonathan .V. Huish* | 585 | |||
Labour | Mike .A. Hayes | 551 | |||
Independent Plaid | R.Gordon Norman | 523 | |||
Majority | |||||
Turnout | |||||
Plaid Cymru win (new seat) |
Party | Candidate | Votes | % | ± | |
---|---|---|---|---|---|
Labour | P.G. James | 753 | |||
Plaid Cymru | Clayton F. Jones* | 530 | |||
Majority | |||||
Turnout | |||||
Labour win (new seat) |
Party | Candidate | Votes | % | ± | |
---|---|---|---|---|---|
Labour | N.G. Stonelake* | 1,274 | |||
Labour | L.J. Rees | 1,232 | |||
Plaid Cymru | M. Jenkins* | 749 | |||
Green | C. Jakeway | 274 | |||
Turnout | |||||
Labour win (new seat) | |||||
Labour win (new seat) |
Party | Candidate | Votes | % | ± | |
---|---|---|---|---|---|
Plaid Cymru | R. Moses* | 612 | |||
Labour | J.B. Price | 204 | |||
Majority | |||||
Turnout | |||||
Plaid Cymru win (new seat) |
Party | Candidate | Votes | % | ± | |
---|---|---|---|---|---|
Labour | G.J. Beard | 1,035 | |||
Labour | W.J. Williams | 943 | |||
Plaid Cymru | R.M. James | 535 | |||
Plaid Cymru | C.J. Pritchard | 423 | |||
Liberal Democrat | R.M. Deacon | 241 | |||
Turnout | |||||
Labour win (new seat) | |||||
Labour win (new seat) |
Party | Candidate | Votes | % | ± | |
---|---|---|---|---|---|
Labour | Henry .J. Cox* | 697 | |||
Independent | V.J. Thomas | 184 | |||
Plaid Cymru | W.J. Daniel | 90 | |||
Majority | |||||
Turnout | |||||
Labour win (new seat) |
Party | Candidate | Votes | % | ± | |
---|---|---|---|---|---|
Labour | W.John Chessman | 443 | |||
Independent Labour | I. Thomas | 108 | |||
Plaid Cymru | A, Carter* | 48 | |||
Majority | |||||
Turnout | |||||
Labour win (new seat) |
Party | Candidate | Votes | % | ± | |
---|---|---|---|---|---|
Labour | Jeff .D. Lintern | 845 | |||
Plaid Cymru | J.E. Williams | 615 | |||
Majority | |||||
Turnout | |||||
Labour win (new seat) |
Party | Candidate | Votes | % | ± | |
---|---|---|---|---|---|
Labour | Colin .R. Thorngate | 342 | |||
Plaid Cymru | Wayne Owen | 255 | |||
Liberal Democrat | M.K. Marchant | 244 | |||
Majority | |||||
Turnout | |||||
Labour win (new seat) |
The boundaries were identical to those of the same ward on the previous Taff Ely Borough Council.
Party | Candidate | Votes | % | ± | |
---|---|---|---|---|---|
Labour | W.John David | 923 | 27.84% | ||
Labour | Mary Lloyd* | 901 | 27.18% | ||
Plaid Cymru | D.E. Jones | 776 | 23.41% | ||
Plaid Cymru | D.R. Reilly | 715 | 21.57% | ||
Majority | 125 | 3.77% | |||
Turnout | 3315 | 100% | |||
Labour hold | Swing | ||||
Labour win (new seat) |
Party | Candidate | Votes | % | ± | |
---|---|---|---|---|---|
Labour | A. Edwards* | 778 | |||
Independent Labour | D. Morgan* | 501 | |||
Plaid Cymru | S. Morris | 332 | |||
Green | L. Thomas | 43 | |||
Majority | |||||
Turnout | |||||
Labour win (new seat) |
Party | Candidate | Votes | % | ± | |
---|---|---|---|---|---|
Labour | Russel Roberts* | 1,186 | |||
Labour | R. B. McDonald* | 1,038 | |||
Residents | J.R. Hughes | 505 | |||
Turnout | |||||
Labour win (new seat) | |||||
Labour win (new seat) |
Party | Candidate | Votes | % | ± | |
---|---|---|---|---|---|
Labour | D.McDonald | 932 | |||
Residents | J.R. Hughes | 505 | |||
Majority | |||||
Turnout | |||||
Labour win (new seat) |
Party | Candidate | Votes | % | ± | |
---|---|---|---|---|---|
Labour | Allen .W. Bevan | 803 | |||
Liberal Democrat | A. Southgate | 508 | |||
Majority | |||||
Turnout | |||||
Labour win (new seat) |
Party | Candidate | Votes | % | ± | |
---|---|---|---|---|---|
Labour | W.J. Murphy* | 1,075 | |||
Plaid Cymru | D.M. James | 280 | |||
Majority | |||||
Turnout | |||||
Labour win (new seat) |
Party | Candidate | Votes | % | ± | |
---|---|---|---|---|---|
Labour | L.S. Whitehead | 494 | |||
Plaid Cymru | A.W. Richards | 402 | |||
Independent | A.O. Otley* | 220 | |||
Labour win (new seat) | |||||
Majority | |||||
Turnout |
Party | Candidate | Votes | % | ± | |
---|---|---|---|---|---|
Plaid Cymru | Geraint Rhys Davies* | 1,487 | |||
Labour | R.J. Bundock | 1,371 | |||
Plaid Cymru | D.H. Rees* | 1,357 | |||
Labour | M.A. Phillips | 1,311 | |||
Green | K.G. Morris | 101 | |||
Turnout | |||||
Plaid Cymru win (new seat) | |||||
Labour win (new seat) |
Party | Candidate | Votes | % | ± | |
---|---|---|---|---|---|
Labour | K. Winter | 2,036 | |||
Labour | D.M. Lewis* | 1,704 | |||
Labour | M. Williams* | 1,679 | |||
Plaid Cymru | P.J. Jones | 1,497 | |||
Plaid Cymru | L. Jones* | 1,369 | |||
Plaid Cymru | I.M. Price | 1,179 | |||
Green | Kevin Jakeway | 160 | |||
Turnout | |||||
Labour win (new seat) | |||||
Labour win (new seat) |
Party | Candidate | Votes | % | ± | |
---|---|---|---|---|---|
Labour | D.R. Bevan* | 1,324 | |||
Labour | J. Scobie* | 1,173 | |||
Plaid Cymru | M.G.H. Williams | 472 | |||
Independent Labour | I.M. Jenkins* | 405 | |||
Green | J.A. Powderhill | 80 | |||
Turnout | |||||
Labour win (new seat) | |||||
Labour win (new seat) |
The boundaries were identical to those of the same ward on the previous Taff Ely Borough Council.
Party | Candidate | Votes | % | ± | |
---|---|---|---|---|---|
Labour | Clayton .J. Willis | 1,018 | 86.05% | ||
Plaid Cymru | Diana Watkins | 165 | 13.95% | ||
Majority | 853 | 72.10% | |||
Turnout | 1183 | 100% | |||
Labour hold | Swing |
Party | Candidate | Votes | % | ± | |
---|---|---|---|---|---|
Labour | R. Davies* | unopposed | |||
Labour win (new seat) | |||||
Majority | |||||
Turnout |
Party | Candidate | Votes | % | ± | |
---|---|---|---|---|---|
Labour | Christine Chapman | 696 | |||
Plaid Cymru | G.I. Jones* | 695 | |||
Independent | D.S. Breeze* | 204 | |||
Majority | |||||
Turnout | |||||
Labour win (new seat) |
Party | Candidate | Votes | % | ± | |
---|---|---|---|---|---|
Plaid Cymru | Jill Evans* | 1,656 | |||
Plaid Cymru | Syd Morgan* | 1,299 | |||
Labour | I. Brace | 1,122 | |||
Labour | R. David | 940 | |||
Natural Law | G.B. Duguay | 48 | |||
Green | R.K. Greenhill | 46 | |||
Turnout | |||||
Plaid Cymru win (new seat) | |||||
Plaid Cymru win (new seat) |
Maerdy is a village and community in the county borough of Rhondda Cynon Taf, and within the historic county boundaries of Glamorgan, Wales, lying at the head of the Rhondda Fach Valley.
Ynyshir is a village and community located in the Rhondda Valley, within Rhondda Cynon Taf, South Wales. Ynyshir is pronounced (ənɪs-hiːr) according to the International Phonetic Alphabet (IPA), and means "long island" in Welsh. The village takes its name from a farm in the area, falling within the historic parishes of Ystradyfodwg and Llanwynno (Llanwonno). The community of Ynyshir lies between the small adjoining village of Wattstown and the larger town of neighbouring Porth.
Tylorstown is a village and community located in the Rhondda valley, in the county borough of Rhondda Cynon Taf, Wales. It is neighboured by the villages of Blaenllechau, Ferndale, Penrhys, Pontygwaith and Stanleytown.
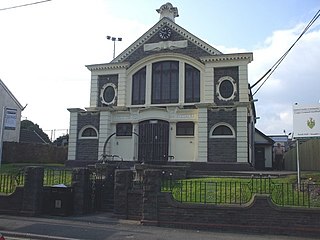
Church Village is a large village in the historic parish and community of Llantwit Fardre, located within the Taff Ely district of the County Borough of Rhondda Cynon Taf in Wales. The village is centrally located being around 4 miles from the local principal towns of Llantrisant to the southwest and Pontypridd to the north and is situated around 10 miles northwest of Cardiff city centre.
Penygraig is a village and community in the Rhondda Valley in the county borough of Rhondda Cynon Taf, Wales. As a community Penygraig contains the neighbouring districts of Dinas, Edmondstown, Penrhiwfer and Williamstown. Penygraig is within the historic county boundaries of Glamorgan,.
Pontypridd Urban District Council was a local authority in Glamorgan, Wales. It was created in 1894 as a result of the 1894 Local Government of England and Wales Act and the Pontypridd Urban District Council election, 1894 saw the election of the first members of the authority. The Council existed until 1973 and replaced the Pontypridd Local Board of Health which had functioned for some years. Its boundaries were set in 1894. Initially, the Council had eighteen members but this was increased some years later, as a result of the increase in population. There were six wards, namely Cilfynydd, Graig, Pontypridd Town, Rhondda, Trallwn and Treforest.
The community of Llwydcoed, Rhondda Cynon Taf was, for much of the twentieth century, and electoral ward for the purposes of electing members to Glamorgan County Council and the Aberdare Urban District Council. Llwydcoed is no longer an electoral ward but forms part of Aberdare West and Llwydcoed electoral ward for the purposes of Rhondda Cynon Taf unitary authority elections
The first election to the Neath Port Talbot County Borough Council was held on 4 May 1995. It was followed by the 1999 election. On the same day there were elections to the other 21 local authorities in Wales and community councils in Wales.
The first election to the Bridgend County Borough Council was held on 4 May 1995. It was followed by the 1999 election. On the same day there were elections to the other 21 local authorities in Wales and community councils in Wales.
The second election to Rhondda Cynon Taf County Borough Council was held on 4 May 1995. It was preceded by the 1995 election and followed by the 2004 election. On the same day there were elections to the other 21 local authorities in Wales and community councils in Wales and the first elections to the National Assembly for Wales were held.
The second election to Merthyr Tydfil County Borough Council following the re-organization of local government in Wales was held on 6 May 1999. It was preceded by the 1995 election and followed by the 2004 election. On the same day the first elections to the Welsh Assembly were held as well as elections to the other 21 local authorities in Wales.
Tyn-y-nant is a district of the village of Beddau within the town and community of Llantrisant, represented by the electoral ward of the same name, within Rhondda Cynon Taf, South Wales, and includes the area of Gwaun Meisgin.
The third election to Rhondda Cynon Taf County Borough Council was held in June 2004. It was preceded by the 1999 election and followed by the 2008 election. On the same day there were elections to the other 21 local authorities in Wales and community councils in Wales and the first elections to the National Assembly for Wales were held.
Aberdare East is a local government community and electoral ward in Rhondda Cynon Taf, Wales. The community was formed in 2016 when the former community of Aberdare was split into two. Aberdare East includes the main town of Aberdare.
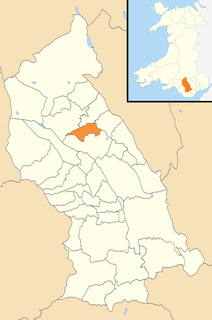
Aberaman North is a community and coterminous electoral ward in Rhondda Cynon Taf, Wales. It primarily includes the village of Aberaman. The community was formed in 2016 when the larger community of Aberaman was split into North and South.
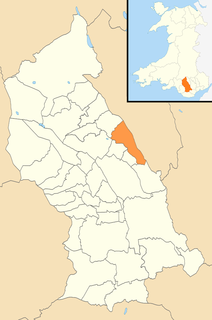
Mountain Ash East is a community and coterminous electoral ward in Rhondda Cynon Taf, Wales. It primarily includes the part of the village of Mountain Ash east of the River Cynon. The community was formed in 2016 when the larger community of Mountain Ash was divided into East and West to match the ward boundaries.
Cwm Clydach is a community and electoral ward to the northwest of Tonypandy in Rhondda Cynon Taf, Wales. The community and ward covers the valley of the Nant Clydach, which includes the cojoined villages of Clydach Vale and Blaenclydach.