Lidar is a method for determining ranges by targeting an object or a surface with a laser and measuring the time for the reflected light to return to the receiver. It can also be used to make digital 3-D representations of areas on the Earth's surface and ocean bottom of the intertidal and near coastal zone by varying the wavelength of light. It has terrestrial, airborne, and mobile applications.

A digital elevation model (DEM) is a 3D computer graphics representation of elevation data to represent terrain, commonly of a planet, moon, or asteroid. A "global DEM" refers to a discrete global grid. DEMs are used often in geographic information systems, and are the most common basis for digitally produced relief maps.

Topography is the study of the forms and features of land surfaces. The topography of an area could refer to the land forms and features themselves, or a description.

Hydrographic survey is the science of measurement and description of features which affect maritime navigation, marine construction, dredging, offshore oil exploration/offshore oil drilling and related activities. Strong emphasis is placed on soundings, shorelines, tides, currents, seabed and submerged obstructions that relate to the previously mentioned activities. The term hydrography is used synonymously to describe maritime cartography, which in the final stages of the hydrographic process uses the raw data collected through hydrographic survey into information usable by the end user.
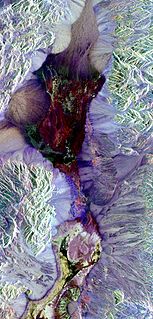
Remote sensing is the acquisition of information about an object or phenomenon without making physical contact with the object, in contrast to in situ or on-site observation. The term is applied especially to acquiring information about Earth and other planets. Remote sensing is used in numerous fields, including geography, land surveying and most Earth science disciplines ; it also has military, intelligence, commercial, economic, planning, and humanitarian applications, among others.

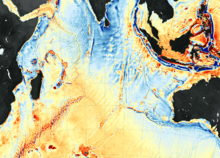
A bathymetric chart is a type of isarithmic map that depicts the submerged topography and physiographic features of ocean and sea bottoms. Their primary purpose is to provide detailed depth contours of ocean topography as well as provide the size, shape and distribution of underwater features. Topographic maps display elevation above ground and are complementary to bathymetric charts. Charts use a series of lines and points at equal intervals to showcase depth or elevation. A closed shape with increasingly smaller shapes inside of it can indicate an ocean trench or a seamount, or underwater mountain, depending on whether the depths increase or decrease going inward.
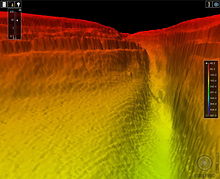
Bathymetry is the study of underwater depth of ocean floors, lake floors, or river floors. In other words, bathymetry is the underwater equivalent to hypsometry or topography. The first recorded evidence of water depth measurements are from Ancient Egypt over 3000 years ago. Bathymetric charts are typically produced to support safety of surface or sub-surface navigation, and usually show seafloor relief or terrain as contour lines and selected depths (soundings), and typically also provide surface navigational information. Bathymetric maps may also use a Digital Terrain Model and artificial illumination techniques to illustrate the depths being portrayed. The global bathymetry is sometimes combined with topography data to yield a global relief model. Paleobathymetry is the study of past underwater depths.

MEdium Resolution Imaging Spectrometer (MERIS) was one of the main instruments on board the European Space Agency (ESA)'s Envisat platform. The sensor was in orbit from 2002 to 2012. ESA formally announced the end of Envisat's mission on 9 May 2012.

Ocean color is the branch of ocean optics that specifically studies the color of the water and information that can be gained from looking at variations in color. The color of the ocean, while mainly blue, actually varies from blue to green or even yellow, brown or red in some cases. This field of study developed alongside water remote sensing, so it is focused mainly on how color is measured by instruments.
Electro-optical MASINT is a subdiscipline of Measurement and Signature Intelligence, (MASINT) and refers to intelligence gathering activities which bring together disparate elements that do not fit within the definitions of Signals Intelligence (SIGINT), Imagery Intelligence (IMINT), or Human Intelligence (HUMINT).
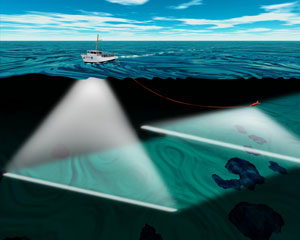
Acoustic seabed classification is the partitioning of a seabed acoustic image into discrete physical entities or classes. This is a particularly active area of development in the field of seabed mapping, marine geophysics, underwater acoustics and benthic habitat mapping. Seabed classification is one route to characterizing the seabed and its habitats. Seabed characterization makes the link between the classified regions and the seabed physical, geological, chemical or biological properties. Acoustic seabed classification is possible using a wide range of acoustic imaging systems including multibeam echosounders, sidescan sonar, single-beam echosounders, interferometric systems and sub-bottom profilers. Seabed classification based on acoustic properties can be divided into two main categories; surficial seabed classification and sub-surface seabed classification. Sub-surface imaging technologies use lower frequency sound to provide higher penetration, whereas surficial imaging technologies provide higher resolution imagery by utilizing higher frequencies.
Remote sensing techniques in archaeology are an increasingly important component of the technical and methodological tool set available in archaeological research. The use of remote sensing techniques allows archaeologists to uncover unique data that is unobtainable using traditional archaeological excavation techniques.
The General Bathymetric Chart of the Oceans (GEBCO) is a publicly available bathymetric chart of the world's oceans. The project was conceived with the aim of preparing a global series of charts showing the general shape of the seafloor. Over the years it has become a reference map of the bathymetry of the world’s oceans for scientists and others.

The Remote Sensing Center (RSC) at the Naval Postgraduate School was established to bring together a range of capabilities and expertise to address problems of military and intelligence importance, as well as environmental and civil concerns. It is specialized in a variety of remote sensing technologies designed to enable people to look beyond the range of human vision in range or in spectral perception.
DART is a 3D radiative transfer model, designed for scientific research, in particular remote sensing. Developed at CESBIO since 1992, DART model was patented in 2003. It is freeware for scientific activities.
The National Centers for Environmental Information (NCEI), an agency of the United States government, manages one of the world's largest archives of atmospheric, coastal, geophysical, and oceanic data, containing information that ranges from the surface of the sun to Earth's core, and from ancient tree ring and ice core records to near-real-time satellite images.
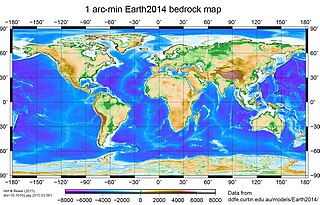
A global relief model, sometimes also denoted as global topography model or composite model, combines digital elevation model (DEM) data over land with digital bathymetry model (DBM) data over water-covered areas to describe Earth's relief. A relief model thus shows how Earth's surface would look like in the absence of water or ice masses.

Remote sensing in geology is remote sensing used in the geological sciences as a data acquisition method complementary to field observation, because it allows mapping of geological characteristics of regions without physical contact with the areas being explored. About one-fourth of the Earth's total surface area is exposed land where information is ready to be extracted from detailed earth observation via remote sensing. Remote sensing is conducted via detection of electromagnetic radiation by sensors. The radiation can be naturally sourced, or produced by machines and reflected off of the Earth surface. The electromagnetic radiation acts as an information carrier for two main variables. First, the intensities of reflectance at different wavelengths are detected, and plotted on a spectral reflectance curve. This spectral fingerprint is governed by the physio-chemical properties of the surface of the target object and therefore helps mineral identification and hence geological mapping, for example by hyperspectral imaging. Second, the two-way travel time of radiation from and back to the sensor can calculate the distance in active remote sensing systems, for example, Interferometric synthetic-aperture radar. This helps geomorphological studies of ground motion, and thus can illuminate deformations associated with landslides, earthquakes, etc.

The Hyperspectral Imager for the Coastal Ocean (HICO) was a hyperspectral earth observation sensor that operated on the International Space Station (ISS) from 2009 to 2014. HICO collected hyperspectral satellite imagery of the earth's surface from the ISS.
An underwater survey is a survey performed in an underwater environment or conducted remotely on an underwater object or region. Survey can have several meanings. The word originates in Medieval Latin with meanings of looking over and detailed study of a subject. One meaning is the accurate measurement of a geographical region, usually with the intention of plotting the positions of features as a scale map of the region. This meaning is often used in scientific contexts, and also in civil engineering and mineral extraction. Another meaning, often used in a civil, structural, or marine engineering context, is the inspection of a structure or vessel to compare actual condition with the specified nominal condition, usually with the purpose of reporting on the actual condition and compliance with, or deviations from, the nominal condition, for quality control, damage assessment, valuation, insurance, maintenance, and similar purposes. In other contexts it can mean inspection of a region to establish presence and distribution of specified content, such as living organisms, either to establish a baseline, or to compare with a baseline.