
In probability theory and statistics, the multivariate normal distribution, multivariate Gaussian distribution, or joint normal distribution is a generalization of the one-dimensional (univariate) normal distribution to higher dimensions. One definition is that a random vector is said to be k-variate normally distributed if every linear combination of its k components has a univariate normal distribution. Its importance derives mainly from the multivariate central limit theorem. The multivariate normal distribution is often used to describe, at least approximately, any set of (possibly) correlated real-valued random variables each of which clusters around a mean value.

In probability theory and statistics, the chi-square distribution with k degrees of freedom is the distribution of a sum of the squares of k independent standard normal random variables. The chi-square distribution is a special case of the gamma distribution and is one of the most widely used probability distributions in inferential statistics, notably in hypothesis testing and in construction of confidence intervals. When it is being distinguished from the more general noncentral chi-square distribution, this distribution is sometimes called the central chi-square distribution.
In mathematical optimization, the method of Lagrange multipliers is a strategy for finding the local maxima and minima of a function subject to equality constraints. The basic idea is to convert a constrained problem into a form such that the derivative test of an unconstrained problem can still be applied. Once stationary points have been identified from the first-order necessary conditions, the definiteness of the bordered Hessian matrix determines whether those points are maxima, minima, or saddle points.
In statistics, Cochran's theorem, devised by William G. Cochran, is a theorem used to justify results relating to the probability distributions of statistics that are used in the analysis of variance.

In mathematics, in particular functional analysis, the singular values, or s-numbers of a compact operator T : X → Y acting between Hilbert spaces X and Y, are the square roots of non-negative eigenvalues of the self-adjoint operator T*T .
In probability theory, a compound Poisson distribution is the probability distribution of the sum of a number of independent identically-distributed random variables, where the number of terms to be added is itself a Poisson-distributed variable. In the simplest cases, the result can be either a continuous or a discrete distribution.

In probability theory and statistics, the noncentral chi-square distribution is a generalization of the chi-square distribution. It often arises in the power analysis of statistical tests in which the null distribution is a chi-square distribution; important examples of such tests are the likelihood-ratio tests.
In probability theory and statistics, the noncentral chi distribution is a generalization of the chi distribution.

In continuum mechanics, the Cauchy stress tensor, true stress tensor, or simply called the stress tensor is a second order tensor named after Augustin-Louis Cauchy. The tensor consists of nine components that completely define the state of stress at a point inside a material in the deformed state, placement, or configuration. The tensor relates a unit-length direction vector n to the traction vector T(n) across an imaginary surface perpendicular to n:
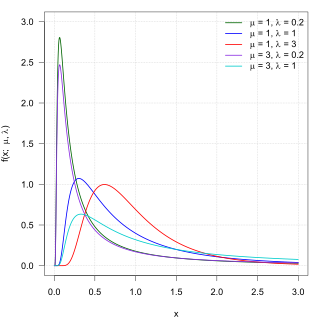
In probability theory, the inverse Gaussian distribution is a two-parameter family of continuous probability distributions with support on (0,∞).
In statistics, the bias of an estimator is the difference between this estimator's expected value and the true value of the parameter being estimated. An estimator or decision rule with zero bias is called unbiased. In statistics, "bias" is an objective property of an estimator.
The possibility that there might be more than one dimension of time has occasionally been discussed in physics and philosophy.

In probability theory and statistics, the Conway–Maxwell–Poisson distribution is a discrete probability distribution named after Richard W. Conway, William L. Maxwell, and Siméon Denis Poisson that generalizes the Poisson distribution by adding a parameter to model overdispersion and underdispersion. It is a member of the exponential family, has the Poisson distribution and geometric distribution as special cases and the Bernoulli distribution as a limiting case.

In statistics, principal component regression (PCR) is a regression analysis technique that is based on principal component analysis (PCA). More specifically, PCA is used for estimating the unknown regression coefficients in a standard linear regression model.
Multiple-try Metropolis (MTM) is a sampling method that is a modified form of the Metropolis–Hastings method, first presented by Liu, Liang, and Wong in 2000. It is designed to help the sampling trajectory converge faster, by increasing both the step size and the acceptance rate.

In probability theory and statistics, the normal-inverse-gamma distribution is a four-parameter family of multivariate continuous probability distributions. It is the conjugate prior of a normal distribution with unknown mean and variance.
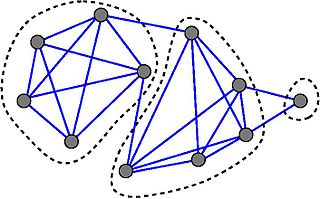
In the branch of mathematics called graph theory, the strength of an undirected graph corresponds to the minimum ratio edges removed/components created in a decomposition of the graph in question. It is a method to compute partitions of the set of vertices and detect zones of high concentration of edges, and is analogous to graph toughness which is defined similarly for vertex removal.
In the field of mathematical analysis, a general Dirichlet series is an infinite series that takes the form of

In the mathematical theory of random matrices, the Marchenko–Pastur distribution, or Marchenko–Pastur law, describes the asymptotic behavior of singular values of large rectangular random matrices. The theorem is named after Ukrainian mathematicians Vladimir Marchenko and Leonid Pastur who proved this result in 1967.
In mathematics, a determinantal point process is a stochastic point process, the probability distribution of which is characterized as a determinant of some function. Such processes arise as important tools in random matrix theory, combinatorics, physics, and wireless network modeling.


