Elections for Suffolk County Council in England were held on 7 June 2001. The whole council was up for election and the council stayed under no overall control.
Suffolk County Council is the administrative authority for the county of Suffolk, England. It is run by 75 elected county councillors representing 63 divisions. It is a member of the East of England Local Government Association.
England is a country that is part of the United Kingdom. It shares land borders with Wales to the west and Scotland to the north-northwest. The Irish Sea lies west of England and the Celtic Sea lies to the southwest. England is separated from continental Europe by the North Sea to the east and the English Channel to the south. The country covers five-eighths of the island of Great Britain, which lies in the North Atlantic, and includes over 100 smaller islands, such as the Isles of Scilly and the Isle of Wight.
In the context of local authorities in the United Kingdom, the term no overall control refers to a situation in which no single political group achieves a majority of seats; and is analogous to a hung parliament. Of the 310 councils who had members up for election in the 2007 local elections, 85 resulted in a NOC administration.
Party | Seats | Gains | Losses | Net gain/loss | Seats % | Votes % | Votes | +/− | |
---|---|---|---|---|---|---|---|---|---|
Labour | 36 | +4 | 45.0 | 34.3 | 108,891 | ||||
Conservative | 31 | +1 | 38.8 | 42.0 | 133,349 | ||||
Liberal Democrat | 12 | -2 | 15.0 | 21.7 | 68,957 | ||||
Independent | 1 | -3 | 1.3 | 1.5 | 4,721 | ||||
Green | 0 | 0 | 0 | 0.3 | 1,104 | ||||
Local Party Bury St Edmunds | 0 | 0 | 0 | 0.2 | 573 | ||||
UKIP | 0 | 0 | 0 | 0.1 | 222 | ||||
Party | Candidate | Votes | % | ± | |
---|---|---|---|---|---|
Labour | Trevor Beckwith | 2,318 | 40.2 | ||
Conservative | Derek Speakman | 1,999 | 34.7 | ||
Liberal Democrat | David Chappell | 853 | 14.8 | ||
Independent | Brian Lockwood | 595 | 10.3 | ||
Majority | 319 | 5.5 | |||
Turnout | 5,765 | 63.5 | |||
Party | Candidate | Votes | % | ± | |
---|---|---|---|---|---|
Labour | Alan Thwaites | 1,754 | 44.3 | ||
Conservative | Keith Standring | 1,386 | 35.0 | ||
Liberal Democrat | Alison Briggs | 815 | 20.6 | ||
Majority | 368 | 9.3 | |||
Turnout | 3,955 | 65.6 | |||
Party | Candidate | Votes | % | ± | |
---|---|---|---|---|---|
Liberal Democrat | Anne Pollard | 3,305 | 62.0 | ||
Conservative | Gerald White | 2,025 | 38.0 | ||
Majority | 1,280 | 24.0 | |||
Turnout | 5,330 | 61.6 | |||
Party | Candidate | Votes | % | ± | |
---|---|---|---|---|---|
Conservative | Russell Harsant | 1,844 | 48.5 | ||
Labour | Lee Mangar | 1,139 | 30.0 | ||
Liberal Democrat | Gregory Elliott | 816 | 21.5 | ||
Majority | 705 | 18.5 | |||
Turnout | 3,799 | 66.3 | |||
Party | Candidate | Votes | % | ± | |
---|---|---|---|---|---|
Conservative | Joanna Spicer | 3,179 | 64.1 | ||
Labour | Alison Fairgrieve | 1,778 | 35.9 | ||
Majority | 1,401 | 28.2 | |||
Turnout | 4,957 | 64.8 | |||
Party | Candidate | Votes | % | ± | |
---|---|---|---|---|---|
Conservative | Richard Church | 1,820 | 52.6 | ||
Liberal Democrat | Peter Perren | 1,642 | 47.4 | ||
Majority | 178 | 5.2 | |||
Turnout | 3,462 | 68.5 | |||
Party | Candidate | Votes | % | ± | |
---|---|---|---|---|---|
Liberal Democrat | Rosalind Scott | 2,214 | 47.4 | ||
Conservative | Ian Mason | 1,578 | 33.8 | ||
Labour | Janet Preece | 881 | 18.9 | ||
Majority | 636 | 13.6 | |||
Turnout | 4,673 | 64.3 | |||
Party | Candidate | Votes | % | ± | |
---|---|---|---|---|---|
Conservative | William Bishop | 2,027 | 61.3 | ||
Labour | Cyril Brown | 1,279 | 38.7 | ||
Majority | 748 | 22.6 | |||
Turnout | 3,306 | 55.6 | |||
Party | Candidate | Votes | % | ± | |
---|---|---|---|---|---|
Conservative | John Roberts | 1,820 | 52.5 | ||
Liberal Democrat | Fiona Jenkins | 1,644 | 47.5 | ||
Majority | 176 | 5.0 | |||
Turnout | 3,464 | 69.2 | |||
Party | Candidate | Votes | % | ± | |
---|---|---|---|---|---|
Labour | Harold Mangar | 1,682 | 57.4 | ||
Conservative | Carlton Vajzovic | 714 | 24.4 | ||
Liberal Democrat | Dale Cartwright | 533 | 18.2 | ||
Majority | 968 | 33.0 | |||
Turnout | 2,929 | 51.3 | |||
Party | Candidate | Votes | % | ± | |
---|---|---|---|---|---|
Labour | Noel Tostevin | 1,233 | 41.8 | ||
Conservative | Mary Young | 1,202 | 40.8 | ||
Liberal Democrat | Jane Chambers | 514 | 17.4 | ||
Majority | 31 | 1.0 | |||
Turnout | 2,949 | 57.4 | |||
Party | Candidate | Votes | % | ± | |
---|---|---|---|---|---|
Conservative | Morris Rose | 1,851 | 45.0 | ||
Labour | Lynn Derges | 1,483 | 36.0 | ||
Liberal Democrat | Roberta Pumer | 781 | 19.0 | ||
Majority | 368 | 9.0 | |||
Turnout | 4,115 | 64.9 | |||
Party | Candidate | Votes | % | ± | |
---|---|---|---|---|---|
Conservative | Steven Hudson | 2,914 | 53.5 | ||
Liberal Democrat | Diana Ball | 2,536 | 46.5 | ||
Majority | 378 | 7.0 | |||
Turnout | 5,450 | 67.0 | |||
Party | Candidate | Votes | % | ± | |
---|---|---|---|---|---|
Labour | Graham Manuel | 1,862 | 50.6 | ||
Conservative | Dale Jackson | 1,817 | 49.4 | ||
Majority | 45 | 1.2 | |||
Turnout | 3,679 | 64.9 | |||
Party | Candidate | Votes | % | ± | |
---|---|---|---|---|---|
Labour | Susan Thomas | 1,405 | 59.6 | ||
Conservative | Kathleen Kenna | 603 | 25.6 | ||
Liberal Democrat | Charles Blue | 351 | 14.9 | ||
Majority | 802 | 34.0 | |||
Turnout | 2,359 | 52.9 | |||
Party | Candidate | Votes | % | ± | |
---|---|---|---|---|---|
Liberal Democrat | Leslie Warmington | 2,118 | 50.6 | ||
Conservative | Peter Stevens | 2,069 | 49.4 | ||
Majority | 49 | 1.2 | |||
Turnout | 4,187 | 66.3 | |||
Party | Candidate | Votes | % | ± | |
---|---|---|---|---|---|
Labour | Joan Girling | 2,441 | 55.5 | ||
Conservative | Peter Batho | 1,958 | 44.5 | ||
Majority | 483 | 11.0 | |||
Turnout | 4,399 | 61.5 | |||
Party | Candidate | Votes | % | ± | |
---|---|---|---|---|---|
Conservative | Patricia O'Brien | 2,950 | 51.3 | ||
Labour | Catherine Knight | 2,139 | 37.2 | ||
Green | John Forbes | 666 | 11.6 | ||
Majority | 811 | 14.1 | |||
Turnout | 5,755 | 65.7 | |||
Party | Candidate | Votes | % | ± | |
---|---|---|---|---|---|
Conservative | Jeremy Pembroke | 1,621 | 51.3 | ||
Liberal Democrat | Vivienne Hoy | 1,539 | 48.7 | ||
Majority | 82 | 2.6 | |||
Turnout | 3,160 | 71.3 | |||
Party | Candidate | Votes | % | ± | |
---|---|---|---|---|---|
Conservative | Donald Levick | 2,071 | 55.5 | ||
Labour | Sheila Malham | 1,663 | 44.5 | ||
Majority | 408 | 11.0 | |||
Turnout | 3,734 | 54.7 | |||
Party | Candidate | Votes | % | ± | |
---|---|---|---|---|---|
Conservative | Margaret Harris | 2,270 | 52.6 | ||
Labour | John Mullen | 1,148 | 26.6 | ||
Liberal Democrat | Lee Reeves | 894 | 20.7 | ||
Majority | 1,122 | 26.0 | |||
Turnout | 4,312 | 70.1 | |||
Party | Candidate | Votes | % | ± | |
---|---|---|---|---|---|
Labour | David Rowe | 1,450 | 35.3 | ||
Conservative | Ann Rodwell | 1,344 | 32.7 | ||
Liberal Democrat | Cherrie MacGregor | 1,311 | 31.9 | ||
Majority | 106 | 2.6 | |||
Turnout | 4,105 | 58.0 | |||
Party | Candidate | Votes | % | ± | |
---|---|---|---|---|---|
Labour | Donald Smith | 2,116 | 58.4 | ||
Conservative | David Bentinck | 1,505 | 41.6 | ||
Majority | 611 | 16.8 | |||
Turnout | 3,621 | 63.6 | |||
Party | Candidate | Votes | % | ± | |
---|---|---|---|---|---|
Liberal Democrat | Peter Howard | 2,123 | 50.9 | ||
Conservative | Christine Carlton | 2,051 | 49.1 | ||
Majority | 72 | 1.8 | |||
Turnout | 4,174 | 68.1 | |||
Party | Candidate | Votes | % | ± | |
---|---|---|---|---|---|
Labour | Ronald Sudds | 1,889 | 60.6 | ||
Conservative | Anthony Ramsey | 793 | 25.4 | ||
Liberal Democrat | Louise Gooch | 435 | 14.0 | ||
Majority | 1,096 | 35.2 | |||
Turnout | 3,117 | 52.2 | |||
Party | Candidate | Votes | % | ± | |
---|---|---|---|---|---|
Liberal Democrat | John Field | 2,325 | 55.8 | ||
Conservative | John Williams | 1,845 | 44.2 | ||
Majority | 480 | 11.6 | |||
Turnout | 4,170 | 62.8 | |||
Party | Candidate | Votes | % | ± | |
---|---|---|---|---|---|
Labour | Wilmoth Gibson | 2,001 | 58.2 | ||
Conservative | Peter Beer | 1,438 | 41.8 | ||
Majority | 563 | 16.4 | |||
Turnout | 3,439 | 58.3 | |||
Party | Candidate | Votes | % | ± | |
---|---|---|---|---|---|
Conservative | Susan Back | 1,384 | 43.8 | ||
Labour | Ernest Skepelhorn | 1,315 | 41.6 | ||
Liberal Democrat | Anthony Tibbitt | 461 | 14.6 | ||
Majority | 69 | 2.2 | |||
Turnout | 3,160 | 62.6 | |||
Party | Candidate | Votes | % | ± | |
---|---|---|---|---|---|
Liberal Democrat | David Grutchfield | 1,526 | 42.1 | ||
Labour | James Quinlan | 1,040 | 28.7 | ||
Conservative | Lesley Chalmers | 698 | 19.3 | ||
Independent | Eileen Banks | 360 | 9.9 | ||
Majority | 486 | 13.4 | |||
Turnout | 3,624 | 64.3 | |||
Party | Candidate | Votes | % | ± | |
---|---|---|---|---|---|
Conservative | Peter Aldous | 2,012 | 54.8 | ||
Labour | Jacqueline Wagner | 1,660 | 45.2 | ||
Majority | 352 | 9.6 | |||
Turnout | 3,672 | 64.8 | |||
Party | Candidate | Votes | % | ± | |
---|---|---|---|---|---|
Conservative | Charles Michell | 2,777 | 59.4 | ||
Labour | Timothy Lodge | 1,897 | 40.6 | ||
Majority | 880 | 18.8 | |||
Turnout | 4,674 | 65.7 | |||
Party | Candidate | Votes | % | ± | |
---|---|---|---|---|---|
Labour | Laurence Kiernan | 2,966 | 60.2 | ||
Conservative | Adam Whittaker | 1,963 | 39.8 | ||
Majority | 1,003 | 20.4 | |||
Turnout | 4,929 | 56.2 | |||
Party | Candidate | Votes | % | ± | |
---|---|---|---|---|---|
Labour | Maggie Lee | 2,536 | 62.3 | ||
Conservative | Anthony Sutton | 1,533 | 37.7 | ||
Majority | 1,003 | 24.6 | |||
Turnout | 4,069 | 51.3 | |||
Party | Candidate | Votes | % | ± | |
---|---|---|---|---|---|
Conservative | Guy McGregor | 2,529 | 51.9 | ||
Liberal Democrat | Robert Van Slooten | 2,343 | 48.1 | ||
Majority | 186 | 3.8 | |||
Turnout | 4,872 | 69.6 | |||
Party | Candidate | Votes | % | ± | |
---|---|---|---|---|---|
Conservative | Jane Andrews-Smith | 2,224 | 64.8 | ||
Labour | Patricia Rucinski | 1,206 | 35.2 | ||
Majority | 1,018 | 29.6 | |||
Turnout | 3,430 | 63.8 | |||
Party | Candidate | Votes | % | ± | |
---|---|---|---|---|---|
Liberal Democrat | Inga Lockington | 1,865 | 47.3 | ||
Conservative | Jeffrey Stansfield | 1,315 | 33.4 | ||
Labour | John Cook | 762 | 19.3 | ||
Majority | 550 | 13.9 | |||
Turnout | 3,942 | 64.8 | |||
Party | Candidate | Votes | % | ± | |
---|---|---|---|---|---|
Labour | Christopher Mole | 1,628 | 54.5 | ||
Conservative | Susan Rush | 742 | 24.8 | ||
Liberal Democrat | Kenneth Toye | 617 | 20.7 | ||
Majority | 886 | 29.7 | |||
Turnout | 2,987 | 47.6 | |||
Party | Candidate | Votes | % | ± | |
---|---|---|---|---|---|
Liberal Democrat | John Kelso | 3,004 | 40.4 | ||
Conservative | Paul West | 2,654 | 35.7 | ||
Labour | Christopher Newbury | 1,778 | 23.9 | ||
Majority | 350 | 4.7 | |||
Turnout | 7,436 | 67.0 | |||
Party | Candidate | Votes | % | ± | |
---|---|---|---|---|---|
Labour | Brian Hunter | 2,336 | 50.8 | ||
Conservative | Stephen Ames | 1,622 | 35.3 | ||
Liberal Democrat | Brian Howe | 636 | 13.8 | ||
Majority | 714 | 15.5 | |||
Turnout | 4,594 | 62.0 | |||
Party | Candidate | Votes | % | ± | |
---|---|---|---|---|---|
Labour | Anthony Andrews | 2,477 | 49.8 | ||
Conservative | Kenneth Sale | 1,744 | 35.1 | ||
Liberal Democrat | David O'Neill | 753 | 15.1 | ||
Majority | 733 | 14.7 | |||
Turnout | 4,974 | 58.1 | |||
Party | Candidate | Votes | % | ± | |
---|---|---|---|---|---|
Labour | Jane Hore | 1,740 | 59.5 | ||
Conservative | Stephen Ardley | 605 | 20.7 | ||
Liberal Democrat | Paul Meadez | 579 | 19.8 | ||
Majority | 1,135 | 38.8 | |||
Turnout | 2,924 | 47.6 | |||
Party | Candidate | Votes | % | ± | |
---|---|---|---|---|---|
Labour | Marie Rodgers | 2,000 | 59.3 | ||
Conservative | Anne Mylan | 917 | 27.2 | ||
Liberal Democrat | Darren Ware | 458 | 13.6 | ||
Majority | 1,083 | 32.1 | |||
Turnout | 3,375 | 58.6 | |||
Party | Candidate | Votes | % | ± | |
---|---|---|---|---|---|
Independent | Richard Kemp | 3,216 | 68.7 | ||
Conservative | David Burch | 1,462 | 31.3 | ||
Majority | 1,754 | 37.4 | |||
Turnout | 4,678 | 63.0 | |||
Party | Candidate | Votes | % | ± | |
---|---|---|---|---|---|
Conservative | Paul Pendleton | 1,565 | 54.0 | ||
Labour | John Taylor | 1,334 | 46.0 | ||
Majority | 231 | 8.0 | |||
Turnout | 2,899 | 55.2 | |||
Party | Candidate | Votes | % | ± | |
---|---|---|---|---|---|
Conservative | William Sadler | 1,541 | 53.2 | ||
Labour | Paul Dwane | 1,353 | 46.8 | ||
Majority | 188 | 6.4 | |||
Turnout | 2,894 | 52.7 | |||
Party | Candidate | Votes | % | ± | |
---|---|---|---|---|---|
Labour | David Thomas | 1,915 | 61.3 | ||
Conservative | Stuart Foulger | 791 | 25.3 | ||
Liberal Democrat | Stephen Went | 419 | 13.4 | ||
Majority | 1,124 | 36.0 | |||
Turnout | 3,125 | 52.0 | |||
Party | Candidate | Votes | % | ± | |
---|---|---|---|---|---|
Labour | Julian Swainson | 1,809 | 42.1 | ||
Conservative | Michael Barnard | 1,786 | 41.5 | ||
Liberal Democrat | Andrew Thomas | 706 | 16.4 | ||
Majority | 23 | 0.6 | |||
Turnout | 4,301 | 59.3 | |||
Party | Candidate | Votes | % | ± | |
---|---|---|---|---|---|
Labour | Roger Bellham | 1,981 | 44.9 | ||
Liberal Democrat | Andrew Shepherd | 1,233 | 28.0 | ||
Conservative | Valerie Pulford | 1,196 | 27.1 | ||
Majority | 748 | 16.9 | |||
Turnout | 4,410 | 61.5 | |||
Party | Candidate | Votes | % | ± | |
---|---|---|---|---|---|
Liberal Democrat | David Wood | 2,316 | 60.4 | ||
Conservative | Jane Burch | 1,078 | 28.1 | ||
Green | Andrew Sterling | 438 | 11.4 | ||
Majority | 1,238 | 32.3 | |||
Turnout | 3,832 | 69.0 | |||
Party | Candidate | Votes | % | ± | |
---|---|---|---|---|---|
Conservative | Ronald Ward | 1,884 | 51.8 | ||
Liberal Democrat | Winifred Moss | 1,751 | 48.2 | ||
Majority | 133 | 3.6 | |||
Turnout | 3,635 | 66.0 | |||
Party | Candidate | Votes | % | ± | |
---|---|---|---|---|---|
Conservative | Jane Midwood | 2,769 | 64.2 | ||
Labour | Georgina Keatley | 1,543 | 35.8 | ||
Majority | 1,226 | 28.4 | |||
Turnout | 4,312 | 70.2 | |||
Party | Candidate | Votes | % | ± | |
---|---|---|---|---|---|
Labour | David Lockwood | 2,020 | 72.0 | ||
Conservative | Francis Warby | 565 | 20.1 | ||
UKIP | Ian Smith | 222 | 7.9 | ||
Majority | 1,455 | 51.9 | |||
Turnout | 2,807 | 46.7 | |||
Party | Candidate | Votes | % | ± | |
---|---|---|---|---|---|
Labour | Bryony Rudkin | 1,576 | 54.5 | ||
Conservative | Elizabeth Harsant | 830 | 28.7 | ||
Liberal Democrat | Catherine French | 488 | 16.9 | ||
Majority | 746 | 25.8 | |||
Turnout | 2,894 | 54.1 | |||
Party | Candidate | Votes | % | ± | |
---|---|---|---|---|---|
Labour | Ray Nowak | 1,756 | 49.2 | ||
Conservative | Andrew Knibbs | 1,243 | 34.8 | ||
Local Party Bury St Edmunds | David Nettleton | 573 | 16.0 | ||
Majority | 513 | 14.4 | |||
Turnout | 3,572 | 66.8 | |||
Party | Candidate | Votes | % | ± | |
---|---|---|---|---|---|
Conservative | Ellen Crane | 2,150 | 69.6 | ||
Labour | Pamela Brown | 938 | 30.4 | ||
Majority | 1,212 | 39.2 | |||
Turnout | 3,088 | 56.5 | |||
Party | Candidate | Votes | % | ± | |
---|---|---|---|---|---|
Labour | John Le Grys | 1,750 | 47.2 | ||
Conservative | Stephen Ion | 1,272 | 34.3 | ||
Liberal Democrat | Richard Atkins | 688 | 18.5 | ||
Majority | 478 | 12.9 | |||
Turnout | 3,710 | 62.1 | |||
Party | Candidate | Votes | % | ± | |
---|---|---|---|---|---|
Liberal Democrat | Mary Lavender | 1,639 | 37.7 | ||
Conservative | William Yorke-Edwards | 1,624 | 37.3 | ||
Labour | Carol Brinded | 1,090 | 25.0 | ||
Majority | 15 | 0.4 | |||
Turnout | 4,353 | 71.7 | |||
Party | Candidate | Votes | % | ± | |
---|---|---|---|---|---|
Conservative | Stefan Oliver | 1,859 | 34.6 | ||
Labour | Robert Corfe | 1,821 | 33.9 | ||
Liberal Democrat | Grant Elliot | 1,692 | 31.5 | ||
Majority | 38 | 0.7 | |||
Turnout | 5,372 | 68.8 | |||
Party | Candidate | Votes | % | ± | |
---|---|---|---|---|---|
Conservative | John Goldsmith | 1,993 | 59.7 | ||
Labour | Paul Honeker | 1,343 | 40.3 | ||
Majority | 650 | 19.4 | |||
Turnout | 3,336 | 66.6 | |||
Party | Candidate | Votes | % | ± | |
---|---|---|---|---|---|
Labour | Robin Sargent | 1,824 | 60.2 | ||
Conservative | Carole Leggett | 831 | 27.4 | ||
Liberal Democrat | James Williams | 376 | 12.4 | ||
Majority | 993 | 32.8 | |||
Turnout | 3,031 | 57.6 | |||
Party | Candidate | Votes | % | ± | |
---|---|---|---|---|---|
Labour | Adele Cook | 1,740 | 48.8 | ||
Conservative | David Hale | 1,201 | 33.7 | ||
Liberal Democrat | Robin Whitmore | 625 | 17.5 | ||
Majority | 539 | 15.1 | |||
Turnout | 3,566 | 60.8 | |||
Party | Candidate | Votes | % | ± | |
---|---|---|---|---|---|
Labour | Alexander Martin | 1,828 | 50.5 | ||
Conservative | George Cockram | 1,125 | 31.1 | ||
Liberal Democrat | Clive Witter | 669 | 18.5 | ||
Majority | 703 | 19.4 | |||
Turnout | 3,622 | 60.0 | |||
Party | Candidate | Votes | % | ± | |
---|---|---|---|---|---|
Labour | Keith Rawlingson | 1,408 | 48.9 | ||
Conservative | Michael Rogers | 942 | 32.7 | ||
Liberal Democrat | David Mullett | 530 | 18.4 | ||
Majority | 466 | 16.2 | |||
Turnout | 2,880 | 52.3 | |||
Party | Candidate | Votes | % | ± | |
---|---|---|---|---|---|
Conservative | Selwyn Pryor | 2,572 | 51.0 | ||
Liberal Democrat | Gabrielle Blackman-Sheppard | 1,269 | 25.2 | ||
Labour | Emma Bishton | 1,203 | 23.9 | ||
Majority | 1,303 | 25.8 | |||
Turnout | 5,044 | 68.2 | |||
Party | Candidate | Votes | % | ± | |
---|---|---|---|---|---|
Labour | Ronald Snell | 1,273 | 37.1 | ||
Conservative | George Paton | 1,240 | 36.1 | ||
Liberal Democrat | Julia Truelove | 922 | 26.8 | ||
Majority | 33 | 1.0 | |||
Turnout | 3,435 | 63.4 | |||
Party | Candidate | Votes | % | ± | |
---|---|---|---|---|---|
Labour | Duncan Macpherson | 1,594 | 44.4 | ||
Conservative | Keith Myers-Hewitt | 1,317 | 36.7 | ||
Liberal Democrat | Roger Rehahn | 676 | 18.8 | ||
Majority | 277 | 7.7 | |||
Turnout | 3,587 | 61.0 | |||
Party | Candidate | Votes | % | ± | |
---|---|---|---|---|---|
Labour | Nicholas Irwin | 2,111 | 38.0 | ||
Liberal Democrat | Martyn Booth | 1,552 | 28.0 | ||
Conservative | John Sayers | 1,551 | 28.0 | ||
Independent | Rex Thake | 335 | 6.0 | ||
Majority | 559 | 10.0 | |||
Turnout | 5,549 | 57.9 | |||
Party | Candidate | Votes | % | ± | |
---|---|---|---|---|---|
Conservative | Susan Sida-Lockett | 2,533 | 49.8 | ||
Labour | John Dougall | 1,493 | 29.3 | ||
Liberal Democrat | Jennifer Blackburn | 1,063 | 20.9 | ||
Majority | 1,040 | 20.5 | |||
Turnout | 5,089 | 68.7 | |||
Party | Candidate | Votes | % | ± | |
---|---|---|---|---|---|
Conservative | Christopher Storey | 1,929 | 39.5 | ||
Liberal Democrat | Carol Milward | 1,884 | 38.5 | ||
Labour | Christine Descombes | 1,075 | 22.0 | ||
Majority | 45 | 1.0 | |||
Turnout | 4,888 | 66.9 | |||
Party | Candidate | Votes | % | ± | |
---|---|---|---|---|---|
Conservative | Valerie White | 2,520 | 52.5 | ||
Labour | David Dawson | 1,316 | 27.4 | ||
Liberal Democrat | Lisa Couper | 964 | 20.1 | ||
Majority | 1,204 | 25.1 | |||
Turnout | 4,800 | 68.0 | |||
Party | Candidate | Votes | % | ± | |
---|---|---|---|---|---|
Conservative | Elizabeth Milburn | 1,713 | 60.4 | ||
Labour | Phillipa Terrington | 1,122 | 39.6 | ||
Majority | 591 | 20.8 | |||
Turnout | 2,835 | 68.2 | |||
Party | Candidate | Votes | % | ± | |
---|---|---|---|---|---|
Liberal Democrat | Helen Whitworth | 2,404 | 51.1 | ||
Conservative | Timothy Passmore | 2,300 | 48.9 | ||
Majority | 104 | 2.2 | |||
Turnout | 4,704 | 68.9 | |||
Party | Candidate | Votes | % | ± | |
---|---|---|---|---|---|
Conservative | Jeremy Clover | 2,371 | 51.6 | ||
Labour | Joan Barker | 2,226 | 48.4 | ||
Majority | 145 | 3.2 | |||
Turnout | 4,597 | 67.9 | |||
Party | Candidate | Votes | % | ± | |
---|---|---|---|---|---|
Labour | John Taylor | 1,969 | 45.5 | ||
Conservative | Christopher Punt | 1,663 | 38.5 | ||
Liberal Democrat | Nicholas Bromley | 691 | 16.0 | ||
Majority | 306 | 7.0 | |||
Turnout | 4,323 | 66.3 | |||
Party | Candidate | Votes | % | ± | |
---|---|---|---|---|---|
Labour | Terence Green | 1,779 | 68.2 | ||
Conservative | Stephen Lark | 831 | 31.8 | ||
Majority | 948 | 36.4 | |||
Turnout | 2,610 | 48.3 | |||
Party | Candidate | Votes | % | ± | |
---|---|---|---|---|---|
Labour | Malcolm Cherry | 1,770 | 55.1 | ||
Conservative | Barry Bee | 1,013 | 31.5 | ||
Liberal Democrat | Sandra Tonge | 429 | 13.4 | ||
Majority | 757 | 23.6 | |||
Turnout | 3,212 | 59.9 | |||
Party | Candidate | Votes | % | ± | |
---|---|---|---|---|---|
Labour | Anthony Lewis | 1,604 | 65.1 | ||
Conservative | Robin Vickery | 860 | 34.9 | ||
Majority | 744 | 30.2 | |||
Turnout | 2,464 | 50.3 | |||
Party | Candidate | Votes | % | ± | |
---|---|---|---|---|---|
Conservative | Colin Barrow | 2,070 | 43.7 | ||
Liberal Democrat | Ronald Else | 1,477 | 31.2 | ||
Labour | Valerie Pizzey | 1,192 | 25.2 | ||
Majority | 593 | 12.5 | |||
Turnout | 4,739 | 68.1 | |||
Party | Candidate | Votes | % | ± | |
---|---|---|---|---|---|
Liberal Democrat | Peter Monk | 2,324 | 52.6 | ||
Conservative | Ann Herring | 2,093 | 47.4 | ||
Majority | 231 | 5.2 | |||
Turnout | 4,417 | 63.3 | |||
Party | Candidate | Votes | % | ± | |
---|---|---|---|---|---|
Conservative | Nigel Barratt | 1,653 | 39.5 | ||
Liberal Democrat | Sally Bull | 1,189 | 28.4 | ||
Labour | Roy Burgon | 1,133 | 27.0 | ||
Independent | Benjamin Redsell | 215 | 5.1 | ||
Majority | 464 | 11.1 | |||
Turnout | 4,190 | 68.1 | |||
Central Suffolk and North Ipswich is a constituency represented in the House of Commons of the UK Parliament since 2010 by Dan Poulter of the Conservative Party.
Elections for local government were held in the England and Northern Ireland on 5 May 2005 along with the 2005 general election across the entire United Kingdom. In addition, the Isle of Wight held a local referendum on the issue of a directly elected mayor.
Mid Suffolk District Council in Suffolk, England is elected every four years. Since the last boundary changes in 2003, 40 councillors have been elected from 30 wards.
Forest Heath District Council in Suffolk, England is elected every four years. Since the last boundary changes in 2003, 27 councillors have been elected from 14 wards.
Babergh District Council in Suffolk, England is elected every four years. Since the last boundary changes in 2003, 43 councillors have been elected from 26 wards.
For other Suffolk County location elections see, Suffolk County (disambiguation)
St Edmundsbury Borough Council in Suffolk, England is elected every four years. Since the last boundary changes in 2003, 45 councillors have been elected from 31 wards.
Elections to Suffolk County Council were held on 5 May 2005. The whole council was up for election with boundary changes since the last election in 2001 reducing the number of seats by 5. The Conservative party gained control of the council from no overall control.
Suffolk Coastal District Council in Suffolk, England is elected every four years. Since the last boundary changes in 2003, 55 councillors have been elected from 34 wards.
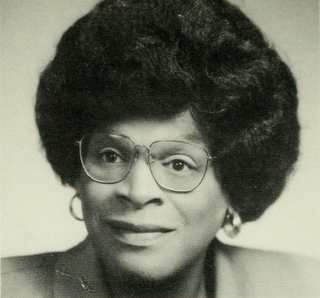
Althea Garrison is an independent American politician from Boston, Massachusetts and Boston City Councilor At Large. She was elected as a Republican to the Massachusetts House of Representatives in 1992 and served one term from 1993 to 1995. Both before and after Garrison's successful bid for office, she has run unsuccessfully in multiple elections for the state legislature and Boston City Council, as a Republican, Democrat, or independent, which has resulted in her being described in the media as a "perennial candidate". Garrison is also known as the first transgender person to be elected to a state legislature in the United States.
The 1998 Waveney Council election took place on 7 May 1998 to elect members of Waveney District Council in Suffolk, England. One third of the council was up for election and the Labour party stayed in overall control of the council.
The 1999 Waveney Council election took place on 6 May 1999 to elect members of Waveney District Council in Suffolk, England. One third of the council was up for election and the Labour party stayed in overall control of the council.
In the 2011 United Kingdom local elections, the Conservative Party held onto the Council for a third term and even increased their majority. The Liberal Democrats lost four seats but remained in second place while the Green Party and the Labour Party each gained a seat, which is Labour's only seat on the Council.
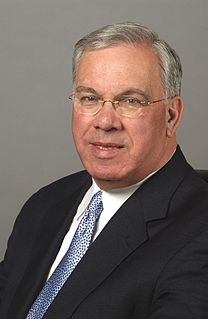
The Boston mayoral election of 2001 occurred on Tuesday, November 6, 2001, between incumbent mayor Thomas Menino and City Councilor Peggy Davis-Mullen. Menino was re-elected to a third term.
The candidate information for the Helmingham and Coddenham Ward in Mid-Suffolk, Suffolk, England.
The candidate information for the Bacton and Old Newton Ward in Mid-Suffolk, Suffolk, England.
The candidate information for the Badwell Ash Ward in Mid-Suffolk, Suffolk, England.
The candidate information for the Bramford and Blakenham Ward in Mid-Suffolk, Suffolk, England. This pages shows the results of the latest election on Thursday 5 May 2011. This ward elects two councillors.
The 2015 Mid Suffolk District Council election took place on the 7 May 2015 to elect members of Mid Suffolk District Council in England. It was held on same day as many UK local elections and the general election.