Rendering or image synthesis is the automatic process of generating a photorealistic or non-photorealistic image from a 2D or 3D model by means of computer programs. Also, the results of displaying such a model can be called a render. A scene file contains objects in a strictly defined language or data structure; it would contain geometry, viewpoint, texture, lighting, and shading information as a description of the virtual scene. The data contained in the scene file is then passed to a rendering program to be processed and output to a digital image or raster graphics image file. The term "rendering" may be by analogy with an "artist's rendering" of a scene.

A voxel represents a value on a regular grid in three-dimensional space. As with pixels in a 2D bitmap, voxels themselves do not typically have their position (coordinates) explicitly encoded with their values. Instead, rendering systems can infer the position of a voxel based upon its position relative to other voxels. In contrast to pixels and voxels, polygons are often explicitly represented by the coordinates of their vertices (points). A direct consequence of this difference is that polygons can efficiently represent simple 3D structures with lots of empty or homogeneously filled space, while voxels excel at representing regularly sampled spaces that are non-homogeneously filled.

Tomography is imaging by sections or sectioning, through the use of any kind of penetrating wave. The method is used in radiology, archaeology, biology, atmospheric science, geophysics, oceanography, plasma physics, materials science, astrophysics, quantum information, and other areas of science. The word tomography is derived from Ancient Greek τόμος tomos, "slice, section" and γράφω graphō, "to write" or, in this context as well, " to describe." A device used in tomography is called a tomograph, while the image produced is a tomogram.

Scientific visualization is an interdisciplinary branch of science concerned with the visualization of scientific phenomena. It is also considered a subset of computer graphics, a branch of computer science. The purpose of scientific visualization is to graphically illustrate scientific data to enable scientists to understand, illustrate, and glean insight from their data.

Visualization or visualisation is any technique for creating images, diagrams, or animations to communicate a message. Visualization through visual imagery has been an effective way to communicate both abstract and concrete ideas since the dawn of humanity. Examples from history include cave paintings, Egyptian hieroglyphs, Greek geometry, and Leonardo da Vinci's revolutionary methods of technical drawing for engineering and scientific purposes.

In scientific visualization and computer graphics, volume rendering is a set of techniques used to display a 2D projection of a 3D discretely sampled data set, typically a 3D scalar field.
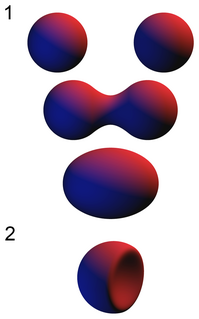
In computer graphics, metaballs are organic-looking n-dimensional isosurfaces, characterised by their ability to meld together when in close proximity to create single, contiguous objects. This "blobby" appearance makes them versatile tools, often used to model organic objects and also to create base meshes for sculpting. The technique for rendering metaballs was invented by Jim Blinn in the early 1980s to model atom interactions for Carl Sagan's 1980 TV series Cosmos.

An isosurface is a three-dimensional analog of an isoline. It is a surface that represents points of a constant value within a volume of space; in other words, it is a level set of a continuous function whose domain is 3D-space.
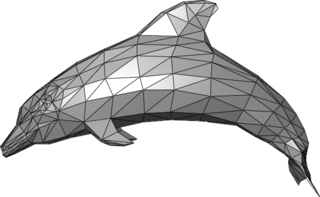
A polygon mesh is a collection of vertices, edges and faces that defines the shape of a polyhedral object in 3D computer graphics and solid modeling. The faces usually consist of triangles, quadrilaterals (quads), or other simple convex polygons (n-gons), since this simplifies rendering, but may also be more generally composed of concave polygons, or even polygons with holes.

Marching cubes is a computer graphics algorithm, published in the 1987 SIGGRAPH proceedings by Lorensen and Cline, for extracting a polygonal mesh of an isosurface from a three-dimensional discrete scalar field. The applications of this algorithm are mainly concerned with medical visualizations such as CT and MRI scan data images, and special effects or 3-D modelling with what is usually called metaballs or other metasurfaces. An analogous two-dimensional method is called the marching squares algorithm.
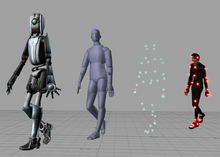
3D rendering is the 3D computer graphics process of converting 3D models into 2D images on a computer. 3D renders may include photorealistic effects or non-photorealistic styles.
Molecular graphics (MG) is the discipline and philosophy of studying molecules and their properties through graphical representation. IUPAC limits the definition to representations on a "graphical display device". Ever since Dalton's atoms and Kekulé's benzene, there has been a rich history of hand-drawn atoms and molecules, and these representations have had an important influence on modern molecular graphics. This article concentrates on the use of computers to create molecular graphics. Note, however, that many molecular graphics programs and systems have close coupling between the graphics and editing commands or calculations such as in molecular modelling.
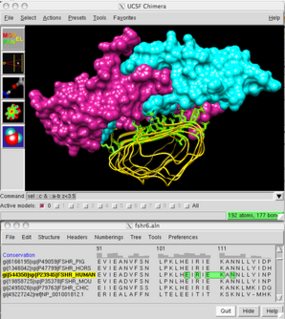
UCSF Chimera is an extensible program for interactive visualization and analysis of molecular structures and related data, including density maps, supramolecular assemblies, sequence alignments, docking results, trajectories, and conformational ensembles. High-quality images and movies can be created. Chimera includes complete documentation and can be downloaded free of charge for noncommercial use.
3D computer graphics, or three-dimensional computer graphics, are graphics that use a three-dimensional representation of geometric data that is stored in the computer for the purposes of performing calculations and rendering 2D images. The resulting images may be stored for viewing later or displayed in real time.

Molekel is a free software multiplatform molecular visualization program. It was originally developed at the University of Geneva by Peter F. Flükiger in the 1990s for Silicon Graphics Computers. In 1998, Stefan Portmann took over responsibility and released Version 3.0. Version 4.0 was a nearly platform independent version. Further developments lead to version 4.3, before Stefan Portmann moved on and ceased to develop the codes. In 2006, the Swiss National Supercomputing Centre (CSCS) restarted the project and version 5.0 was released on 21 December 2006.

Computer graphics is the discipline of generating images with the aid of computers. Today, computer graphics is a core technology in digital photography, film, video games, cell phone and computer displays, and many specialized applications. A great deal of specialized hardware and software has been developed, with the displays of most devices being driven by computer graphics hardware. It is a vast and recently developed area of computer science. The phrase was coined in 1960 by computer graphics researchers Verne Hudson and William Fetter of Boeing. It is often abbreviated as CG, or typically in the context of film as CGI.

Voreen is an open-source volume visualization library and development platform. Through the use of GPU-based volume rendering techniques it allows high frame rates on standard graphics hardware to support interactive volume exploration.
This is a glossary of terms relating to computer graphics.

The Visualization Handbook is a textbook by Charles D. Hansen and Christopher R. Johnson that serves as a survey of the field of scientific visualization by presenting the basic concepts and algorithms in addition to a current review of visualization research topics and tools. It is commonly used as a textbook for scientific visualization graduate courses. It is also commonly cited as a reference for scientific visualization and computer graphics in published papers, with almost 500 citations documented on Google Scholar.

Hanspeter Pfister is a Swiss computer scientist. He is the An Wang Professor of Computer Science at the Harvard John A. Paulson School of Engineering and Applied Sciences and an affiliate faculty member of the Center for Brain Science at Harvard University. His research in visual computing lies at the intersection of scientific visualization, information visualization, computer graphics, and computer vision and spans a wide range of topics, including biomedical image analysis and visualization, image and video analysis, and visual analytics in data science.