The Beer-Lambert law is commonly applied to chemical analysis measurements to determine the concentration of chemical species that absorb light. It is often referred to as Beer's law. In physics, the Bouguer–Lambert law is an empirical law which relates the extinction or attenuation of light to the properties of the material through which the light is travelling. It had its first use in astronomical extinction. The fundamental law of extinction is sometimes called the Beer-Bouguer-Lambert law or the Bouguer-Beer-Lambert law or merely the extinction law. The extinction law is also used in understanding attenuation in physical optics, for photons, neutrons, or rarefied gases. In mathematical physics, this law arises as a solution of the BGK equation.
Circular dichroism (CD) is dichroism involving circularly polarized light, i.e., the differential absorption of left- and right-handed light. Left-hand circular (LHC) and right-hand circular (RHC) polarized light represent two possible spin angular momentum states for a photon, and so circular dichroism is also referred to as dichroism for spin angular momentum. This phenomenon was discovered by Jean-Baptiste Biot, Augustin Fresnel, and Aimé Cotton in the first half of the 19th century. Circular dichroism and circular birefringence are manifestations of optical activity. It is exhibited in the absorption bands of optically active chiral molecules. CD spectroscopy has a wide range of applications in many different fields. Most notably, UV CD is used to investigate the secondary structure of proteins. UV/Vis CD is used to investigate charge-transfer transitions. Near-infrared CD is used to investigate geometric and electronic structure by probing metal d→d transitions. Vibrational circular dichroism, which uses light from the infrared energy region, is used for structural studies of small organic molecules, and most recently proteins and DNA.
Force spectroscopy is a set of techniques for the study of the interactions and the binding forces between individual molecules. These methods can be used to measure the mechanical properties of single polymer molecules or proteins, or individual chemical bonds. The name "force spectroscopy", although widely used in the scientific community, is somewhat misleading, because there is no true matter-radiation interaction.

Optical tweezers are scientific instruments that use a highly focused laser beam to hold and move microscopic and sub-microscopic objects like atoms, nanoparticles and droplets, in a manner similar to tweezers. If the object is held in air or vacuum without additional support, it can be called optical levitation.
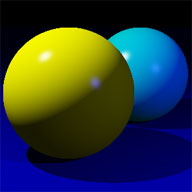
A specular highlight is the bright spot of light that appears on shiny objects when illuminated. Specular highlights are important in 3D computer graphics, as they provide a strong visual cue for the shape of an object and its location with respect to light sources in the scene.
In polymer chemistry, free-radical polymerization (FRP) is a method of polymerization by which a polymer forms by the successive addition of free-radical building blocks. Free radicals can be formed by a number of different mechanisms, usually involving separate initiator molecules. Following its generation, the initiating free radical adds (nonradical) monomer units, thereby growing the polymer chain.
In polymer chemistry, an ideal chain is the simplest model to describe polymers, such as nucleic acids and proteins. It assumes that the monomers in a polymer are located at the steps of a hypothetical random walker that does not remember its previous steps. By neglecting interactions among monomers, this model assumes that two monomers can occupy the same location. Although it is simple, its generality gives insight about the physics of polymers.
Fluorescence correlation spectroscopy (FCS) is a statistical analysis, via time correlation, of stationary fluctuations of the fluorescence intensity. Its theoretical underpinning originated from L. Onsager's regression hypothesis. The analysis provides kinetic parameters of the physical processes underlying the fluctuations. One of the interesting applications of this is an analysis of the concentration fluctuations of fluorescent particles (molecules) in solution. In this application, the fluorescence emitted from a very tiny space in solution containing a small number of fluorescent particles (molecules) is observed. The fluorescence intensity is fluctuating due to Brownian motion of the particles. In other words, the number of the particles in the sub-space defined by the optical system is randomly changing around the average number. The analysis gives the average number of fluorescent particles and average diffusion time, when the particle is passing through the space. Eventually, both the concentration and size of the particle (molecule) are determined. Both parameters are important in biochemical research, biophysics, and chemistry.
The worm-like chain (WLC) model in polymer physics is used to describe the behavior of polymers that are semi-flexible: fairly stiff with successive segments pointing in roughly the same direction, and with persistence length within a few orders of magnitude of the polymer length. The WLC model is the continuous version of the Kratky–Porod model.
In condensed matter physics and crystallography, the static structure factor is a mathematical description of how a material scatters incident radiation. The structure factor is a critical tool in the interpretation of scattering patterns obtained in X-ray, electron and neutron diffraction experiments.

Dynamic light scattering (DLS) is a technique in physics that can be used to determine the size distribution profile of small particles in suspension or polymers in solution. In the scope of DLS, temporal fluctuations are usually analyzed using the intensity or photon auto-correlation function. In the time domain analysis, the autocorrelation function (ACF) usually decays starting from zero delay time, and faster dynamics due to smaller particles lead to faster decorrelation of scattered intensity trace. It has been shown that the intensity ACF is the Fourier transform of the power spectrum, and therefore the DLS measurements can be equally well performed in the spectral domain. DLS can also be used to probe the behavior of complex fluids such as concentrated polymer solutions.
Rubber elasticity refers to a property of crosslinked rubber: it can be stretched by up to a factor of 10 from its original length and, when released, returns very nearly to its original length. This can be repeated many times with no apparent degradation to the rubber. Rubber is a member of a larger class of materials called elastomers and it is difficult to overestimate their economic and technological importance. Elastomers have played a key role in the development of new technologies in the 20th century and make a substantial contribution to the global economy. Rubber elasticity is produced by several complex molecular processes and its explanation requires a knowledge of advanced mathematics, chemistry and statistical physics, particularly the concept of entropy. Entropy may be thought of as a measure of the thermal energy that is stored in a molecule. Common rubbers, such as polybutadiene and polyisoprene, are produced by a process called polymerization. Very long molecules (polymers) are built up sequentially by adding short molecular backbone units through chemical reactions. A rubber polymer follows a random, zigzag path in three dimensions, intermingling with many other rubber molecules. An elastomer is created by the addition of a few percent of a cross linking molecule such as sulfur. When heated, the crosslinking molecule causes a reaction that chemically joins (bonds) two of the rubber molecules together at some point. Because the rubber molecules are so long, each one participates in many crosslinks with many other rubber molecules forming a continuous molecular network. As a rubber band is stretched, some of the network chains are forced to become straight and this causes a decrease in their entropy. It is this decrease in entropy that gives rise to the elastic force in the network chains.
Fluorescence interference contrast (FLIC) microscopy is a microscopic technique developed to achieve z-resolution on the nanometer scale.
Magnetic tweezers (MT) are scientific instruments for the manipulation and characterization of biomolecules or polymers. These apparatus exert forces and torques to individual molecules or groups of molecules. It can be used to measure the tensile strength or the force generated by molecules.

The Gaussian network model (GNM) is a representation of a biological macromolecule as an elastic mass-and-spring network to study, understand, and characterize the mechanical aspects of its long-time large-scale dynamics. The model has a wide range of applications from small proteins such as enzymes composed of a single domain, to large macromolecular assemblies such as a ribosome or a viral capsid. Protein domain dynamics plays key roles in a multitude of molecular recognition and cell signalling processes. Protein domains, connected by intrinsically disordered flexible linker domains, induce long-range allostery via protein domain dynamics. The resultant dynamic modes cannot be generally predicted from static structures of either the entire protein or individual domains.
Digital image correlation and tracking is an optical method that employs tracking and image registration techniques for accurate 2D and 3D measurements of changes in images. This method is often used to measure full-field displacement and strains, and it is widely applied in many areas of science and engineering. Compared to strain gauges and extensometers, digital image correlation methods provide finer details about deformation, due to the ability to provide both local and average data.
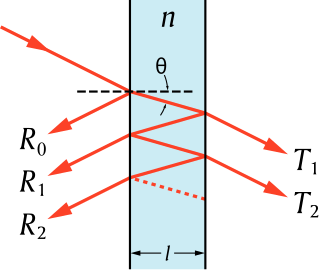
The transfer-matrix method is a method used in optics and acoustics to analyze the propagation of electromagnetic or acoustic waves through a stratified medium; a stack of thin films. This is, for example, relevant for the design of anti-reflective coatings and dielectric mirrors.

A polymer is a macromolecule, composed of many similar or identical repeated subunits. Polymers are common in, but not limited to, organic media. They range from familiar synthetic plastics to natural biopolymers such as DNA and proteins. Their unique elongated molecular structure produces unique physical properties, including toughness, viscoelasticity, and a tendency to form glasses and semicrystalline structures. The modern concept of polymers as covalently bonded macromolecular structures was proposed in 1920 by Hermann Staudinger. One sub-field in the study of polymers is polymer physics. As a part of soft matter studies, Polymer physics concerns itself with the study of mechanical properties and focuses on the perspective of condensed matter physics.
Polymer scattering experiments are one of the main scientific methods used in chemistry, physics and other sciences to study the characteristics of polymeric systems: solutions, gels, compounds and more. As in most scattering experiments, it involves subjecting a polymeric sample to incident particles, and studying the characteristics of the scattered particles: angular distribution, intensity polarization and so on. This method is quite simple and straightforward, and does not require special manipulations of the samples which may alter their properties, and hence compromise exact results.
Super-resolution photoacoustic imaging is a set of techniques used to enhance spatial resolution in photoacoustic imaging. Specifically, these techniques primarily break the optical diffraction limit of the photoacoustic imaging system. It can be achieved in a variety of mechanisms, such as blind structured illumination, multi-speckle illumination, or photo-imprint photoacoustic microscopy in Figure 1.


