| |||||||||||||||||||||
85 legislative chambers in 44 states | |||||||||||||||||||||
---|---|---|---|---|---|---|---|---|---|---|---|---|---|---|---|---|---|---|---|---|---|
| |||||||||||||||||||||
Map of upper house elections: Democrats gained control Democrats retained control Republicans gained control Republicans retained control Coalition retained control Non-partisan legislature No regularly-scheduled elections | |||||||||||||||||||||
Map of lower house elections: Democrats gained control Democrats retained control Republicans gained control Republicans retained control Non-partisan legislature No regularly-scheduled elections |
Elections to state legislatures were held on November 4, 2008, alongside other elections, in which Democrats scored significant gains in a blue wave election. Elections were held for 85 legislative chambers, with all states but Louisiana, Mississippi, New Jersey, Alabama, Maryland, and Virginia holding elections in at least one house. Michigan and Minnesota held elections for their lower, but not upper houses. [1] Seven territorial chambers in four territories and the District of Columbia were up.
The New Hampshire Senate saw the election of the first-ever female majority. This is the first time this has occurred in any chamber of any state legislature in United States history. [2] In New York, the Democrats obtained a trifecta for the first time since 1935, and in Delaware for the first time since 1977. [3]
The Democrats took control of six legislative bodies to the Republicans' four. Democrats took control of the Delaware House of Representatives, for the first time since 1985, the Montana House of Representatives, the Nevada Senate, and the New York State Senate, for the first time since 1966, the Ohio House of Representatives, and the Wisconsin State Assembly. Republicans took control of the Montana Senate; both houses of the Tennessee General Assembly, [4] for the first time since 1870; and the Oklahoma Senate, for the first time in state history. With the Montana Senate and the Montana House of Representatives flipping, this election cycle marked the last time in U.S. history as of 2023 where the upper house and lower house held by different political parties in a state legislature both flipped in the same cycle.
Regularly-scheduled elections were held in 85 of the 99 state legislative chambers in the United States. Nationwide, regularly-scheduled elections were held for 5,948 of the 7,383 legislative seats. Many legislative chambers held elections for all seats, but some legislative chambers that use staggered elections held elections for only a portion of the total seats in the chamber. [5] The chambers not up for election either hold regularly-scheduled elections in odd-numbered years, or have four-year terms and hold all regularly-scheduled elections in presidential midterm election years.
Note that this table only covers regularly-scheduled elections; additional special elections took place concurrently with these regularly-scheduled elections.
State | Upper House [5] | Lower House [5] | ||||||
---|---|---|---|---|---|---|---|---|
Seats up | Total | % up | Term | Seats up | Total | % up | Term | |
Alaska | 19 | 20 | 95 | 4 | 40 | 40 | 100 | 2 |
Arizona | 30 | 30 | 100 | 2 | 60 | 60 | 100 | 2 |
Arkansas | 35 | 35 | 100 | 2/4 [lower-alpha 3] | 100 | 100 | 100 | 2 |
California | 20 | 40 | 50 | 4 | 80 | 80 | 100 | 2 |
Colorado | 18 | 35 | 51 | 4 | 65 | 65 | 100 | 2 |
Connecticut | 36 | 36 | 100 | 2 | 151 | 151 | 100 | 2 |
Delaware | 21 | 21 | 100 | 2/4 [lower-alpha 3] | 41 | 41 | 100 | 2 |
Florida | 40 | 40 | 100 | 2/4 [lower-alpha 3] | 120 | 120 | 100 | 2 |
Georgia | 56 | 56 | 100 | 2 | 180 | 180 | 100 | 2 |
Hawaii | 25 | 25 | 100 | 2/4 [lower-alpha 3] | 51 | 51 | 100 | 2 |
Idaho | 35 | 35 | 100 | 2 | 70 | 70 | 100 | 2 |
Illinois | 59 | 59 | 100 | 2/4 [lower-alpha 3] | 118 | 118 | 100 | 2 |
Indiana | 25 | 50 | 50 | 4 | 100 | 100 | 100 | 2 |
Iowa | 25 | 50 | 50 | 4 | 100 | 100 | 100 | 2 |
Kansas | 40 | 40 | 100 | 4 | 125 | 125 | 100 | 2 |
Kentucky | 19 | 38 | 50 | 4 | 100 | 100 | 100 | 2 |
Louisiana | 0 | 39 | 0 | 4 | 0 | 105 | 0 | 4 |
Maine | 35 | 35 | 100 | 2 | 151 | 151 | 100 | 2 |
Maryland | 0 | 47 | 0 | 4 | 0 | 141 | 0 | 4 |
Massachusetts | 40 | 40 | 100 | 2 | 160 | 160 | 100 | 2 |
Michigan | 0 | 38 | 0 | 4 | 110 | 110 | 100 | 2 |
Minnesota | 0 | 0 | 100 | 2/4 [lower-alpha 3] | 134 | 134 | 100 | 2 |
Mississippi | 0 | 52 | 0 | 4 | 0 | 122 | 0 | 4 |
Missouri | 17 | 34 | 50 | 4 | 163 | 163 | 100 | 2 |
Montana | 25 | 50 | 50 | 4 | 100 | 100 | 100 | 2 |
Nebraska | 25 [lower-alpha 4] | 49 [lower-alpha 4] | 51 [lower-alpha 4] | 4 | N/A (unicameral) | |||
Nevada | 10 | 21 | 48 | 4 | 42 | 42 | 100 | 2 |
New Hampshire | 24 | 24 | 100 | 2 | 400 | 400 | 100 | 2 |
New Jersey | 0 | 40 | 0 | 2/4 [lower-alpha 3] | 0 | 80 | 0 | 2 |
New Mexico | 42 | 42 | 100 | 4 | 70 | 70 | 100 | 2 |
New York | 63 | 63 | 100 | 2 | 150 | 150 | 100 | 2 |
North Carolina | 50 | 50 | 100 | 2 | 120 | 120 | 100 | 2 |
North Dakota | 23 | 47 | 49 | 4 | 47 | 94 | 50 | 4 |
Ohio | 16 | 33 | 48 | 4 | 99 | 99 | 100 | 2 |
Oklahoma | 24 | 48 | 50 | 4 | 101 | 101 | 100 | 2 |
Oregon | 15 | 30 | 50 | 4 | 60 | 60 | 100 | 2 |
Pennsylvania | 25 | 50 | 50 | 4 | 203 | 203 | 100 | 2 |
Rhode Island | 38 | 38 | 100 | 2 | 75 | 75 | 100 | 2 |
South Carolina | 46 | 46 | 100 | 4 | 124 | 124 | 100 | 2 |
South Dakota | 35 | 35 | 100 | 2 | 70 | 70 | 100 | 2 |
Tennessee | 16 | 33 | 48 | 4 | 99 | 99 | 100 | 2 |
Texas | 16 | 31 | 52 | 2/4 [lower-alpha 3] | 150 | 150 | 100 | 2 |
Utah | 15 | 29 | 52 | 4 | 75 | 75 | 100 | 2 |
Vermont | 30 | 30 | 100 | 2 | 150 | 150 | 100 | 2 |
Virginia | 0 | 40 | 0 | 4 | 0 | 100 | 0 | 2 |
Washington | 25 | 49 | 51 | 4 | 98 | 98 | 100 | 2 |
West Virginia | 17 | 34 | 50 | 4 | 100 | 100 | 100 | 2 |
Wisconsin | 16 | 33 | 48 | 4 | 99 | 99 | 100 | 2 |
Wyoming | 15 | 30 | 50 | 4 | 60 | 60 | 100 | 2 |
Total | 1281 | 1972 | 65 | N/A | 4595 | 5411 | 85 | N/A |
State | Previous UH | Result | Party control |
---|---|---|---|
Alaska | Coal. 15-5 | Coal. 16-4 | Coalition Hold |
Arizona | R 17-13 | R 18-12 | Republican hold |
Arkansas | D 27-8 | D 27-8 | Democratic hold |
California | D 25-15 | D 25-15 | Democratic hold |
Colorado | D 20-15 | D 21-14 | Democratic hold |
Connecticut | D 23-13 | D 24-12 | Democratic hold |
Delaware | D 13-8 | D 16-5 | Democratic hold |
Florida | R 26-14 | R 26-14 | Republican hold |
Georgia | R 34-22 | R 34-22 | Republican hold |
Hawaii | D 20-5 | D 23-2 | Democratic hold |
Idaho | R 28-7 | R 28-7 | Republican hold |
Illinois | D 37-22 | D 37-22 | Democratic hold |
Indiana | R 33-17 | R 33-17 | Republican hold |
Iowa | D 30-20 | D 32-18 | Democratic hold |
Kansas | R 30-10 | R 31-9 | Republican hold |
Kentucky | R 22-15-1 | R 21-16-1 | Republican hold |
Maine | D 28-17 | D 20–15 | Democratic Hold |
Massachusetts | D 35-5 | D 35-5 | Democratic hold |
Missouri | R 21-13 | R 23-11 | Republican hold |
Montana | D 26-24 | R 27-23 | Republican Takeover |
Nebraska | Unicameral and non–partisan Senate with 49 members | ||
Nevada | R 11-10 | D 12-9 | Democratic Takeover |
New Hampshire | D 14-10 | D 14-10 | Democratic Hold |
New Mexico | D 24-18 | D 27-15 | Democratic hold |
New York | R 32-30 | D 32-30 | Democratic takeover |
North Carolina | D 31-19 | D 30-20 | Democratic Hold |
North Dakota | R 26-21 | R 26-21 | Republican hold |
Ohio | R 21-12 | R 21-12 | Republican hold |
Oklahoma | D 24-24 [lower-alpha 5] | R 26-22 | Republican Takeover |
Oregon | D 19-11 | D 18-12 | Democratic hold |
Pennsylvania | R 29-21 | R 30-20 | Republican hold |
Rhode Island | D 33–5. | D 33-4-1 | Democratic hold |
South Carolina | R 27-19 | R 27-19 | Republican hold |
South Dakota | R 20-15 | R 21-14 | Republican hold |
Tennessee | 16-16-1 [lower-alpha 1] | R 19-14 | Republican Takeover |
Texas | R 20-11 | R 19-12 | Republican hold |
Utah | R 21-8 | R 21-8 | Republican hold |
Vermont | D 23-7 | D 23-7 | Democratic hold |
Washington | D 31-18 | D 31-18 | Democratic hold |
West Virginia | D 23-11 | D 26-8 | Democratic hold |
Wisconsin | D 18-15 | D 18-15 | Democratic Hold |
Wyoming | R 23-7 | R 23-7 | Republican hold |
State | Previous LH | Result | Party control |
---|---|---|---|
Alaska | R 23-17 | R 22-18 | Republican hold |
Arizona | R 33-27 | R 36-24 | Republican hold |
Arkansas | D 72-28 | D 71-27-1 | Democratic hold |
California | D 48-32 | D 50-29-1 | Democratic hold |
Colorado | D 39-26 | D 38-27 | Democratic Hold |
Connecticut | D 107-44 | D 114-37 | Democratic hold |
Delaware | R 23-18 | D 24-17 | Democratic Takeover |
Florida | R 77-43 | R 76-44 | Republican hold |
Georgia | R 106-74 | R 105-74-1 | Republican hold |
Hawaii | D 43-8 | D 45-6 | Democratic hold |
Idaho | R 51-19 | R 52-18 | Republican hold |
Illinois | D 67-51 | D 70-48 | Democratic hold |
Indiana | D 51-49 | D 52-48 | Democratic Hold |
Iowa | D 54-46 | D 57-43 | Democratic Hold |
Kansas | R 78-47 | R 77-48 | Republican hold |
Kentucky | D 63-37 | D 65-35 | Democratic hold |
Maine | D 90-59-2 | D 95-55-1 | Democratic Hold |
Massachusetts | D 144-15-1 | D 144-15-1 | Democratic hold |
Michigan | D 58-52 | D 67-43 | Democratic Hold |
Minnesota | D 85-48-1 | D 87-47 | Democratic Hold |
Missouri | R 97-66 | R 92-71 | Republican hold |
Montana | R 50-49-1 | 50-50 [lower-alpha 6] | Democratic takeover |
Nebraska | Unicameral and non–partisan Senate with 49 members | ||
Nevada | D 27-15 | D 28-14 | Democratic hold |
New Hampshire | D 239-160-1 | D 225-175 | Democratic Hold |
New Mexico | D 42-28 | D 45-25 | Democratic hold |
New York | D 106-42-1-1 | D 107-41-1-1 | Democratic hold |
North Carolina | D 68-52 | D 68-52 | Democratic Hold |
North Dakota | R 61-33 | R 58-36 | Republican hold |
Ohio | R 53-46 | D 53-46 | Democratic takeover |
Oklahoma | R 57-44 | R 61-40 | Republican hold |
Oregon | D 31-29 | D 36-24 | Democratic Hold |
Pennsylvania | D 102-101 | D 104-99 | Democratic Hold |
Rhode Island | D 60-15 | D 69-6 | Democratic hold |
South Carolina | R 73-51 | R 73-51 | Republican hold |
South Dakota | R 50-20 | R 46-24 | Republican hold |
Tennessee | D 53-46 | R 50-49 | Republican Takeover |
Texas | R 77-71 | R 76-74 | Republican hold |
Utah | R 55-20 | R 53-22 | Republican hold |
Vermont | D 93-49-6-2 | D 95-48-5-2 | Democratic hold |
Washington | D 63-35 | D 62-36 | Democratic hold |
West Virginia | D 72-28 | D 71-29 | Democratic hold |
Wisconsin | R 52-47 | D 52-46-1 | Democratic takeover |
Wyoming | R 43-17 | R 41-19 | Republican hold |
Territory | Previous UH | Result | Party control |
---|---|---|---|
American Samoa | Non–partisan Senate with 18 members | ||
Puerto Rico | PNP 15-11-1 | PNP 22-9 | New Progressive Hold |
Territory | Previous LH | Result | Party control |
---|---|---|---|
American Samoa | Non–partisan House of Representatives with 21 members | ||
Puerto Rico | PNP 32-18-1 | PNP 37-17 | New Progressive Hold |
Territory | Previous | Result | Party control |
---|---|---|---|
Guam | D 8-7 | D 10-5 | Democratic Hold |
US Virgin Islands | D 9-6 | D 10-5 | Democratic Hold |
Washington D.C. | D 11-1-1 | D 11-2 | Democratic Hold |
The 2008 United States elections were held on Tuesday, November 4, 2008, during the war on terror and the onset of the Great Recession. It was a considered a Democratic wave election, with Democratic Senator Barack Obama of Illinois defeating Senator John McCain of Arizona by a wide margin, and the Democrats bolstering their majorities in both chambers of Congress.
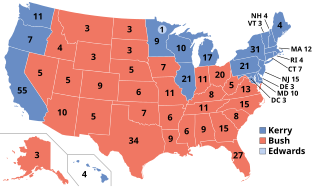
The 2004 United States elections were held on Tuesday, November 2, 2004, during the early years of the war on terror and after the 2003 invasion of Iraq. Republican President George W. Bush won re-election and Republicans retained control of Congress.
The 2010 United States elections were held on Tuesday, November 2, 2010, in the middle of Democratic President Barack Obama's first term. Republicans ended unified Democratic control of Congress and the presidency by winning a majority in the House of Representatives and gained seats in the Senate despite Democrats holding Senate control.
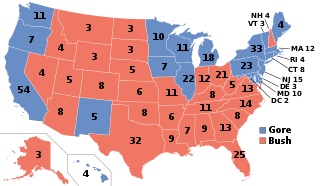
The 2000 United States elections were held on November 7, 2000. Republican Governor George W. Bush of Texas defeated Democratic Vice President Al Gore of Tennessee in the presidential election. Republicans retained control of both houses of Congress, giving the party unified control of Congress and the presidency for the first time since the 1954 elections.
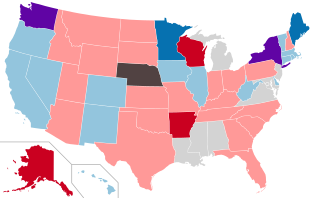
The 2010 United States state legislative elections were held on November 2, 2010, halfway through President Barack Obama's first term in office. Elections were held for 88 legislative chambers, with all states but Louisiana, Mississippi, New Jersey, and Virginia holding elections in at least one house. Kansas and New Mexico held elections for their lower, but not upper houses. Four territorial chambers in three territories and the District of Columbia were up as well.
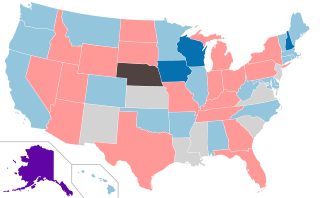
The 2020 United States state legislative elections were held on November 3, 2020, for 86 state legislative chambers in 44 states. Across the fifty states, approximately 65 percent of all upper house seats and 85 percent of all lower house seats were up for election. Nine legislative chambers in the five permanently-inhabited U.S. territories and the federal district of Washington, D.C. also held elections. The elections took place concurrently with several other federal, state, and local elections, including the presidential election, U.S. Senate elections, U.S. House elections, and gubernatorial elections.
The 2018 United States state legislative elections were held on November 6, 2018, for 87 state legislative chambers in 46 states. Across the fifty states, approximately 56 percent of all upper house seats and 92 percent of all lower house seats were up for election. Additionally, six territorial chambers in four territories and the District of Columbia were up as well.
The 2022 United States state legislative elections were held on November 8, 2022, for 88 state legislative chambers in 46 states. Across the fifty states, approximately 56 percent of all upper house seats and 92 percent of all lower house seats were up for election. Additionally, six territorial chambers were up in four territories and the District of Columbia. These midterm elections coincided with other state and local elections, including gubernatorial elections in multiple states.
Elections to state legislatures were held in 46 U.S. states in 2014 with a total of 6,049 seats up for election. Six territorial chambers were up in four territories and the District of Columbia.
The 2015 United States state legislative elections were held on November 3, 2015. Seven legislative chambers in four states held regularly-scheduled elections. These off-year elections coincided with other state and local elections, including gubernatorial elections in three states.
The 2011 United States state legislative elections were held on November 8, 2011. Eight legislative chambers in four states held regularly-scheduled elections. These off-year elections coincided with other state and local elections, including gubernatorial elections in four states.
The 2016 United States state legislative elections were held on November 8, 2016, for 86 state legislative chambers in 44 states. Across the fifty states, approximately 65 percent of all upper house seats and 85 percent of all lower house seats were up for election. Nine legislative chambers in the five permanently-inhabited U.S. territories and the federal district of Washington, D.C. also held elections. The elections took place concurrently with several other federal, state, and local elections, including the presidential election, U.S. Senate elections, U.S. House elections, and gubernatorial elections.
The 2012 United States state legislative elections were held on November 6, 2012, for 86 state legislative chambers in 44 states. Across the fifty states, approximately 65 percent of all upper house seats and 85 percent of all lower house seats were up for election. Nine legislative chambers in the five permanently-inhabited U.S. territories and the federal district of Washington, D.C. also held elections. The elections took place concurrently with several other federal, state, and local elections, including the presidential election, U.S. Senate elections, U.S. House elections, and gubernatorial elections.
The 2009 United States state legislative elections were held on November 3, 2009. Two legislative chambers in two states held regularly-scheduled elections. These off-year elections coincided with other state and local elections, including gubernatorial elections in two states. Both chambers of the Northern Mariana Islands legislature were up, which remains the last time they were up in this class of elections.
Elections to state legislatures were held on November 6, 2007. Seven legislative chambers in four states held regularly-scheduled elections. These off-year elections coincided with other state and local elections, including gubernatorial elections in three states. Both chambers of the Northern Mariana Islands were up as well.
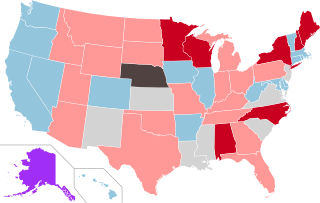
The 2006 United States state legislative elections were held on November 7, 2006, halfway through President George W. Bush's second term in office. This election was a wave elections in the United States election, and saw Democrats simultaneously reclaim both houses of Congress and pick up six governorships. Elections were held for 90 legislative chambers, with all states but Louisiana, Mississippi, New Jersey, and Virginia holding elections in at least one house. Kansas, New Mexico, and South Carolina held elections for their lower, but not upper house. Four territorial chambers in three territories and the District of Columbia were up, including the newly created territorial legislature in the U.S. Virgin Islands.
Elections to state legislatures were held on November 2, 2004, alongside other elections. Elections were held for 85 legislative chambers, with all states but Louisiana, Mississippi, New Jersey, Alabama, Maryland, and Virginia holding elections in at least one house. Michigan and Minnesota held elections for their lower, but not upper houses. Six chambers in three territories and the District of Columbia were up as well.
The 2002 United States state legislative elections were held on November 5, 2002, halfway through President George W. Bush's first term in office. This was a unique election in which the incumbent Republican party performed surprisingly well for a midterm election. Elections were held for 91 legislative chambers, with all states but Louisiana, Mississippi, New Jersey, and Virginia holding elections in at least one house. Three territorial chambers in two territories and the District of Columbia were up as well.
Elections to state legislatures were held on November 7, 2000, simultaneously with the 2000 United States presidential election. Elections were held for 86 legislative chambers in 44 states, simultaneous to those states' gubernatorial elections. Election occurred in both chambers of each state's legislature, except for Alabama, Louisiana, Maryland, Mississippi, New Jersey, and Virginia. Michigan held elections for the lower house. Six territorial chambers in four territories and the District of Columbia were up as well.
The 2024 United States state legislative elections will be held on November 5, 2024, for 85 state legislative chambers in 44 states. Across the fifty states, approximately 65 percent of all upper house seats and 85 percent of all lower house seats will be up for election. Nine legislative chambers in the five permanently-inhabited U.S. territories and the federal district of Washington, D.C. will also hold elections. The elections take place concurrently with several other federal, state, and local elections, including the presidential election, U.S. Senate elections, U.S. House elections, and gubernatorial elections.