2008 United States presidential election in Florida

Last updated

2008 United States presidential election in Florida
Flag of Florida.svg
  2004 November 4, 2008 2012  
TurnoutIncrease2.svg75% [1]
  Obama portrait crop.jpg John McCain 2009 Official.jpg
Nominee Barack Obama John McCain
Party Democratic Republican
Home state Illinois Arizona
Running mate Joe Biden Sarah Palin
Electoral vote270
Popular vote4,282,0744,045,624
Percentage50.91%48.10%

Florida Presidential Election Results 2008.svg
2008 Presidential Election in Florida by Congressional District.svg
2008 FL Pres.svg

President before election

George W. Bush
Republican

Elected President

Barack Obama
Democratic

The 2008 United States presidential election in Florida took place on November 4, 2008, and was part of the 2008 United States presidential election. Voters chose 27 representatives, or electors to the Electoral College, who voted for president and vice president.

Contents

Florida was won by Democratic nominee Barack Obama by a 2.8% margin of victory, making it the first time since 1996 the state was won by a Democrat. Prior to the election, most news organizations considered this state a toss-up, or swing state, as it was heavily targeted by both campaigns. Despite the fact that polls showed John McCain in the lead throughout much of 2008, Obama took the momentum in the two months before Election Day. Obama ended up winning the state with 51 percent of the vote, including wins in four counties that George W. Bush won in 2004. Obama became the first Democrat to win a majority of Florida's popular vote since Jimmy Carter in 1976.

As of the 2020 presidential election , this is the last election in which Flagler County and Volusia County voted for the Democratic candidate. This is also the last election that Florida trended more Democratic than the previous one.

Primary elections

State-run primaries were held for the Democratic and Republican parties on January 29. The Green Party held its own primary on February 1.

Democratic primary

Florida Democratic Presidential Primary Results – 2008
CandidateVotesPercentageDelegates*
Hillary Clinton 870,98649.77%52.5
Barack Obama 576,21432.93%33.5
John Edwards 251,56214.38%6.5**
Joe Biden 15,7040.90%0
Bill Richardson 14,9990.86%0
Dennis Kucinich 9,7030.55%0
Christopher Dodd 5,4770.31%0
Mike Gravel 5,2750.30%0
Totals1,749,920100.00%92.5

*As awarded by the May 31, 2008, meeting of the Rules and Bylaws Committee (RBC).
**Subsequently, some Edwards delegates switched to Obama.

Republican primary

McCain prevailed in Florida's Republican presidential primary. [2]

CandidateVotesPercentageCountiesDelegates
John McCain 701,76136%4557
Mitt Romney 604,93231.03%180
Rudy Giuliani 286,08914.68%00
Mike Huckabee 262,68113.47%40
Ron Paul 62,8873.23%00
Fred Thompson*22,6681.16%00
Alan Keyes 4,0600.21%00
Duncan Hunter*2,8470.15%00
Tom Tancredo*1,5730.08%00
Totals1,949,498100%6757

* Candidate dropped out of the race prior to primary.

Green primary

As part of the 2008 Green Party presidential primaries, the Green Party held a mail-in primary in Florida on February 1. [3]

Florida Green Party presidential primary (February 1, 2008) [3]
CandidateVotesPercentageNational delegates
Cynthia McKinney --11
Ralph Nader --2
Kent Mesplay--1
Kat Swift--1
Total-100%16

Campaign

Republican George W. Bush of Texas carried Florida by a convincing margin of 5% in 2004 against Democrat John Kerry, [4] a much greater margin than in 2000 when Bush controversially won the state's 25 electoral votes against Democrat Al Gore of Tennessee by 537 votes. [5]

Early polls showed Barack Obama faring poorly in Florida. During the primary season, Barack Obama did not campaign there and argued against seating its delegates for the Democratic convention, earning unfavorable media attention. Moreover, Florida's demographics did not favor him. A haven for retirees, Florida lacked many of the younger voters who passionately supported the Democratic nominee. Thus, in early 2008, opinion polling showed Republican John McCain leading most polls, sometimes by double digits. [6]

Near the end of September, however, when the financial crisis of 2007–2008 became a more potent election issue, Obama proceeded to take the lead in most of the polls. [6] Florida was especially hard hit by the economic shock. It was a hotspot of new home building and suffered tremendously from the subprime lending collapse. In addition, the state was full of retirees depending on 401ks; these were badly hurt by the stock market's fall.

Predictions

16 news organizations made state-by-state predictions of the election. Here are their last predictions before election day:

SourceRanking
D.C. Political Report [7] Likely R
Cook Political Report [8] Toss-up
The Takeaway [9] Toss-up
Electoral-vote.com [10] Lean D (flip)
Washington Post [11] Lean D (flip)
Politico [12] Lean D (flip)
RealClearPolitics [13] Toss-up
FiveThirtyEight [11] Lean D (flip)
CQ Politics [14] Toss-up
The New York Times [15] Toss-up
CNN [16] Toss-up
NPR [11] Lean R
MSNBC [11] Toss-up
Fox News [17] Toss-up
Associated Press [18] Toss-up
Rasmussen Reports [19] Toss-up

Polling

The 3 poll averages showed McCain leading throughout most of the presidential election season, until the last month of October. The final 3 polls had Obama leading 49% to 48% with undecided voters to decide the election. [20]

Fundraising

McCain raised $14,826,093. Obama raised $19,963,592. [21]

Advertising and visits

Obama and his interest groups spent $36,990,591 in the state. McCain and his interest groups spent $17,133,501. [22] The Democratic ticket visited the state 12 times to the Republicans' 11 times. [23]

Analysis

Obama won the state and its 27 electoral votes on Election Day by a margin of about 2.82%. [24] Obama held a consistent lead for most of the night as returns came in, but the networks avoided calling the state for Obama until the conservative northwestern portion, most of which is in the Central Time Zone, began reporting its returns. According to exit polling, Obama's win in the state can be attributed to winning 96% of the African-American vote, 57% of Latino voters, and 52% among Independents. [25]

Upset wins in the Orlando and Tampa Bay areas, where George W. Bush won in 2004, contributed to Obama's victory. In the former, Obama carried Orange County (which includes Orlando) by 19 points - the best margin for a Democratic candidate in 64 years. [26] Before Al Gore and John Kerry narrowly won it, Orange County hadn't supported a Democratic presidential nominee since Franklin D. Roosevelt's last run for president in 1944. He also became the first Democrat to win Orlando in a presidential election since Roosevelt. Obama carried Osceola County, near Orlando, by a 20-point margin (Bush won it in 2004 52%-47%). [26] His strong performance in Central Florida more than likely helped the Democrats flip two U.S. House seats in that region.

In the Tampa Bay region, Obama carried Hillsborough County, home to Tampa, by a 7-point margin. [27] Obama also won Pinellas County, home to St. Petersburg, by a 53%-45% margin. [27] Bush had narrowly carried the county by about 0.1% in 2004. [28] Like most Democratic candidates, Obama dominated South Florida, winning Miami-Dade, Broward, and Palm Beach counties by comfortable margins. The vote from Miami-Dade came in very late in the evening, stopping the major networks from calling the state for Obama earlier in the evening. However, Obama maintained a lead of at least 125,000 votes from the moment polls closed in the state.

On the other hand, John McCain kept the state relatively close, losing by far less than his national average. In northern Florida, a Republican stronghold, McCain won the majority of counties by double-digit landslides. Along the panhandle, McCain routinely took over 70% of the vote. [29] Obama won only a handful of counties - most home to major colleges. Moreover, McCain improved on George Bush's performance in large parts of northern Florida - something he achieved in very few other areas of the country. [29] Obama's sole accomplishment involved Duval County (Jacksonville), where he narrowed George Bush's 61,580-vote victory to a far smaller 7,919 margin. [24] [30] In 2008, Duval County had only supported a Democrat for president twice since 1952, when John F. Kennedy carried it in 1960 and when Jimmy Carter carried it in 1976.

In addition, McCain was able to do well along the I-4 corridor in central Florida. This heavily populated, "swingy" region often determines which candidate wins in Florida's statewide elections. In 2008, the Republican candidate won most counties, including heavily populated areas such as Brevard County. However, McCain's unexpectedly poor showing in Orlando, a city that had voted Republican in presidential elections from 1948 to 2004, severely hurt his position in central Florida.

Democrats also picked up two seats from Florida in the U.S. House of Representatives. Democrat Alan Grayson defeated incumbent Republican Ric Keller for Florida's 8th Congressional District seat while Democrat Suzanne Kosmas ousted incumbent Republican Tom Feeney for Florida's 24th Congressional District seat. Republicans, however, were successful at winning back Republican Mark Foley's old congressional seat in Florida's 16th Congressional District seat when Tom Rooney defeated Democratic incumbent Tim Mahoney by a comfortable margin. At the state level, Democrats picked up two seats in the Florida House of Representatives as well.

Obama became the first ever Democrat to win the White House without carrying Dixie, Gilchrist, Hamilton or Sumter Counties, as well as the first to do so without carrying Levy County since James Buchanan in 1856, the first to do so without carrying Pasco County since John F. Kennedy in 1960, and the first to do so without carrying Glades, Madison, Hernando, Okeechobee, or Putnam Counties since Lyndon B. Johnson in 1964.

Results

United States presidential election in Florida, 2008 [31]
PartyCandidateVotesPercentageElectoral votes
Democratic Barack Obama 4,282,36750.91%27
Republican John McCain 4,046,21948.1%0
Ecology Ralph Nader 28,1280.33%0
Write-Ins20,4140.24%0
Libertarian Bob Barr 17,2200.20%0
Constitution Chuck Baldwin 7,9150.09%0
Green Cynthia A. McKinney 2,8870.03%0
America's Independent Alan Keyes 2,5500.03%0
Socialism and Liberation Gloria LaRiva 1,5160.02%0
Boston Tea Charles Jay 7970.01%0
Socialist Workers Roger Calero 5330.01%0
Objectivist Thomas R. Stevens 4190.00%0
Socialist Brian Moore 4050.00%0
Prohibition Gene Amondson 2930.00%0
Republican Ron Paul 1740.00%0
Independent None of these candidates 230.00%0
Totals8,411,861100.00%27
Voter turnout (Voting age population)75.0%

By county

CountyBarack Obama
Democratic
John McCain
Republican
Various candidates
Other parties
MarginTotal votes cast
# %# %# %# %
Alachua 75,56559.99%48,51338.51%1,8891.50%27,05221.48%125,967
Baker 2,32720.99%8,67278.22%880.79%-6,345-57.23%11,087
Bay 23,65329.07%56,68369.66%1,0301.26%-33,030-40.59%81,366
Bradford 3,43029.31%8,13669.52%1371.17%-4,706-40.21%11,703
Brevard 127,62044.17%157,58954.54%3,7181.29%-29,969-10.37%288,927
Broward 492,64067.02%237,72932.34%4,7220.64%254,91134.68%735,091
Calhoun 1,82129.07%4,34569.36%981.56%-2,524-40.29%6,264
Charlotte 39,03145.65%45,20552.87%1,2631.48%-6,174-7.22%85,499
Citrus 31,46041.12%43,70657.13%1,3431.75%-12,246-16.01%76,509
Clay 26,69728.18%67,20370.95%8230.88%-40,506-42.77%94,723
Collier 54,45038.35%86,37960.84%1,1590.82%-31,929-22.49%141,988
Columbia 9,17132.50%18,67066.17%3741.32%-9,499-33.67%28,215
DeSoto 4,38343.12%5,63255.41%1491.46%-1,249-12.29%10,164
Dixie 1,92526.40%5,19471.22%1742.39%-3,269-44.82%7,293
Duval 202,61848.63%210,53750.53%3,5380.85%-7,919-1.90%416,693
Escambia 61,57239.76%91,41159.02%1,8911.22%-29,839-19.26%154,874
Flagler 24,72650.24%23,95148.66%5401.10%7751.58%49,217
Franklin 2,13435.28%3,81863.12%971.61%-1,684-27.84%6,049
Gadsden 15,58269.14%6,81130.22%1450.64%8,77138.92%22,538
Gilchrist 1,99625.53%5,65672.34%1672.14%-3,660-46.81%7,819
Glades 1,67439.29%2,53359.45%541.27%-859-20.16%4,261
Gulf 2,14929.77%4,98068.99%891.23%-2,831-39.22%7,218
Hamilton 2,36442.24%3,17956.81%530.95%-815-14.57%5,596
Hardee 2,56834.51%4,76364.00%1111.48%-2,195-29.49%7,442
Hendry 4,99845.78%5,78052.94%1391.28%-782-7.16%10,917
Hernando 41,88647.46%45,02151.01%1,3501.52%-3,135-3.55%88,257
Highlands 18,13540.37%26,22158.37%5661.27%-8,086-18.00%44,922
Hillsborough 272,96353.05%236,35545.94%5,1831.01%36,6087.11%514,501
Holmes 1,44616.78%7,03381.63%1371.59%-5,587-64.85%8,616
Indian River 29,71041.96%40,17656.74%9161.30%-10,466-14.78%70,802
Jackson 7,67135.49%13,71763.47%2251.04%-6,046-27.98%21,613
Jefferson 4,08851.24%3,79747.59%931.16%2913.65%7,978
Lafayette 64219.01%2,67979.33%561.66%-2,037-60.32%3,377
Lake 62,94842.71%82,80256.19%1,6211.10%-19,854-13.48%147,371
Lee 119,70144.34%147,60854.67%2,6880.99%-27,907-10.33%269,977
Leon 91,74761.60%55,70537.40%1,4830.99%36,04224.20%148,935
Levy 6,71135.72%11,75462.56%3241.73%-5,043-26.84%18,789
Liberty 89527.24%2,33971.18%521.58%-1,444-43.94%3,286
Madison 4,27047.94%4,54451.02%931.04%-274-3.08%8,907
Manatee 70,03445.93%80,72152.94%1,7121.12%-10,687-7.01%152,467
Marion 70,83943.58%89,62855.14%2,0751.28%-18,789-11.56%162,542
Martin 33,50842.67%44,14356.22%8711.10%-10,635-13.55%78,522
Miami-Dade 499,83157.81%360,55141.70%4,2540.49%139,28016.11%864,636
Monroe 20,90751.75%18,93346.86%5631.39%1,9744.89%40,403
Nassau 10,61827.66%27,40371.38%3710.97%-16,785-43.72%38,392
Okaloosa 25,87227.01%68,78971.82%1,1201.17%-42,917-44.81%95,781
Okeechobee 5,10839.79%7,56158.89%1701.32%-2,453-19.10%12,839
Orange 273,00958.96%186,83240.35%3,1980.69%86,17718.61%463,039
Osceola 59,96259.41%40,08639.72%8770.87%19,87619.69%100,925
Palm Beach 361,27161.08%226,03738.22%4,1280.70%135,23422.86%591,436
Pasco 102,41747.51%110,10451.07%3,0681.42%-7,687-3.56%215,589
Pinellas 248,29953.38%210,06645.16%6,7871.46%38,2338.22%465,152
Polk 113,86546.34%128,87852.45%2,9611.20%-15,013-6.11%245,704
Putnam 13,23639.77%19,63759.01%4061.22%-6,401-19.24%33,279
St. Johns 35,79133.74%69,22265.25%1,0681.00%-33,431-31.51%106,081
St. Lucie 67,12555.49%52,51243.41%1,3371.11%14,61312.08%120,974
Santa Rosa 19,47025.49%55,97273.28%9351.23%-36,502-47.79%76,377
Sarasota 102,68649.37%102,89749.47%2,4221.16%-211-0.10%208,005
Seminole 99,33548.12%105,07050.90%2,0210.98%-5,735-2.78%206,426
Sumter 17,65536.04%30,86663.01%4620.95%-13,211-26.97%48,983
Suwannee 4,91627.76%12,53470.77%2611.48%-7,618-43.01%17,711
Taylor 2,80329.86%6,45768.79%1271.36%-3,654-38.93%9,387
Union 1,30024.48%3,94074.20%701.31%-2,640-49.72%5,310
Volusia 127,79552.19%113,93846.53%3,1221.27%13,8575.66%244,855
Wakulla 5,31136.94%8,87761.75%1881.31%-3,566-24.81%14,376
Walton 7,17426.43%19,56172.08%4041.48%-12,387-45.65%27,139
Washington 2,86325.64%8,17873.23%1261.12%-5,315-47.59%11,167
Totals4,282,36750.91%4,046,21948.10%83,6620.99%236,1482.81%8,412,248
County Flips:
Democratic
Hold
Gain from Republican
Republican
Hold Florida County Flips 2008.svg
County Flips:

Counties that flipped from Republican to Democratic

By congressional district

Despite the fact that Barack Obama won the state, John McCain carried 15 congressional districts in Florida, including two district occupied by Democrats. Obama carried 10 congressional districts, including two districts occupied by Republicans.

DistrictMcCainObamaRepresentative
1st 66.66%32.10% Jeff Miller
2nd 54.27%44.58% Allen Boyd
3rd 25.99%73.30% Corrine Brown
4th 61.35%37.66% Ander Crenshaw
5th 55.57%43.18% Ginny Brown-Waite
6th 56.04%42.82% Cliff Stearns
7th 53.20%45.68% John Mica
8th 46.77%52.47% Ric Keller (110th Congress)
Alan Grayson (111th Congress)
9th 52.17%46.57% Gus Bilirakis
10th 47.17%51.30% Bill Young
11th 33.08%65.93% Kathy Castor
12th 50.23%48.84% Adam Putnam
13th 52.05%46.76% Vern Buchanan
14th 56.76%42.28% Connie Mack IV
15th 51.15%47.67% Bill Posey
16th 51.80%47.11% Tim Mahoney (110th Congress)
Tom Rooney (111th Congress)
17th 12.37%87.25% Kendrick Meek
18th 48.55%50.74% Ileana Ros-Lehtinen
19th 33.92%65.42% Robert Wexler
20th 35.99%63.25% Debbie Wasserman Schultz
21st 50.83%48.68% Lincoln Díaz-Balart
22nd 47.59%51.63% Ron Klein
23rd 16.83%82.68% Alcee Hastings
24th 50.47%48.52% Tom Feeney (110th Congress)
Suzanne Kosmas (111th Congress)
25th 50.25%49.22% Mario Díaz-Balart

Electors

Technically the voters of Florida cast their ballots for electors: representatives to the Electoral College. Florida is allocated 27 electors because it has 25 congressional districts and 2 senators. All candidates who appear on the ballot or qualify to receive write-in votes must submit a list of 27 electors, who pledge to vote for their candidate and his or her running mate. Whoever wins the majority of votes in the state is awarded all 27 electoral votes. Their chosen electors then vote for president and vice president. Although electors are pledged to their candidate and running mate, they are not obligated to vote for them. [32] An elector who votes for someone other than his or her candidate is known as a faithless elector.

The electors of each state and the District of Columbia met on December 15, 2008, to cast their votes for president and vice president. The Electoral College itself never meets as one body. Instead the electors from each state and the District of Columbia met in their respective capitols.

The following were the members of the Electoral College from the state. All 27 were pledged to Barack Obama and Joe Biden [33]

  1. Willis "Chip" Arndt
  2. Wayne Bailey
  3. Fred Balsera
  4. Terrie Brady
  5. Karl Flagg
  6. Joe Gibbons
  7. Janet Goen
  8. James Golden
  9. Chris Hand
  10. Marlon Hill
  11. Tony Hill
  12. Joan Joseph
  13. Allan Katz
  14. Gena Keebler
  15. Joan Lane
  16. Caren Lobo
  17. Rick Minor
  18. Jared Moskowitz
  19. Angela Rodante
  20. Frank Sanchez
  21. Juanita Scott
  22. Geraldine Thompson
  23. Karen Thurman
  24. Carmen Torres
  25. Kirk Wagar
  26. Enoch Williams
  27. Frederica Wilson

Related Research Articles

<span class="mw-page-title-main">2008 United States presidential election in California</span>

The 2008 United States presidential election in California took place on November 4, 2008, in California as part of the 2008 United States presidential election. Voters chose 55 electors, the most out of any of the 50 states, to the Electoral College, who voted for president and vice president.

<span class="mw-page-title-main">2008 United States presidential election in Indiana</span> Election in Indiana

The 2008 United States presidential election in Indiana took place on November 4, 2008, and was part of the 2008 United States presidential election. Voters chose 11 representatives, or electors to the Electoral College, who voted for president and vice president.

<span class="mw-page-title-main">2008 United States presidential election in Wisconsin</span> Election in Wisconsin

The 2008 United States presidential election in Wisconsin took place on November 4, 2008, as part of the 2008 United States presidential election in which all 50 states plus the District of Columbia participated. State voters chose 10 electors to represent them in the Electoral College via a popular vote pitting Democratic U.S. Senator from Illinois Barack Obama, and his running mate U.S. Senator from Delaware Joe Biden, against Republican challenger and U.S. Senator from Arizona John McCain and his running mate, Alaska Governor Sarah Palin.

<span class="mw-page-title-main">2008 United States presidential election in Utah</span> Election in Utah

The 2008 United States presidential election in Utah took place on November 4, 2008. It was part of the 2008 United States presidential election. Voters chose five representatives, or electors to the Electoral College, who voted for president and vice president.

<span class="mw-page-title-main">2008 United States presidential election in Oklahoma</span> Election in Oklahoma

The 2008 United States presidential election in Oklahoma took place on November 4, 2008, and was part of the 2008 United States presidential election. Voters chose seven representatives, or electors to the Electoral College, who voted for president and vice president.

<span class="mw-page-title-main">2008 United States presidential election in New Jersey</span> Election in New Jersey

The 2008 United States presidential election in New Jersey took place on November 4, 2008, and was part of the 2008 United States presidential election. Voters chose 15 representatives, or electors to the Electoral College, who voted for president and vice president.

<span class="mw-page-title-main">2008 United States presidential election in North Dakota</span> Election in North Dakota

The 2008 United States presidential election in North Dakota took place on November 4, 2008, and was part of the 2008 United States presidential election. Voters chose three representatives, or electors to the Electoral College, who voted for president and vice president.

<span class="mw-page-title-main">2008 United States presidential election in Nevada</span> Election in Nevada

The 2008 United States presidential election in Nevada was part of the 2008 United States presidential election, which took place on November 4, 2008, throughout all 50 states and D.C. Voters chose five representatives, or electors to the Electoral College, who voted for president and vice president.

<span class="mw-page-title-main">2008 United States presidential election in Ohio</span> Election in Ohio

The 2008 United States presidential election in Ohio took place on November 4, 2008, which was part of the 2008 United States presidential election. Voters chose 20 representatives, or electors to the Electoral College, who voted for president and vice president.

<span class="mw-page-title-main">2008 United States presidential election in Maine</span> Election in Maine

The 2008 United States presidential election in Maine took place on November 4, 2008, and was part of the 2008 United States presidential election. Maine is one of two states in the U.S. that instead of all of the state's four electors of the Electoral College to vote based upon the statewide results of the voters, two of the individual electors vote based on their congressional district because Maine has two congressional districts. The other two electors vote based upon the statewide results. See below in the section of Electors for more information.

<span class="mw-page-title-main">2008 United States presidential election in Virginia</span> Election in Virginia

The 2008 United States presidential election in Virginia took place on November 4, 2008, which was part of the 2008 United States presidential election. Voters chose 13 representatives, or electors to the Electoral College, who voted for president and vice president.

<span class="mw-page-title-main">2008 United States presidential election in New Mexico</span> Election in New Mexico

The 2008 United States presidential election in New Mexico took place on November 4, 2008. Voters chose five representatives, or electors to the Electoral College, who voted for president and vice president.

<span class="mw-page-title-main">2008 United States presidential election in Texas</span> Election in Texas

The 2008 United States presidential election in Texas took place on November 4, 2008, and was part of the 2008 United States presidential election. Voters chose 34 representatives, or electors to the Electoral College, who voted for president and vice president.

<span class="mw-page-title-main">2008 United States presidential election in Arkansas</span> Election in Arkansas

The 2008 United States presidential election in Arkansas took place on November 4, 2008, and was part of the 2008 United States presidential election. State voters chose six representatives, or electors to the Electoral College, who voted for president and vice president.

<span class="mw-page-title-main">2008 United States presidential election in Idaho</span> Election in Idaho

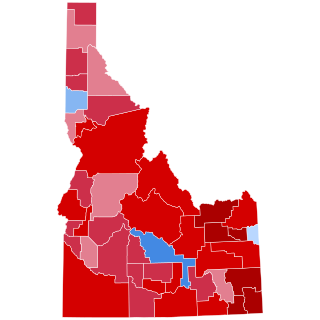
The 2008 United States presidential election in Idaho took place on November 4, 2008, and was part of the 2008 United States presidential election. Voters chose four representatives, or electors to the Electoral College, who voted for president and vice president.

<span class="mw-page-title-main">2008 United States presidential election in Georgia</span> Election in Georgia

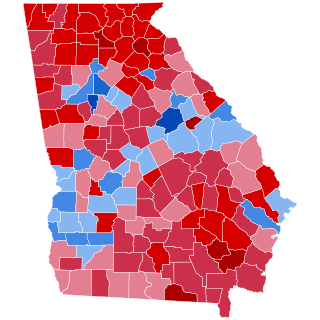
The 2008 United States presidential election in Georgia took place on November 4, 2008. Voters chose 15 representatives, or electors to the Electoral College, who voted for president and vice president.

<span class="mw-page-title-main">2008 United States presidential election in Kansas</span> Election in Kansas

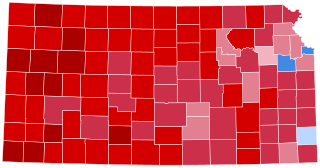
The 2008 United States presidential election in Kansas took place on November 4, 2008, and was part of the 2008 United States presidential election. Voters chose six representatives, or electors to the Electoral College, who voted for president and vice president.

<span class="mw-page-title-main">2008 United States presidential election in Kentucky</span> Election in Kentucky

The 2008 United States presidential election in Kentucky took place on November 4, 2008, and was part of the 2008 United States presidential election. Voters chose eight representatives, or electors to the Electoral College, who voted for president and vice president.

<span class="mw-page-title-main">2008 United States presidential election in Maryland</span> U.S. presidential election in Maryland

The 2008 United States presidential election in Maryland took place on November 4, 2008, and was part of the 2008 United States presidential election. Voters chose 10 representatives, or electors to the Electoral College, who voted for president and vice president.

<span class="mw-page-title-main">2008 United States presidential election in Mississippi</span> Election in Mississippi

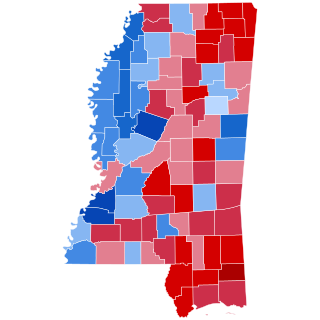
The 2008 United States presidential election in Mississippi took place on November 4, 2008, and was part of the 2008 United States presidential election. Voters chose 6 representatives, or electors to the Electoral College, who voted for president and vice president.

References

  1. "Voter Turnout". Florida Division of Elections. 2021. Archived from the original on June 2, 2015.
  2. "January 29, 2008 Presidential Preference Republican Primary". Florida Department of State. Archived from the original on May 22, 2008. Retrieved May 24, 2008.
  3. 1 2 "Size of State / Caucus Delegations". Archived from the original on May 28, 2008. Retrieved May 13, 2018.
  4. "CNN.com Election 2004" . Retrieved December 14, 2008.
  5. "2000 Presidential General Election Results - Florida" . Retrieved December 14, 2008.
  6. 1 2 Jay Cost. "Florida: McCain vs. Obama". RealClearPolitics. Retrieved June 21, 2009.
  7. "D.C.'s Political Report: The complete source for campaign summaries". January 1, 2009. Archived from the original on January 1, 2009. Retrieved August 23, 2021.
  8. "Presidential". May 5, 2015. Archived from the original on May 5, 2015. Retrieved August 23, 2021.
  9. "Vote 2008 - The Takeaway - Track the Electoral College vote predictions". April 22, 2009. Archived from the original on April 22, 2009. Retrieved August 23, 2021.
  10. "Electoral-vote.com: President, Senate, House Updated Daily". electoral-vote.com. Retrieved August 23, 2021.
  11. 1 2 3 4 Based on Takeaway
  12. "POLITICO's 2008 Swing State Map - POLITICO.com". www.politico.com. Retrieved September 22, 2016.
  13. "RealClearPolitics - Electoral Map". Archived from the original on June 5, 2008.
  14. "CQ Presidential Election Maps, 2008". CQ Politics. Archived from the original on June 14, 2009. Retrieved December 20, 2009.
  15. Nagourney, Adam; Zeleny, Jeff; Carter, Shan (November 4, 2008). "The Electoral Map: Key States". The New York Times. Retrieved May 26, 2010.
  16. "October 2008 CNN Political Ticker - CNN.com Blogs". CNN. October 31, 2008. Archived from the original on June 19, 2010. Retrieved May 26, 2010.
  17. "Winning The Electoral College". Fox News. April 27, 2010.
  18. "roadto270". hosted.ap.org. Retrieved September 22, 2016.
  19. "Election 2008: Electoral College Update - Rasmussen Reports™". www.rasmussenreports.com. Retrieved September 22, 2016.
  20. Election 2008 Polls - Dave Leip's Atlas of U.S. Presidential Elections
  21. "Presidential Campaign Finance". Archived from the original on March 24, 2009. Retrieved August 3, 2009.
  22. "Map: Campaign Ad Spending - Election Center 2008 from CNN.com". CNN. Retrieved May 26, 2010.
  23. "Map: Campaign Candidate Visits - Election Center 2008 from CNN.com". CNN. Retrieved May 26, 2010.
  24. 1 2 "Florida Department of State Division of Elections: November 4, 2008 General Election". Florida Secretary of State. Archived from the original on April 25, 2009. Retrieved June 21, 2009.
  25. "Local Exit Polls - Election Center 2008 - CNN" . Retrieved December 14, 2008.
  26. 1 2 Dave Leip. "Presidential General Election Map Comparison - Florida". Dave Leip's Atlas of U.S Presidential Elections. Retrieved June 21, 2009.
  27. 1 2 Dave Leip. "2008 Presidential General Election Results - Florida". Dave Leip's Atlas of U.S Presidential Elections. Retrieved June 21, 2009.
  28. Dave Leip. "2004 Presidential General Election Results - Florida". Dave Leip's Atlas of U.S Presidential Elections. Retrieved June 21, 2009.
  29. 1 2 "Election Results 2008". New York Times. Archived from the original on November 3, 2004. Retrieved June 21, 2009.
  30. "Florida Department of State Division of Elections: November 2, 2004 General Election". Florida Secretary of State. Archived from the original on January 23, 2009. Retrieved June 21, 2009.
  31. Dave Leip's Atlas of U.S. Presidential Elections
  32. "Electoral College". California Secretary of State. Archived from the original on October 30, 2008. Retrieved November 1, 2008.
  33. "Florida Certificate of Ascertainment, page 3 of 7". National Archives and Records Administration. Archived from the original on July 21, 2017.