2008 United States presidential election in Wyoming

Last updated

2008 United States presidential election in Wyoming
Flag of Wyoming.svg
  2004 November 4, 2008 2012  
  John McCain 2009 Official.jpg Obama portrait crop.jpg
Nominee John McCain Barack Obama
Party Republican Democratic
Home state Arizona Illinois
Running mate Sarah Palin Joe Biden
Electoral vote30
Popular vote164,95882,868
Percentage64.78%32.54%

Wyoming Presidential Election Results 2008.svg
County results

President before election

George W. Bush
Republican

Elected President

Barack Obama
Democratic

The 2008 United States presidential election in Wyoming took place on November 4, 2008, and was part of the 2008 United States presidential election. Voters chose three representatives, or electors to the Electoral College, who voted for president and vice president.

Contents

Wyoming was won by Republican nominee John McCain by a 32.2% margin of victory. Prior to the election, all 17 news organizations considered this a state McCain would win, or otherwise considered as a safe red state. Polling in the state gave a hefty and large lead to Republican John McCain over Democrat Barack Obama. Despite the overwhelming re-election victory of Democratic governor Dave Freudenthal two years prior, Wyoming remained a heavily Republican state at the presidential level, and neither of the major party candidates campaigned in the state.

Despite McCain's landslide victory, Obama did do significantly better than John Kerry in 2004 and even won one more county than Kerry. This is the most recent election in which the Democratic candidate received more than 30% of the vote in Wyoming, and the last in which the Republican nominee received fewer than double the votes of the Democratic nominee. Obama's 82,868 votes is the most received by a Democratic presidential candidate in the state's history. Obama became the first Democrat since Grover Cleveland in 1892 to win the White House without carrying Sweetwater County.

Caucuses

Campaign

Predictions

There were 16 news organizations who made state-by-state predictions of the election. Here are their last predictions before election day:

SourceRanking
D.C. Political Report [1] Likely R
Cook Political Report [2] Solid R
The Takeaway [3] Solid R
Electoral-vote.com [4] Solid R
Washington Post [5] Solid R
Politico [6] Solid R
RealClearPolitics [7] Solid R
FiveThirtyEight [5] Solid R
CQ Politics [8] Solid R
The New York Times [9] Solid R
CNN [10] Safe R
NPR [5] Solid R
MSNBC [5] Solid R
Fox News [11] Likely R
Associated Press [12] Likely R
Rasmussen Reports [13] Safe R

Polling

McCain won every single pre-election poll, and each by a double-digit margin of victory. The final 3 polls average McCain leading with 58% to 35%. [14]

Fundraising

John McCain raised a total of $447,757 in the state. Barack Obama raised $723,033. [15]

Advertising and visits

Because Wyoming is a strong red state, not much advertising went into the state. Obama didn't spend anything while the Republican National Committee spent $2,518. [16] Neither campaign visited the state. [17]

Analysis

Voting taking place in a Laramie, Wyoming polling station Election Day08 Wyo2.JPG
Voting taking place in a Laramie, Wyoming polling station

Located in the Inner Mountain West, Wyoming was home to then-incumbent Vice President Dick Cheney. It is one of the most reliably Republican states in the nation—and by some measures, the most Republican. Its demographics are a perfect fit for the Republican Party. It is the least populated state in the nation (even less than the District of Columbia), has no major metropolitan areas, and is heavily rural and White/Caucasian. Voters in the state tend to be very conservative on both social and fiscal issues. At the time of this election, however, it did still have a Democratic governor. No Democratic presidential nominee has won Wyoming since Lyndon B. Johnson in his landslide election in 1964—one of only eight times the state has voted Democrat in a presidential election.

Republicans have several structural advantages in the state. Large chunks of Wyoming are located in out-of-state television markets—most notably Denver and Salt Lake City. This forces statewide candidates to advertise in areas where most of their audience can't vote for them. Additionally, 60 percent of the state's registered voters are Republicans while only 25 percent are Democrats—one of the largest discrepancies in the nation.

The 2008 election was no different. The state was called for McCain as soon as the polls closed, and gave McCain his second largest margin of victory in 2008. McCain carried Laramie County, the most populous county that contains the state capital and largest city of Cheyenne, with 58.98 percent of the vote as well as every other county throughout the state often by more than two-to-one margins but two. Obama greatly improved upon Kerry's performance in Teton County, the most affluent county in Wyoming that includes the Jackson Hole prime ski resort and tourism attractions such as Yellowstone National Park and Grand Teton National Park, carrying the county with 60.67% of the vote. Obama also won Albany County, due in large part to the presence of the University of Wyoming at Laramie and the tremendous excitement that his campaign fueled among younger voters and college students. The county would return to its Republican roots in 2012 and 2016, but flipped to Obama's former running mate Joe Biden in 2020, the only county to do so.

With 64.78% of the popular vote, Wyoming would prove to be McCain's second strongest state in the 2008 election after Oklahoma. [18]

During the same election, incumbent Republican U.S. Senator Mike Enzi was reelected in a landslide victory over Democrat Chris Rothfuss, a professor of political science at the University of Wyoming. Enzi received 75.63% of the vote while Rothfuss took in 24.26%. For the state's other U.S. Senate seat's special election, incumbent Republican John Barrasso was also elected in a landslide with 73.35% of the vote over Democratic attorney Nick Carter of Gillette who received 26.53%. The state's sole seat in the United States House of Representatives was also up for grabs, with incumbent Republican U.S. Representative Barbara Cubin retiring. Former State Treasurer Cynthia Lummis, a Republican, defeated Democrat Gary Trauner and Libertarian W. David Herbert for the at-large seat. Lummis received 52.62% of the vote to Trauner's 42.81% and Herbert's 4.42%. Democrats did have success at the state level, however, as they picked up two seats in the Wyoming House of Representatives.

Results

2008 United States presidential election in Wyoming
PartyCandidateRunning mateVotesPercentageElectoral votes
Republican John McCain Sarah Palin 164,95864.78%3
Democratic Barack Obama Joe Biden 82,86832.54%0
Independent Ralph Nader Matt Gonzalez 2,5250.99%0
Libertarian Bob Barr Wayne Allyn Root 1,5940.63%0
Write-insWrite-ins1,5210.60%0
Constitution Chuck Baldwin Darrell Castle1,1920.47%0
Totals254,658100.00%3
Voter turnout (Voting age population)64.1%

By county

CountyJohn McCain
Republican
Barack Obama
Democratic
Various candidates
Other parties
MarginTotal votes cast
# %# %# %# %
Albany 7,93646.36%8,64450.50%5373.14%-708-4.14%17,117
Big Horn 4,04576.18%1,10820.87%1572.96%2,93755.31%5,310
Campbell 13,01179.72%2,99018.32%3191.95%10,02161.40%16,320
Carbon 4,33163.19%2,33634.08%1872.73%1,99529.11%6,854
Converse 4,92276.30%1,38021.39%1492.31%3,54254.91%6,451
Crook 2,96780.56%61216.62%1042.82%2,35563.94%3,683
Fremont 11,08363.00%6,01634.20%4932.80%5,06728.80%17,592
Goshen 3,94266.68%1,83230.99%1382.33%2,11035.69%5,912
Hot Springs 1,83472.03%61924.31%933.65%1,21547.72%2,546
Johnson 3,33476.57%90820.85%1122.57%2,42655.72%4,354
Laramie 24,54958.98%16,07238.61%1,0042.41%8,47720.37%41,625
Lincoln 6,48575.69%1,82321.28%2603.03%4,66254.41%8,568
Natrona 21,90665.85%10,47531.49%8862.66%11,43134.36%33,267
Niobrara 1,01778.65%24418.87%322.47%77359.78%1,293
Park 10,83972.33%3,75725.07%3892.60%7,08247.26%14,985
Platte 3,00265.83%1,40730.86%1513.31%1,59534.97%4,560
Sheridan 10,17767.93%4,45829.76%3462.31%5,71938.17%14,981
Sublette 3,31676.12%93621.49%1042.39%2,38054.63%4,356
Sweetwater 10,36062.02%5,76234.50%5813.48%4,59827.52%16,703
Teton 4,56537.07%7,47260.67%2792.27%-2,907-23.60%12,316
Uinta 5,76368.75%2,31727.64%3033.61%3,44641.11%8,383
Washakie 2,95672.29%1,04225.48%912.23%1,91446.81%4,089
Weston 2,61877.16%65819.39%1173.45%1,96057.77%3,393
Total164,95864.78%82,86832.54%6,8322.68%82,09032.24%254,658
County Flips:
Democratic
Hold
Gain from Republican
Republican
Hold Wyoming County Flips 2008.svg
County Flips:

Counties that flipped from Republican to Democratic

By congressional district

Due to the state's low population, only one congressional district is allocated. This district is called the At-Large district, because it covers the entire state, and thus is equivalent to the statewide election results.

DistrictMcCainObamaRepresentative
At-large 64.8%32.5% Cynthia Lummis

Electors

Technically the voters of Wyoming cast their ballots for electors: representatives to the Electoral College. Wyoming is allocated 3 electors because it has 1 congressional districts and 2 senators. All candidates who appear on the ballot or qualify to receive write-in votes must submit a list of 3 electors, who pledge to vote for their candidate and his or her running mate. Whoever wins the majority of votes in the state is awarded all 3 electoral votes. Their chosen electors then vote for president and vice president. Although electors are pledged to their candidate and running mate, they are not obligated to vote for them. [19] An elector who votes for someone other than his or her candidate is known as a faithless elector.

The electors of each state and the District of Columbia met on December 15, 2008, to cast their votes for president and vice president. The Electoral College itself never meets as one body. Instead the electors from each state and the District of Columbia met in their respective capitols.

The following were the members of the Electoral College from the state. All 3 were pledged to John McCain and Sarah Palin: [20]

  1. Rosa Goolsby
  2. Ron Micheli
  3. Susan Thomas

See also

Related Research Articles

<span class="mw-page-title-main">2008 United States presidential election in Colorado</span> Election in Colorado

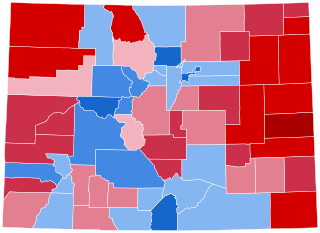
The 2008 United States presidential election in Colorado took place on November 4, 2008, as a part of the 2008 United States presidential election throughout all 50 states and the District of Columbia. Voters chose nine representatives, or electors to the Electoral College, who voted for president and vice president.

<span class="mw-page-title-main">2008 United States presidential election in Utah</span> Election in Utah

The 2008 United States presidential election in Utah took place on November 4, 2008. It was part of the 2008 United States presidential election. Voters chose five representatives, or electors to the Electoral College, who voted for president and vice president.

<span class="mw-page-title-main">2008 United States presidential election in Oklahoma</span> Election in Oklahoma

The 2008 United States presidential election in Oklahoma took place on November 4, 2008, and was part of the 2008 United States presidential election. Voters chose seven representatives, or electors to the Electoral College, who voted for president and vice president.

<span class="mw-page-title-main">2008 United States presidential election in Oregon</span> Election in Oregon

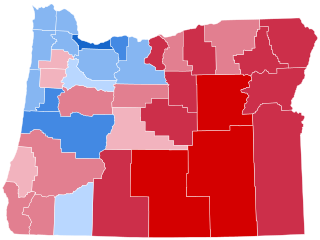
The 2008 United States presidential election in Oregon took place on November 4, 2008, and was part of the 2008 United States presidential election. Voters chose seven representatives, or electors to the Electoral College, who voted for president and vice president.

<span class="mw-page-title-main">2008 United States presidential election in Vermont</span> Election in Vermont

The 2008 United States presidential election in Vermont took place on November 4, 2008, concurrent with the federal election in all 50 states and D.C., which was part of the 2008 United States presidential election. Voters chose three representatives, or electors to the Electoral College, who voted for president and vice president.

<span class="mw-page-title-main">2008 United States presidential election in North Dakota</span> Election in North Dakota

The 2008 United States presidential election in North Dakota took place on November 4, 2008, and was part of the 2008 United States presidential election. Voters chose three representatives, or electors to the Electoral College, who voted for president and vice president.

<span class="mw-page-title-main">2008 United States presidential election in Nevada</span> Election in Nevada

The 2008 United States presidential election in Nevada was part of the 2008 United States presidential election, which took place on November 4, 2008, throughout all 50 states and D.C. Voters chose five representatives, or electors to the Electoral College, who voted for president and vice president.

<span class="mw-page-title-main">2008 United States presidential election in Ohio</span> Election in Ohio

The 2008 United States presidential election in Ohio took place on November 4, 2008, which was part of the 2008 United States presidential election. Voters chose 20 representatives, or electors to the Electoral College, who voted for president and vice president.

<span class="mw-page-title-main">2008 United States presidential election in Connecticut</span> Election in Connecticut

The 2008 United States presidential election in Connecticut took place on November 4, 2008, and was part of the 2008 United States presidential election. Voters chose seven representatives, or electors to the Electoral College, who voted for president and vice president.

<span class="mw-page-title-main">2008 United States presidential election in Alabama</span> Election in Alabama

The 2008 United States presidential election in Alabama took place on November 4, 2008, and was part of the 2008 United States presidential election. Voters chose nine representatives, or electors, to the Electoral College, who voted for president and vice president.

<span class="mw-page-title-main">2008 United States presidential election in Texas</span> Election in Texas

The 2008 United States presidential election in Texas took place on November 4, 2008, and was part of the 2008 United States presidential election. Voters chose 34 representatives, or electors to the Electoral College, who voted for president and vice president.

<span class="mw-page-title-main">2008 United States presidential election in Arkansas</span> Election in Arkansas

The 2008 United States presidential election in Arkansas took place on November 4, 2008, and was part of the 2008 United States presidential election. State voters chose six representatives, or electors to the Electoral College, who voted for president and vice president.

<span class="mw-page-title-main">2008 United States presidential election in Idaho</span> Election in Idaho

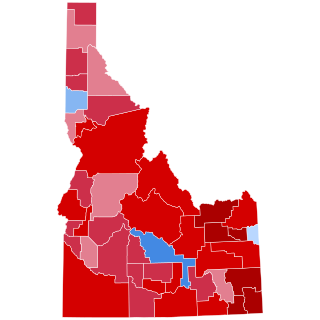
The 2008 United States presidential election in Idaho took place on November 4, 2008, and was part of the 2008 United States presidential election. Voters chose four representatives, or electors to the Electoral College, who voted for president and vice president.

<span class="mw-page-title-main">2008 United States presidential election in West Virginia</span> Election in West Virginia

The 2008 United States presidential election in West Virginia took place on November 4, 2008, and was part of the 2008 United States presidential election. Voters chose 5 representatives, or electors to the Electoral College, who voted for president and vice president.

<span class="mw-page-title-main">2008 United States presidential election in Florida</span> Election in Florida

The 2008 United States presidential election in Florida took place on November 4, 2008, and was part of the 2008 United States presidential election. Voters chose 27 representatives, or electors to the Electoral College, who voted for president and vice president.

<span class="mw-page-title-main">2008 United States presidential election in Georgia</span> Election in Georgia

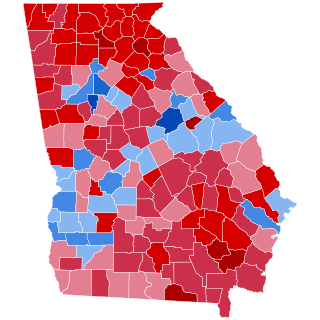
The 2008 United States presidential election in Georgia took place on November 4, 2008. Voters chose 15 representatives, or electors to the Electoral College, who voted for president and vice president.

<span class="mw-page-title-main">2008 United States presidential election in Kansas</span> Election in Kansas

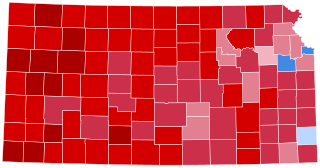
The 2008 United States presidential election in Kansas took place on November 4, 2008, and was part of the 2008 United States presidential election. Voters chose six representatives, or electors to the Electoral College, who voted for president and vice president.

<span class="mw-page-title-main">2008 United States presidential election in South Dakota</span> Election in South Dakota

The 2008 United States presidential election in South Dakota took place on November 4, 2008, and was part of the 2008 United States presidential election. Voters chose three representatives, or electors to the Electoral College, who voted for president and vice president.

<span class="mw-page-title-main">2008 United States presidential election in Maryland</span> U.S. presidential election in Maryland

The 2008 United States presidential election in Maryland took place on November 4, 2008, and was part of the 2008 United States presidential election. Voters chose 10 representatives, or electors to the Electoral College, who voted for president and vice president.

<span class="mw-page-title-main">2008 United States presidential election in Michigan</span> Election in Michigan

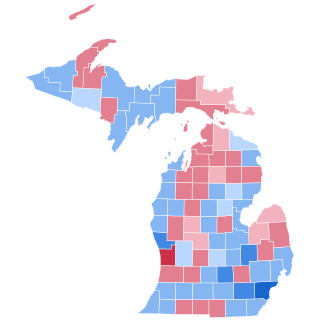
The 2008 United States presidential election in Michigan took place on November 4, 2008. It was part of the 2008 United States presidential election which happened throughout all 50 states and D.C. Voters chose 17 representatives, or electors to the Electoral College, who voted for president and vice president.

References

  1. "D.C.'s Political Report: The complete source for campaign summaries". January 1, 2009. Archived from the original on January 1, 2009. Retrieved August 23, 2021.
  2. "Presidential". May 5, 2015. Archived from the original on May 5, 2015. Retrieved August 23, 2021.
  3. "Vote 2008 - The Takeaway - Track the Electoral College vote predictions". April 22, 2009. Archived from the original on April 22, 2009. Retrieved August 23, 2021.
  4. "Electoral-vote.com: President, Senate, House Updated Daily". electoral-vote.com. Retrieved August 23, 2021.
  5. 1 2 3 4 Based on Takeaway
  6. "POLITICO's 2008 Swing State Map - POLITICO.com". www.politico.com. Retrieved September 22, 2016.
  7. "RealClearPolitics - Electoral Map". Archived from the original on June 5, 2008.
  8. "CQ Presidential Election Maps, 2008". CQ Politics. Archived from the original on June 14, 2009. Retrieved December 20, 2009.
  9. Nagourney, Adam; Zeleny, Jeff; Carter, Shan (November 4, 2008). "The Electoral Map: Key States". The New York Times. Retrieved May 26, 2010.
  10. "October 2008 CNN Political Ticker - CNN.com Blogs". CNN. October 31, 2008. Archived from the original on June 19, 2010. Retrieved May 26, 2010.
  11. "Winning The Electoral College". Fox News. April 27, 2010.
  12. "roadto270". hosted.ap.org. Retrieved September 22, 2016.
  13. "Election 2008: Electoral College Update - Rasmussen Reports". www.rasmussenreports.com. Retrieved September 22, 2016.
  14. "Election 2008 Polls - Dave Leip's Atlas of U.S. Presidential Elections".
  15. "Presidential Campaign Finance". Archived from the original on March 24, 2009. Retrieved August 18, 2009.
  16. "Map: Campaign Ad Spending - Election Center 2008 from CNN.com". CNN. Retrieved May 26, 2010.
  17. "Map: Campaign Candidate Visits - Election Center 2008 from CNN.com". CNN. Retrieved May 26, 2010.
  18. "2008 Presidential Election Statistics". Dave Leip’s Atlas of U.S. Presidential Elections. Retrieved March 5, 2018.
  19. "Electoral College". California Secretary of State. Archived from the original on October 30, 2008. Retrieved November 1, 2008.
  20. "Wyoming Secretary of State".