2008 United States presidential election in South Carolina

Last updated

2008 United States presidential election in South Carolina
Flag of South Carolina.svg
  2004 November 4, 2008 2012  
  John McCain 2009 Official.jpg Obama portrait crop.jpg
Nominee John McCain Barack Obama
Party Republican Democratic
Home state Arizona Illinois
Running mate Sarah Palin Joe Biden
Electoral vote80
Popular vote1,034,896862,449
Percentage53.87%44.90%

South Carolina Presidential Election Results by Shaded County, 2008.svg
2008 President in SC.svg

President before election

George W. Bush
Republican

Elected President

Barack Obama
Democratic

The 2008 United States presidential election in South Carolina took place on November 4, 2008, and was part of the 2008 United States presidential election. Voters chose eight representatives, or electors to the Electoral College, who voted for president and vice president.

Contents

South Carolina was won by Republican nominee John McCain by an 8.97% margin. Prior to the election, all 17 news organizations considered this a state McCain would win, or otherwise a red state. Despite the significant proportion of African Americans in the state, South Carolina still remains, like most other states throughout the South, a GOP stronghold at the state and federal levels. McCain kept South Carolina in the GOP column in 2008, clinching 53.87% of the vote. This is the first time a presidential candidate received more than 1,000,000 votes in the state. However, McCain's 9% margin was significantly less than Bush's 17% margin in 2004.

Primaries

For both parties in 2008, South Carolina's was the first primary in a Southern state and the first primary in a state in which African Americans make up a sizable percentage of the electorate. For Democrats, it was also the last primary before 22 states hosted their primaries or caucuses on February 5, 2008 (Super Tuesday).

Democratic primary

South Carolina Democratic primary, 2008
Flag of South Carolina.svg
  2004 January 26, 2008 (2008-01-26) 2016  
  Barack Obama.jpg Hillary Rodham Clinton-cropped.jpg John Edwards, official Senate photo portrait.jpg
Nominee Barack Obama Hillary Clinton John Edwards
Home state Illinois New York North Carolina
Popular vote295,214141,21793,576
Percentage55.4%26.5%17.6%

SouthCarolinaPresidentialPrimaryResults2008.svg
Election results by county. Purple denotes counties won by Obama, gold denotes those won by Clinton, and orange denotes those won by Edwards.

The 2008 South Carolina Democratic presidential primary took place on January 26, 2008. Senator Barack Obama of Illinois won the primary's popular vote by a 28.9% margin.

South Carolina's 45 delegates to the 2008 Democratic National Convention were awarded proportionally based on the results of the primary. The state also sent nine superdelegates. [1]

Candidates

Remaining
Eliminated

Campaign Finances

On the day of the South Carolina primary, Senator John Edwards led in fund raising from the state of South Carolina, followed by Barack Obama and Bill Richardson.

Obtained from CNN as of January 26, 2008 [7]

CandidateMoney raised (US$)
John Edwards $316,319
Barack Obama $257,118
Bill Richardson $196,850
Hillary Clinton $131,950
Joe Biden $55,350
Chris Dodd $22,750
Dennis Kucinich $3,750

Polling leading up to primary

All monthly averages were retrieved from RealClearPolitics. [8]

CandidateNovemberDecemberJanuaryFinal 3 Polls Averages
Hillary Clinton40%34%27%28%
Barack Obama27%33%41%48%
John Edwards11%15%17%23%
  Denotes Leader during Poll Average

Despite maintaining a major early lead in the polls, Senator Clinton rapidly fell after the Iowa Caucuses, as Barack Obama skyrocketed and John Edwards began to receive a gradual increase in the polling.

However, in the last three polls taken before the South Carolina Primary, Barack Obama took a commanding lead over both Edwards and Clinton. Also, Former Senator John Edwards had come into the margin of error with Senator Clinton for second place in the South Carolina Primary.

Final Campaigning

Obama Campaign
Presidential candidate Barack Obama addresses supporters the night before South Carolina's primary Obama in south carolina.jpg
Presidential candidate Barack Obama addresses supporters the night before South Carolina's primary

Throughout the South Carolina campaign, most pundits had predicted Barack Obama the winner, primarily because of the state's large African-American population. For this reason, Obama was shown to be significantly ahead of his two rivals, John Edwards, who carried the state in 2004, and Hillary Clinton, whose husband was popular in the African-American community. In early polls taken in the weeks leading up to the primary, Clinton had a double-digit lead over both Edwards and Obama (see poll averages above).

During a majority of the final campaigning, the attacks between the Clinton campaign and the Obama campaign highly intensified by the candidates as well as the media coverage. Barack Obama began to attack former President Bill Clinton for his comments which were taken as racist. These comments are considered by analyst and historians alike as the turning point of the South Carolina primary and ultimately the cause of Clinton's loss of support from the black community.[ citation needed ]

Despite the increasing tensions between the Clinton and Obama camps, Obama continued to widely lead in the polls (despite a surge by Edwards). Into the final days of the campaign in South Carolina, it became apparent that Obama would win by a rather wide margin. The final tally had Obama winning by 28.9% over his closest rival, Hillary Clinton.

Clinton Campaign

In the early months of the campaign, Clinton enjoyed a steep lead over Senator Obama, and a 30-point lead over former Senator John Edwards. However, after Obama's win in Iowa, Clinton's campaign in South Carolina began to fall apart by the Obama political machine rolling into South Carolina with force.

For Clinton, despite winning the popular vote in Nevada, the fact that she had lost Nevada's National Delegates, receiving 12 compared to Obama's 13 still lingered in the media. This, combined with the fact of Bill Clinton's continuing negative publicity from "injecting race into the campaign" as several people called Bill Clinton's actions in his wife's campaign.

Between battling media scrutiny on Bill Clinton, constant attacks between the Obama and Clinton campaigns, and a surging John Edwards which threatened a Clinton second-place finish, poll number began to plunge, with a poll taken by Reuters-Cspan-Zogby showing Clinton in the margin of error for second place with Edwards, with Edwards at 21% and Clinton at 25%. This was also combined with the fact of Edwards's constant barrage of attacks claiming Clinton (and Obama's) big city politics were "too good for the people of South Carolina".

However, despite the attacks from opponents that Bill Clinton's attacks largely alienated African-Americans, Clinton was able to keep a 35% support amongst that key constituency, while losing the white vote to Edwards, In the end, Clinton's African-American support was able to place her in a clear second-place finish, finishing 9 points ahead of John Edwards despite losing to Obama by 29 points.

Edwards Campaign

After the terrible results for the Edwards Campaign during the Nevada caucuses, in which Edwards finished in third with 4% of the state delegation and received no national delegates, South Carolina began to look as a state where he needed a strong finish, after finishing in third in the last 3 primaries which took place, and trailing in the number of total national delegates.

South Carolina was the state in which Edwards was born and raised. In 2004, Edwards won the South Carolina Primary, with 45% of the vote to John Kerry's 30% and Al Sharpton's 10%. While entering South Carolina, it became apparent that he needed a first-place finish, which seemed impossible, or a second-place finish, which seemed more within grasp.

Before the CNN South Carolina Debate in Myrtle Beach on Monday, January 21, 2008, John Edwards was placing a distant third in a poll taken before the debates on January 19, in which he placed third with 15% compared to Hillary Clinton's second place with 27%. [9] However, after the South Carolina debates, the tone of the campaign severely shifted.

During the South Carolina Democratic Debate in Myrtle Beach, Edwards sought to distinguish himself from Senators Obama and Clinton, and criticized them for their attacks and "big city" politics. As soon as he began to question how the attacks helped, he was widely cheered by the audience for in what many people thought was what distinguished Edwards from negative campaigning. Saying "This kind of squabbling, how many children are going to get healthcare? How many people are going to get an education from this? How many kids are going to be able to go to college because of this? We have got to understand and I respect both of my fellow candidates, but we have got to understand that this is not about us personally, it is about what we are trying to do for this country and what we believe in", Edwards began to get applause from several members of the audience. [10]

After the debate, John Edwards began to see a major influx of money and in turn, poll numbers began to rise rapidly in Edwards's favor. Along with the debate performance, Bill Clinton's remarks began to alienate black supporters from Clinton, and white supporters from Obama. As a result, Edwards won amongst white voters ages 30 to 50, while receiving the same amount of support from white 60+ year olds as Hillary Clinton according to CNN Exit Polls [11]

However, Edwards was not able to get much support from non-whites, and according to Exit Polls, received only 2% of the non-white support, while receiving 40% of the white support.

Results

Barack Obama won the primary, taking 44 of the 46 counties; Edwards won in his native Oconee County, while Clinton won in Horry County, which contains Myrtle Beach. [12]

Key:Withdrew
prior to contest
South Carolina Democratic presidential primary, 2008 [13]
CandidateResults [14] Estimated national delegates [14] [15]
VotesPercentageNational delegates
Barack Obama 295,21455.44%2533
Hillary Clinton 141,21726.52%1212
John Edwards 93,57617.57%80
Bill Richardson 7270.14%00
Joe Biden 6940.13%00
Dennis Kucinich 5520.1%00
Christopher Dodd 2470.05%00
Mike Gravel 2410.05%00
Totals532,468100.00%4545

Republican primary

South Carolina Republican primary, 2008
Flag of South Carolina.svg
  2000 January 19, 2008 (2008-01-19) 2012  
  John McCain official photo portrait.JPG Huckabee-SF-CC-024.jpg Fred Thompson-cropped.jpg
Nominee John McCain Mike Huckabee Fred Thompson
Party Republican Republican Republican
Home state Arizona Arkansas Tennessee
Popular vote147,733132,99069,681
Percentage33.15%29.84%15.63%

SCgopprimary-county.PNG
Election results by county. Red denotes counties won by McCain, and Pink denotes those won by Huckabee.

The South Carolina Republican primary, 2008 was held on January 19, with 24 delegates at stake. [16] The Republican National Committee took half of South Carolina's 47 delegates away from them because the state committee moved its Republican primary before February 5. [16] [17] It was held on the same day as the Nevada Republican caucuses, 2008.

The primary has become one of several key early state nominating contests in the process of choosing the nominee of the Republican party for the November 2008 election for President of the United States. It has historically been more important for the Republican Party than for the Democratic Party; from its inception in 1980 through the election of 2000, the winner of the Republican presidential primary has gone on to win the nomination. [18] As of 2008, the primary has cemented its place as the "First in the South" primary for both parties. [19]

This states 24 delegates would be awarded on a "Winner-Takes-All" basis. 12 Delegates for the Statewide winner and 12 delegates awarded on a District-winner basis awarding 2 delegates for each of the states then 6 Congressional districts. [20]

Polling

As of January 19, RealClearPolitics reported that the average support from polls placed McCain in the lead with 26.9%, followed by Huckabee with 25.9%, Romney with 14.7%, Thompson with 14.6%, Paul with 4.4%, and Giuliani with 3.4%. [21]

Results

Huckabee was for weeks leading in the state but lost by a 14,743 vote margin. He did manage to win Congressional districts 3, 4 and 5 in the North of the state earning him a total of 6 delegates. [20]

Mike Huckabee giving his concession speech after the 2008 South Carolina Presidential Primary in Columbia, SC. Huckabee SC concession.JPG
Mike Huckabee giving his concession speech after the 2008 South Carolina Presidential Primary in Columbia, SC.

John McCain won the statewide primary earning him 12 Delegates [22] [23] [24] as well as Congressional Districts 1, 2 and 6. earning him an additional 6 delegates for a total of 18. [20]

100% of precincts reporting [25]
CandidateVotesPercentageDelegates
John McCain 147,73333.15%18
Mike Huckabee 132,99029.84%6
Fred Thompson 69,68115.63%0
Mitt Romney 68,17715.3%0
Ron Paul 16,1553.62%0
Rudy Giuliani 9,5752.15%0
Duncan Hunter*1,0510.24%0
Tom Tancredo*1210.03%0
Hugh Cort 880.02%0
John H. Cox 830.02%0
Cap Fendig 230.01%0
Total445,677100%24

* Candidate withdrew his bid for the nomination prior to the reporting of the primary. On January 22, 2008, after a poor showing Fred Thompson dropped out of the race. Duncan Hunter did so too.

Results of prior primaries

Campaign

Predictions

There were 16 news organizations who made state-by-state predictions of the election. Here are their last predictions before election day:

SourceRanking
D.C. Political Report [27] Likely R
Cook Political Report [28] Solid R
The Takeaway [29] Solid R
Electoral-vote.com [30] Solid R
Washington Post [31] Solid R
Politico [32] Solid R
RealClearPolitics [33] Solid R
FiveThirtyEight [31] Solid R
CQ Politics [34] Solid R
The New York Times [35] Solid R
CNN [36] Safe R
NPR [31] Solid R
MSNBC [31] Solid R
Fox News [37] Likely R
Associated Press [38] Likely R
Rasmussen Reports [39] Safe R

Polling

McCain won every single pre-election poll. The final 3 polls averaged McCain leading with 53% to 43%. [40]

Fundraising

John McCain raised a total of $2,574,332 in the state. Barack Obama raised $2,227,877. [41]

Advertising and visits

Obama spent $967,640. McCain and his interest groups spent $587,645. [42] Neither campaign visited the state. [43]

Analysis

South Carolina, historically part of the Solid South, has become a Republican stronghold. Since Barry Goldwater carried the state in 1964, the only Democratic presidential nominee to win it was Jimmy Carter of neighboring Georgia in 1976. Since then, the Palmetto State has reliably voted Republican. This trend continued in 2008, even though South Carolina has one of the highest African-American populations in the country. Neither Obama nor McCain seriously contested the state, as it was viewed by both campaigns as a safe GOP/McCain/red state.

On Election Day, McCain captured South Carolina with 53.87% of the vote. McCain dominated the populous northwest, while Obama did best in the cities of Columbia and Charleston, as well as the rural, heavily African American areas. In comparison to the past two elections where the margin was much larger, Obama's relative closeness can be attributed to the large turnout of African American voters in the state who cast their votes 96% for Obama. [44] McCain's margin of victory in South Carolina was much less than that of George W. Bush who carried the Palmetto State in 2004 with 57.98% of the vote to John Kerry's 40.90%, a 17.08% margin of victory compared to McCain's 8.97% in 2008, resulting in an 8.11% swing to the Democrats in 2008.

During the same election, incumbent Republican U.S. Senator Lindsey Graham was reelected over Democrat Bob Conley. Graham received 57.52% of the vote while Conley took in 42.25%. At the state level, however, Democrats picked up two seats in the South Carolina House of Representatives. As of 2020, this is the last election in which the margin of victory in South Carolina was within single digits.

Results

United States presidential election in South Carolina, 2008
PartyCandidateRunning mateVotesPercentageElectoral votes
Republican John McCain Sarah Palin 1,034,89653.87%8
Democratic Barack Obama Joe Biden 862,44944.90%0
Libertarian Bob Barr Wayne Allyn Root 7,2830.38%0
Constitution Chuck Baldwin Darrell Castle6,2870.36%0
Petition Ralph Nader Matt Gonzalez 5,0530.26%0
Green Cynthia McKinney Rosa Clemente 4,4610.23%0
Totals1,920,969100.00%8
Voter turnout (Voting age population)58.0%

By county

CountyJohn McCain
Republican
Barack Obama
Democratic
Various candidates
Other parties
MarginTotal
#%#%#%#%
Abbeville 6,26456.94%4,59341.75%1441.31%1,67115.19%11,001
Aiken 42,84961.41%26,10137.41%8201.18%16,74824.00%69,770
Allendale 94723.53%3,02975.27%481.20%-2,082-51.74%4,024
Anderson 48,69065.99%24,13232.70%9651.31%24,55833.29%73,787
Bamberg 2,30933.89%4,42664.95%791.16%-2,117-31.06%6,814
Barnwell 4,76948.67%4,93150.33%981.00%-162-1.66%9,798
Beaufort 37,82154.92%30,39644.14%6530.94%7,42510.78%68,870
Berkeley 36,20555.89%27,75542.84%1441.27%8,45013.05%64,781
Calhoun 3,69547.75%3,97051.31%730.94%-275-3.56%7,738
Charleston 69,82245.21%82,69853.55%1,9141.24%-12,876-8.34%154,434
Cherokee 13,30564.07%7,21534.74%2461.19%6,09029.33%20,766
Chester 6,31845.19%7,47853.49%1851.32%-1,160-8.30%13,981
Chesterfield 8,32550.89%7,84247.94%1921.17%4832.95%16,359
Clarendon 6,75843.45%8,67355.77%1210.78%-1,915-12.32%15,552
Colleton 8,52549.22%8,61649.74%1801.04%-91-0.52%17,321
Darlington 14,54449.58%14,50549.45%2850.97%390.13%29,334
Dillon 5,87443.78%7,40855.21%1351.01%-1,534-11.43%13,417
Dorchester 29,92957.11%21,80641.61%6701.28%8,12315.50%52,405
Edgefield 6,33454.98%5,07544.05%1110.97%1,25910.93%11,520
Fairfield 3,91233.67%7,59165.33%1161.00%-3,679-31.66%11,619
Florence 29,86151.16%28,01247.99%5000.85%1,8493.17%58,373
Georgetown 15,79052.13%14,19946.88%3010.99%1,5915.25%30,290
Greenville 116,36361.03%70,88637.18%3,4081.79%45,47723.85%190,657
Greenwood 16,99557.29%12,34841.62%3241.09%4,64715.67%29,667
Hampton 3,43936.78%5,81662.20%951.02%-2,377-25.42%9,350
Horry 64,60961.65%38,87937.10%1,3101.25%25,73024.55%104,798
Jasper 3,36538.01%5,38960.87%1001.12%-2,024-22.86%8,854
Kershaw 16,46658.84%11,22640.11%2931.05%5,24018.73%27,985
Lancaster 16,44156.85%12,13941.97%3411.18%4,30214.88%28,921
Laurens 15,33458.34%10,57840.25%3701.41%4,75618.09%26,282
Lee 3,07433.58%5,96065.12%1191.30%-2,886-31.54%9,153
Lexington 74,96068.45%33,30330.41%1,2491.14%41,65738.04%109,512
Marion 5,41635.69%9,60863.32%1500.99%-4,192-27.63%15,174
Marlboro 3,99636.74%6,79462.47%860.79%-2,798-25.73%10,876
McCormick 2,43746.58%2,75552.66%400.76%-318-6.08%5,232
Newberry 9,61658.19%6,70840.60%2001.21%2,90817.59%16,524
Oconee 21,16467.98%9,48130.45%4871.57%11,68337.53%31,132
Orangeburg 12,11530.47%27,26368.58%3760.95%-15,148-38.11%39,754
Pickens 32,55272.13%11,69125.91%8851.96%20,86146.22%45,128
Richland 57,94135.11%105,65664.02%1,4400.87%-47,715-28.91%165,037
Saluda 5,19160.34%3,32338.63%891.03%1,86821.71%8,603
Spartanburg 65,04260.04%41,63238.43%1,6541.53%23,41021.61%108,328
Sumter 18,58141.89%25,43157.33%3460.78%-6,850-15.44%44,358
Union 7,44954.97%5,93543.80%1671.23%1,51411.17%13,551
Williamsburg 5,00430.43%11,27968.59%1600.98%-6,275-38.16%16,443
York 54,50058.17%37,91840.47%1,2781.36%16,58217.70%93,696
Totals1,034,89653.87%862,44944.90%23,6241.23%172,4478.97%1,920,969
County Flips:
Democratic
Hold
Gain from Republican
Republican
Hold South Carolina County Flips 2008.svg
County Flips:

Counties that flipped from Republican to Democratic

By congressional district

John McCain carried 5 of the state's 6 congressional districts in South Carolina, including one held by a Democrat.

DistrictMcCainObamaRepresentative
1st 56.50%42.27% Henry E. Brown Jr. (R)
2nd 53.87%45.11% Joe Wilson (R)
3rd 63.72%33% Gresham Barrett (R)
4th 60.43%37.91% Bob Inglis (R)
5th 53.04%45.80% John Spratt (D)
6th 34.89%64.15% Jim Clyburn (D)

Electors

Technically the voters of South Carolina cast their ballots for electors: representatives to the Electoral College. South Carolina is allocated 8 electors because it has 6 congressional districts and 2 senators. All candidates who appear on the ballot or qualify to receive write-in votes must submit a list of 8 electors, who pledge to vote for their candidate and their running mate. Whoever wins the majority of votes in the state is awarded all 8 electoral votes. Their chosen electors then vote for president and vice president. Although electors are pledged to their candidate and running mate, they are not obligated to vote for them. [45] An elector who votes for someone other than their candidate is known as a faithless elector.

The electors of each state and the District of Columbia met on December 15, 2008, to cast their votes for president and vice president. The Electoral College itself never meets as one body. Instead the electors from each state and the District of Columbia met in their respective capitols.

The following were the members of the Electoral College from the state. All 8 were pledged to John McCain and Sarah Palin: [46]

  1. Benny Kinlaw
  2. Betty Sheppard Poe
  3. Katon Dawson
  4. Patrick Bonner Haddon
  5. Rebecca Delleney
  6. Shelby Phillips
  7. Susan Aiken
  8. Wayland Moody

See also

Related Research Articles

<span class="mw-page-title-main">2008 United States presidential election</span> 56th quadrennial U.S. presidential election

The 2008 United States presidential election was the 56th quadrennial presidential election, held on November 4, 2008. The Democratic ticket of Barack Obama, the junior senator from Illinois, and Joe Biden, the senior senator from Delaware, defeated the Republican ticket of John McCain, the senior senator from Arizona, and Sarah Palin, the governor of Alaska. Obama became the first African American to be elected to the presidency, as well as being only the third sitting United States senator elected president, joining Warren G. Harding and John F. Kennedy. Meanwhile, this was only the second successful all-senator ticket since the 1960 election and is the only election where both major party nominees were sitting senators. This was the first election since 1952 in which an neither incumbent president nor vice president was on the ballot.

The following is a timeline of major events leading up to and immediately following the United States presidential election of 2008. The election was the 56th quadrennial United States presidential election. It was held on November 4, 2008, but its significant events and background date back to about 2002. The Democratic Party nominee, Senator Barack Obama of Illinois, defeated the Republican Party's nominee, Senator John McCain of Arizona.

<span class="mw-page-title-main">2008 United States presidential election in Iowa</span>

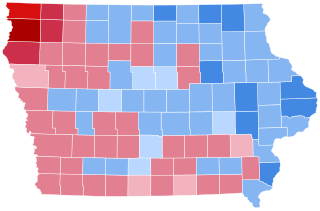
The 2008 United States presidential election in Iowa took place on November 4, 2008, as part of the 2008 United States presidential election. Voters chose seven representatives, or electors to the Electoral College, who voted for president and vice president.

<span class="mw-page-title-main">2008 United States presidential election in Indiana</span> Election in Indiana

The 2008 United States presidential election in Indiana took place on November 4, 2008, and was part of the 2008 United States presidential election. Voters chose 11 representatives, or electors to the Electoral College, who voted for president and vice president.

<span class="mw-page-title-main">2008 United States presidential election in Massachusetts</span> Election in Massachusetts

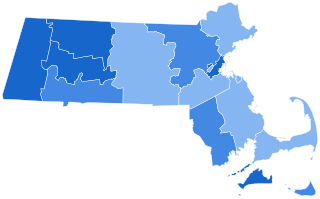
The 2008 United States presidential election in Massachusetts took place, as in all 50 states and D.C., as part of the 2008 United States presidential election of November 4, 2008. Voters chose 12 representatives, or electors to the Electoral College, who, in turn, voted for the office of president and vice president.

<span class="mw-page-title-main">2008 United States presidential election in Oklahoma</span> Election in Oklahoma

The 2008 United States presidential election in Oklahoma took place on November 4, 2008, and was part of the 2008 United States presidential election. Voters chose seven representatives, or electors to the Electoral College, who voted for president and vice president.

<span class="mw-page-title-main">2008 United States presidential election in New Jersey</span> Election in New Jersey

The 2008 United States presidential election in New Jersey took place on November 4, 2008, and was part of the 2008 United States presidential election. Voters chose 15 representatives, or electors to the Electoral College, who voted for president and vice president.

<span class="mw-page-title-main">2008 United States presidential election in North Carolina</span>

The 2008 United States presidential election in North Carolina was part of the national event on November 4, 2008, throughout all 50 states and D.C. In North Carolina, voters chose 15 representatives, or electors, to the Electoral College, who voted for president and vice president.

<span class="mw-page-title-main">2008 United States presidential election in Montana</span> Election in Montana

The 2008 United States presidential election in Montana took place on November 4, 2008, and was part of the 2008 United States presidential election. Voters chose three representatives, or electors to the Electoral College, who voted for president and vice president.

<span class="mw-page-title-main">2008 United States presidential election in Illinois</span> Election in Illinois

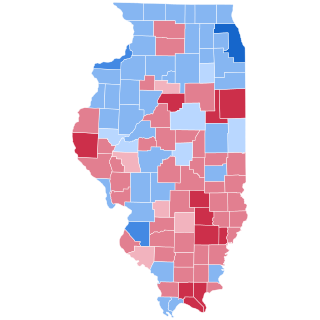
The 2008 United States presidential election in Illinois took place on November 4, 2008, and was part of the 2008 United States presidential election. Voters chose 21 representatives, or electors to the Electoral College, who voted for president and vice president.

<span class="mw-page-title-main">2008 United States presidential election in Pennsylvania</span> Selection of Pennsylvanias presidential electors

The 2008 United States presidential election in Pennsylvania was part of the 2008 United States presidential election, which took place on November 4, 2008, throughout all 50 states and the District of Columbia. Voters chose 21 representatives, or electors to the Electoral College, who voted for president and vice president.

<span class="mw-page-title-main">2008 United States presidential election in Delaware</span>

The 2008 United States presidential election in Delaware took place on November 4, 2008, and was part of the 2008 United States presidential election. Voters chose three representatives, or electors to the Electoral College, who voted for president and vice president.

<span class="mw-page-title-main">2008 United States presidential election in Florida</span> Election in Florida

The 2008 United States presidential election in Florida took place on November 4, 2008, and was part of the 2008 United States presidential election. Voters chose 27 representatives, or electors to the Electoral College, who voted for president and vice president.

<span class="mw-page-title-main">2008 United States presidential election in Georgia</span> Election in Georgia

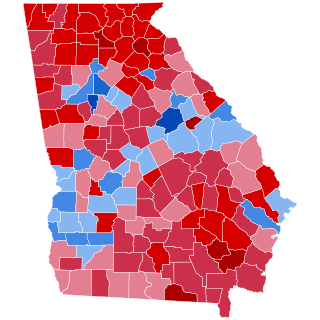
The 2008 United States presidential election in Georgia took place on November 4, 2008. Voters chose 15 representatives, or electors to the Electoral College, who voted for president and vice president.

<span class="mw-page-title-main">2008 United States presidential election in Kentucky</span> Election in Kentucky

The 2008 United States presidential election in Kentucky took place on November 4, 2008, and was part of the 2008 United States presidential election. Voters chose eight representatives, or electors to the Electoral College, who voted for president and vice president.

<span class="mw-page-title-main">2008 United States presidential election in South Dakota</span> Election in South Dakota

The 2008 United States presidential election in South Dakota took place on November 4, 2008, and was part of the 2008 United States presidential election. Voters chose three representatives, or electors to the Electoral College, who voted for president and vice president.

<span class="mw-page-title-main">2008 United States presidential election in Michigan</span> Election in Michigan

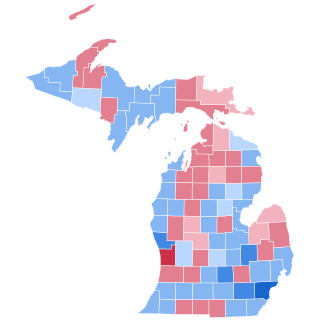
The 2008 United States presidential election in Michigan took place on November 4, 2008. It was part of the 2008 United States presidential election which happened throughout all 50 states and D.C. Voters chose 17 representatives, or electors to the Electoral College, who voted for president and vice president.

<span class="mw-page-title-main">2008 United States presidential election in Tennessee</span> Election in Tennessee

The 2008 United States presidential election in Tennessee took place on November 4, 2008, and was part of the 2008 United States presidential election. Voters chose 11 representatives, or electors to the Electoral College, who voted for president and vice president.

<span class="mw-page-title-main">2008 United States presidential election in New Hampshire</span> Election in New Hampshire

The 2008 United States presidential election in New Hampshire took place on November 4, 2008, as part of the 2008 United States presidential election throughout all 50 states and D.C. Voters chose four representatives, or electors to the Electoral College, who voted for president and vice president.

<span class="mw-page-title-main">2016 United States presidential election in South Carolina</span> Election in South Carolina

The 2016 United States presidential election was held on November 8, 2016, as part of the 2016 General Election in which all 50 states plus the District of Columbia participated. South Carolina voters chose electors to represent them in the Electoral College via a popular vote pitting the Republican Party's nominee, businessman Donald Trump, and running mate Indiana Governor Mike Pence against Democratic Party nominee, former Secretary of State Hillary Clinton and her running mate, Virginia Senator Tim Kaine.

References

  1. "CNN Election Center 2008: Primary Results" . Retrieved May 23, 2010.
  2. "Obama, Huckabee win Iowa".
  3. "New Mexico Gov. Richardson drops out of '08 Race". CNN. January 10, 2008. Retrieved May 23, 2010.
  4. "Kucinich Drops Out". The Washington Post. January 25, 2008. Retrieved May 23, 2010.
  5. "SC Democrats reject Colbert's candidacy". CNN. November 1, 2007. Retrieved May 23, 2010.
  6. "Colbert on Democratic Rejection". CNN. November 5, 2007. Retrieved May 23, 2010.
  7. "CNN Map: Campaign money race-" . Retrieved May 23, 2010.
  8. "RealClear Politics- Election 2008- South Carolina".
  9. "Pollster.com". Archived from the original on May 11, 2008.
  10. "John Edwards for President- South Carolina". Archived from the original on May 5, 2010.
  11. "CNN Election Center 2008: Primary Exit Poll" . Retrieved May 23, 2010.
  12. "SC Dem. Party Election Results". Archived from the original on April 3, 2010.
  13. "South Carolina Unofficial Results". South Carolina Secretary of State . Retrieved January 27, 2008.
  14. 1 2 The Green papers
  15. "What happens to Edwards' delegates?". Democratic Convention Watch. May 14, 2008. Retrieved June 4, 2008.
  16. 1 2 "The Primary Season: 2008 Republican Calendar". The New York Times. Retrieved January 19, 2008.
  17. Crummy, Karen E. (January 18, 2008). "S.C. primary down and dirty". Denver Post. Retrieved January 20, 2008.
  18. "GOP bellwether South Carolina shows a tangled race: Pg 1". Christian Science Monitor. August 2, 2007. Retrieved January 20, 2008.
  19. "First in the South". Fox News. Archived from the original on January 22, 2008. Retrieved January 20, 2008.
  20. 1 2 3 "The Green Papers 2008 Presidential Primaries, Caucuses, and Conventions - South Carolina Republican Presidential Nominating Process Primary: Saturday 19 January 2008" . Retrieved August 15, 2011.
  21. "South Carolina Republican Primary Polling" . Retrieved January 19, 2008.
  22. "Election Center 2008: Primary Results for South Carolina". CNN. Retrieved January 22, 2008.
  23. "South Carolina Republican Primary Results". Fox News. Archived from the original on January 23, 2008. Retrieved January 20, 2008.
  24. "MSNBC: South Carolina Primary Results" . Retrieved January 20, 2008.
  25. "2008 Presidential Republican Primary Election Results - South Carolina". Dave Leip's Atlas of U.S. Presidential Elections. January 20, 2008. Retrieved March 22, 2009.
  26. 1 2 3 4 5 6 "GOP bellwether South Carolina shows a tangled race: Pg 2". Christian Science Monitor. August 2, 2007. Retrieved January 20, 2008.
  27. "D.C.'s Political Report: The complete source for campaign summaries". January 1, 2009. Archived from the original on January 1, 2009. Retrieved August 23, 2021.
  28. "Presidential". May 5, 2015. Archived from the original on May 5, 2015. Retrieved August 23, 2021.
  29. "Vote 2008 - The Takeaway - Track the Electoral College vote predictions". April 22, 2009. Archived from the original on April 22, 2009. Retrieved August 23, 2021.
  30. "Electoral-vote.com: President, Senate, House Updated Daily". electoral-vote.com. Retrieved August 23, 2021.
  31. 1 2 3 4 Based on Takeaway
  32. "POLITICO's 2008 Swing State Map - POLITICO.com". www.politico.com. Retrieved September 22, 2016.
  33. "RealClearPolitics - Electoral Map". Archived from the original on June 5, 2008.
  34. "CQ Presidential Election Maps, 2008". CQ Politics. Archived from the original on June 14, 2009. Retrieved December 20, 2009.
  35. Nagourney, Adam; Zeleny, Jeff; Carter, Shan (November 4, 2008). "The Electoral Map: Key States". The New York Times. Retrieved May 26, 2010.
  36. "October 2008 CNN Political Ticker - CNN.com Blogs". CNN. October 31, 2008. Archived from the original on June 19, 2010. Retrieved May 26, 2010.
  37. "Winning The Electoral College". Fox News. April 27, 2010.
  38. "roadto270". hosted.ap.org. Retrieved September 22, 2016.
  39. "Election 2008: Electoral College Update - Rasmussen Reports™". www.rasmussenreports.com. Retrieved September 22, 2016.
  40. "Election 2008 Polls". Dave Leip's Atlas of U.S. Presidential Elections.
  41. "Presidential Campaign Finance". Archived from the original on January 18, 2009. Retrieved August 18, 2009.
  42. "Map: Campaign Ad Spending - Election Center 2008 from CNN.com". CNN. Retrieved May 26, 2010.
  43. "Map: Campaign Candidate Visits - Election Center 2008 from CNN.com". CNN. Retrieved May 26, 2010.
  44. South Carolina Exit Polls
  45. "Electoral College". California Secretary of State. Archived from the original on October 30, 2008. Retrieved November 1, 2008.
  46. "U. S. Electoral College 2008 Election - Certificates". May 20, 2019.