2018 South Carolina House of Representatives election

Last updated

2018 South Carolina House of Representatives election
Flag of South Carolina.svg
  2016 November 6, 2018 2020  

All 124 seats in the South Carolina House of Representatives
63 seats needed for a majority
Turnout55.03%
 Majority partyMinority party
  Jay Lucas.jpg Todd Rutherford.jpg
Leader Jay Lucas J. Todd Rutherford
Party Republican Democratic
Leader sinceDecember 2, 2014January 8, 2013
Leader's seat 121st 101st
Last election8044
Seats won8044
Seat changeSteady2.svgSteady2.svg
Popular vote869,238572,739
Percentage58.48%38.53%
SwingDecrease2.svg4.73%Increase2.svg3.57%

2018 South Carolina House of Representatives election results map.svg
Results:
     Democratic hold     Democratic gain
     Republican hold     Republican gain

Speaker before election

Jay Lucas
Republican

Elected Speaker

Jay Lucas
Republican

The 2018 South Carolina House of Representatives elections took place as part of the biennial United States elections. South Carolina voters elected state representatives in all 124 of the state house's districts. State representatives serve two-year terms in the South Carolina State House. A statewide map of South Carolina's state House districts can be obtained from the South Carolina House's website here, and individual district maps can be obtained from the U.S. Census here.

Contents

A primary election on June 12, 2018, and a primary runoff on June 26, 2018, in races in which no candidate received over 50% of his/her party's primary vote, determined which candidates appeared on the November 6 general election ballot. Primary election results can be obtained from the South Carolina Secretary of State's website. [1]

Following the 2016 state house elections, Republicans maintained effective control of the House with 80 members. Democrats held 44 seats following the 2016 elections.

In the 2018 election, although multiple seats flipped between parties, there was no net change. Therefore, Republicans maintained an 80-to-44-seat majority over Democrats.

Results

2019 South Carolina House of Representatives Election Results.svg
PartyVotesSeats
No.%No.+/−%
South Carolina Republican Party 869,23858.4880064.52
South Carolina Democratic Party 572,73938.5344035.48
Write-in 17,2711.16000.00
Libertarian Party of South Carolina 13,0640.88000.00
Working Families Party 4,6120.31000.00
American Party of South Carolina 4,2940.29000.00
United Citizens Party 3,6110.24000.00
Independent 1,6480.11000.00
Total1,486,477100.00124±0100.00
Registered voters3,137,659100.00
Turnout1,486,47747.38
Source: South Carolina Election Commission [1]
Popular vote
Republican
58.48%
Democratic
38.53%
Other
2.99%
House seats
Republican
64.52%
Democratic
35.48%

Summary of results by State House District

Election results: [2]

State House District Incumbent PartyElected RepresentativeParty
1st Bill Whitmire Republican Bill Whitmire Republican
2nd Bill Sandifer III Republican Bill Sandifer III Republican
3rd Gary E. Clary Republican Gary E. Clary Republican
4th Davey Hiott Republican Davey Hiott Republican
5th Neal Collins Republican Neal Collins Republican
6th Brian White Republican Brian White Republican
7th Jay West Republican Jay West Republican
8th Jonathon Hill Republican Jonathon Hill Republican
9th Anne Thayer Republican Anne Thayer Republican
10th Joshua Putnam Republican West Cox Republican
11th Craig Gagnon Republican Craig Gagnon Republican
12th J. Anne Parks Democratic J. Anne Parks Democratic
13th John McCravy Republican John McCravy Republican
14th Michael Pitts Republican Michael Pitts Republican
15th Samuel Rivers, Jr. Republican J.A. Moore Democratic
16th Mark Willis Republican Mark Willis Republican
17th Mike Burns Republican Mike Burns Republican
18th Tommy Stringer Republican Tommy Stringer Republican
19th Dwight Loftis Republican Dwight Loftis Republican
20th Dan Hamilton Republican Adam Morgan Republican
21st Phyllis Henderson Republican Bobby Cox Republican
22nd Jason Elliott Republican Jason Elliott Republican
23rd Chandra Dillard Democratic Chandra Dillard Democratic
24th Bruce Bannister Republican Bruce Bannister Republican
25th Leola Robinson-Simpson Democratic Leola Robinson-Simpson Democratic
26th R. Raye Felder Republican R. Raye Felder Republican
27th Garry Smith Republican Garry Smith Republican
28th Ashley Trantham Republican Ashley Trantham Republican
29th Dennis Moss Republican Dennis Moss Republican
30th Steve Moss Republican Steve Moss Republican
31st Rosalyn Henderson Myers Democratic Rosalyn Henderson Myers Democratic
32nd Derham Cole, Jr. Republican Max Hyde Republican
33rd Eddie Tallon Republican Eddie Tallon Republican
34th Mike Forrester Republican Mike Forrester Republican
35th Bill Chumley Republican Bill Chumley Republican
36th Merita Ann Allison Republican Merita Ann Allison Republican
37th Steven Long Republican Steven Long Republican
38th Josiah Magnuson Republican Josiah Magnuson Republican
39th Cal Forrest Republican Cal Forrest Republican
40th Richard Martin Republican Richard Martin Republican
41st MaryGail Douglas Democratic Annie McDaniel Democratic
42nd Michael Anthony Democratic Doug Gilliam Republican
43rd Francis Delleney, Jr. Republican Randy Ligon Republican
44th Mandy Powers Norrell Democratic Mandy Powers Norrell Democratic
45th Brandon Newton Republican Brandon Newton Republican
46th Gary Simrill Republican Gary Simrill Republican
47th Tommy Pope Republican Tommy Pope Republican
48th Bruce M. Bryant Republican Bruce M. Bryant Republican
49th John King Democratic John King Democratic
50th Will Wheeler Democratic Will Wheeler Democratic
51st J. David Weeks Democratic J. David Weeks Democratic
52nd Laurie Funderburk Democratic Laurie Funderburk Democratic
53rd Richie Yow Republican Richie Yow Republican
54th Patricia Henegan Democratic Patricia Henegan Democratic
55th Jackie Hayes Democratic Jackie Hayes Democratic
56th Tim McGinnis Republican Tim McGinnis Republican
57th Lucas Atkinson Democratic Lucas Atkinson Democratic
58th Jeff Johnson Republican Jeff Johnson Republican
59th Terry Alexander Democratic Terry Alexander Democratic
60th Phillip Lowe Republican Phillip Lowe Republican
61st Roger Kirby Democratic Roger Kirby Democratic
62nd Robert Williams Democratic Robert Williams Democratic
63rd Jay Jordan Republican Jay Jordan Republican
64th Robert L. Ridgeway III Democratic Robert L. Ridgeway III Democratic
65th James "Jay" Lucas Republican James "Jay" Lucas Republican
66th Gilda Cobb-Hunter Democratic Gilda Cobb-Hunter Democratic
67th George Smith, Jr. Republican George Smith, Jr. Republican
68th Heather Ammons Crawford Republican Heather Ammons Crawford Republican
69th Chris Wooten Republican Chris Wooten Republican
70th Wendy Brawley Democratic Wendy Brawley Democratic
71st Nathan Ballentine Republican Nathan Ballentine Republican
72nd James Smith, Jr. Democratic Seth Rose Democratic
73rd Christopher Hart Democratic Christopher Hart Democratic
74th James Rutherford Democratic James Rutherford Democratic
75th Kirkman Finlay III Republican Kirkman Finlay III Republican
76th Leon Howard Democratic Leon Howard Democratic
77th Joseph McEachern Democratic Kambrell Garvin Democratic
78th Beth Bernstein Democratic Beth Bernstein Democratic
79th Ivory Thigpen Democratic Ivory Thigpen Democratic
80th Jimmy Bales Democratic Jimmy Bales Democratic
81st Bart Blackwell Republican Bart Blackwell Republican
82nd William Clyburn, Sr. Democratic William Clyburn, Sr. Democratic
83rd Bill Hixon Republican Bill Hixon Republican
84th Ronnie Young Republican Ronnie Young Republican
85th Chip Huggins Republican Chip Huggins Republican
86th Bill Taylor Republican Bill Taylor Republican
87th Todd Atwater Republican Paula Rawl Calhoon Republican
88th McLain Toole Republican McLain Toole Republican
89th Micah Caskey Republican Micah Caskey Republican
90th Justin Bamberg Democratic Justin Bamberg Democratic
91st Lonnie Hosey Democratic Lonnie Hosey Democratic
92nd Joseph Daning Republican Joseph Daning Republican
93rd Russell L. Ott Democratic Russell L. Ott Democratic
94th Katie Arrington Republican Con Chellis Republican
95th Jerry Govan, Jr. Democratic Jerry Govan, Jr. Democratic
96th Lawrence Kit Spires Republican Lawrence Kit Spires Republican
97th Patsy Knight Democratic Mandy Kimmons Republican
98th Chris Murphy Republican Chris Murphy Republican
99th Nancy Mace Republican Nancy Mace Republican
100th Sylleste Davis Republican Sylleste Davis Republican
101st Cezar McKnight Democratic Cezar McKnight Democratic
102nd Joseph Jefferson, Jr. Democratic Joseph Jefferson, Jr. Democratic
103rd Carl Anderson Democratic Carl Anderson Democratic
104th Greg Duckworth Republican William Bailey Republican
105th Kevin J. Hardee Republican Kevin J. Hardee Republican
106th Russell Fry Republican Russell Fry Republican
107th Alan Clemmons Republican Alan Clemmons Republican
108th Lee Hewitt Republican Lee Hewitt Republican
109th David Mack Democratic David Mack Democratic
110th William S. Cogswell, Jr. Republican William S. Cogswell, Jr. Republican
111th Wendell Gilliard Democratic Wendell Gilliard Democratic
112th Mike Sottile Republican Mike Sottile Republican
113th Marvin Pendarvis Democratic Marvin Pendarvis Democratic
114th Lin Bennett Republican Lin Bennett Republican
115th Peter McCoy Republican Peter McCoy Republican
116th Robert Brown Democratic Robert Brown Democratic
117th Bill Crosby Republican Krystle Matthews Democratic
118th Bill Herbkersman Republican Bill Herbkersman Republican
119th Leonidas Stavrinakis Democratic Leonidas Stavrinakis Democratic
120th Weston Newton Republican Weston Newton Republican
121st Michael Rivers Democratic Michael Rivers Democratic
122nd William Bowers Democratic Shedron Williams Democratic
123rd Jeff Bradley Republican Jeff Bradley Republican
124th Shannon Erickson Republican Shannon Erickson Republican

Detailed Results by State House District

[3] [4]

District 1District 2District 3District 4District 5District 6District 7District 8District 9District 10District 11District 12District 13District 14District 15District 16District 17District 18District 19District 20District 21District 22District 23District 24District 25District 26District 27District 28District 29District 30District 31District 32District 33District 34District 35District 36District 37District 38District 39District 40District 41District 42District 43District 44District 45District 46District 47District 48District 49District 50District 51District 52District 53District 54District 55District 56District 57District 58District 59District 60District 61District 62District 63District 64District 65District 66District 67District 68District 69District 70District 71District 72District 73District 74District 75District 76District 77District 78District 79District 80District 81District 82District 83District 84District 85District 86District 87District 88District 89District 90District 91District 92District 93District 94District 95District 96District 97District 98District 99District 100District 101District 102District 103District 104District 105District 106District 107District 108District 109District 110District 111District 112District 113District 114District 115District 116District 117District 118District 119District 120District 121District 122District 123District 124

District 1

1st District General Election
PartyCandidateVotes%
Republican Bill Whitmire (incumbent) 11,287 98.63
Write-in 1571.37
Total votes11,444 100.0
Republican hold

District 2

2nd District General Election
PartyCandidateVotes%
Republican Bill Sandifer (incumbent) 9,276 64.11
Democratic Jody G. Gaulin5,17835.79
Write-in 150.10
Total votes14,469 100.0
Republican hold

District 3

3rd District General Election
PartyCandidateVotes%
Republican Gary Clary (incumbent) 7,576 97.18
Write-in 2202.82
Total votes7,796 100.0
Republican hold

District 4

4th District General Election
PartyCandidateVotes%
Republican Davey Hiott (incumbent) 11,883 98.74
Write-in 1521.26
Total votes12,035 100.0
Republican hold

District 5

5th District General Election
PartyCandidateVotes%
Republican Neal Collins (incumbent) 11,617 97.21
Write-in 3342.79
Total votes11,951 100.0
Republican hold

District 6

6th District General Election
PartyCandidateVotes%
Republican Brian White (incumbent) 10,243 82.52
American Ryan Cowsert2,09516.88
Write-in 750.60
Total votes12,413 100.0
Republican hold

District 7

7th District General Election
PartyCandidateVotes%
Republican Jay West (incumbent) 8,201 98.56
Write-in 1201.44
Total votes8,321 100.0
Republican hold

District 8

8th District General Election
PartyCandidateVotes%
Republican Jonathon Hill (incumbent) 10,186 98.15
Write-in 1921.85
Total votes10,378 100.0
Republican hold

District 9

9th District General Election
PartyCandidateVotes%
Republican Anne Thayer (incumbent) 9,165 97.89
Write-in 1982.11
Total votes9,363 100.0
Republican hold

District 10

10th District General Election
PartyCandidateVotes%
Republican West Cox 10,471 76.63
Democratic Lucy Hoffman3,19023.35
Write-in 30.02
Total votes13,664 100.0
Republican hold

District 11

11th District General Election
PartyCandidateVotes%
Republican Craig A. Gagnon (incumbent) 7,292 65.50
Democratic Devon D. Smith3,83234.42
Write-in 90.08
Total votes11,133 100.0
Republican hold

District 12

12th District General Election
PartyCandidateVotes%
Democratic Anne Parks (incumbent) 7,256 96.70
Write-in 2483.30
Total votes7,504 100.0
Democratic hold

District 13

13th District General Election
PartyCandidateVotes%
Republican John McCravy (incumbent) 10,353 71.55
Democratic Michael Gaskin4,10928.40
Write-in 70.05
Total votes14,469 100.0
Republican hold

District 14

14th District General Election
PartyCandidateVotes%
Republican Mike Pitts (incumbent) 10,356 97.86
Write-in 2262.14
Total votes10,582 100.0
Republican hold

District 15

15th District General Election
PartyCandidateVotes%
Democratic J.A. Moore4,56949.67
Working Families J.A. Moore2492.71
TOTALJ.A. Moore4,81852.38
Republican Samuel Rivers, Jr. (incumbent)4,37247.53
Write-in 90.10
Total votes9,199 100.0
Democratic gain from Republican

District 16

16th District General Election
PartyCandidateVotes%
Republican Mark Willis (incumbent) 9,259 97.11
Write-in 2762.89
Total votes9,535 100.0
Republican hold

District 17

17th District General Election
PartyCandidateVotes%
Republican Mike Burns (incumbent) 11,598 76.03
Democratic Judi Buckley3,64123.87
Write-in 150.10
Total votes15,254 100.0
Republican hold

District 18

18th District General Election
PartyCandidateVotes%
Republican Tommy Stringer (incumbent) 12,110 97.96
Write-in 2522.04
Total votes12,362 100.0
Republican hold

District 19

19th District General Election
PartyCandidateVotes%
Republican Dwight Loftis (incumbent) 6,744 61.16
TOTALCarrie Counton4,27238.74
Democratic Carrie Counton4,03836.62
Working Families Carrie Counton2342.12
Write-in 100.09
Total votes11,026 100.0
Republican hold

District 20

20th District General Election
PartyCandidateVotes%
Republican Adam Morgan 12,234 97.61
Write-in 2992.39
Total votes12,533 100.0
Republican hold

District 21

21st District General Election
PartyCandidateVotes%
Republican Bobby Cox 13,826 97.93
Write-in 2922.07
Total votes14,118 100.0
Republican hold

District 22

22nd District General Election
PartyCandidateVotes%
Republican Jason Elliott (incumbent) 9,955 63.35
Democratic B.K. Brown5,67336.10
Write-in 860.55
Total votes15,714 100.0
Republican hold

District 23

23rd District General Election
PartyCandidateVotes%
Democratic Chandra Dillard (incumbent) 7,728 97.72
Write-in 1802.28
Total votes7,908 100.0
Democratic hold

District 24

24th District General Election
PartyCandidateVotes%
Republican Bruce Bannister (incumbent) 12,992 97.03
Write-in 3982.97
Total votes13,390 100.0
Republican hold

District 25

25th District General Election
PartyCandidateVotes%
Democratic Leola Robinson-Simpson (incumbent) 7,623 81.57
Independent Tony Boyce1,64817.64
Write-in 740.79
Total votes9,345 100.0
Democratic hold

District 26

26th District General Election
PartyCandidateVotes%
Republican Raye Felder (incumbent) 10,940 57.12
Democratic John Kraljevich8,20542.84
Write-in 90.05
Total votes19,154 100.0
Republican hold

District 27

27th District General Election
PartyCandidateVotes%
Republican Garry R. Smith (incumbent) 10,994 96.74
Write-in 3713.26
Total votes11,365 100.0
Republican hold

District 28

28th District General Election
PartyCandidateVotes%
Republican Ashley Trantham (incumbent) 11,804 97.30
Write-in 3282.70
Total votes12,132 100.0
Republican hold

District 29

29th District General Election
PartyCandidateVotes%
Republican Dennis Moss (incumbent) 9,711 98.59
Write-in 1391.41
Total votes9,850 100.0
Republican hold

District 30

30th District General Election
PartyCandidateVotes%
Republican Steve Moss (incumbent) 8,550 98.86
Write-in 991.14
Total votes8,649 100.0
Republican hold

District 31

31st District General Election
PartyCandidateVotes%
Democratic Rosalyn Henderson-Myers (incumbent) 6,598 98.85
Write-in 771.15
Total votes6,675 100.0
Democratic hold

District 32

32nd District General Election
PartyCandidateVotes%
Republican Max Hyde 10,239 98.12
Write-in 1961.88
Total votes10,435 100.0
Republican hold

District 33

33rd District General Election
PartyCandidateVotes%
Republican Eddie Tallon (incumbent) 10,378 98.48
Write-in 1601.52
Total votes10,538 100.0
Republican hold

District 34

34th District General Election
PartyCandidateVotes%
Republican Mike Forrester (incumbent) 9,668 97.28
Write-in 2702.72
Total votes9,938 100.0
Republican hold

District 35

35th District General Election
PartyCandidateVotes%
Republican Bill Chumley (incumbent) 11,437 65.20
Democratic Helen Pendarvis6,07134.61
Write-in 330.19
Total votes17,541 100.0
Republican hold

District 36

36th District General Election
PartyCandidateVotes%
Republican Rita Allison (incumbent) 8,790 97.59
Write-in 2172.41
Total votes9,007 100.0
Republican hold

District 37

37th District General Election
PartyCandidateVotes%
Republican Steven Long (incumbent) 8,733 97.44
Write-in 2292.56
Total votes8,962 100.0
Republican hold

District 38

38th District General Election
PartyCandidateVotes%
Republican Josiah Magnuson (incumbent) 11,106 98.04
Write-in 2221.96
Total votes11,328 100.0
Republican hold

District 39

39th District General Election
PartyCandidateVotes%
Republican Cal Forrest (incumbent) 10,424 98.90
Write-in 1161.10
Total votes10,540 100.0
Republican hold

District 40

40th District General Election
PartyCandidateVotes%
Republican Richard Martin (incumbent) 9,212 98.17
Write-in 1721.83
Total votes9,384 100.0
Republican hold

District 41

41st District General Election
PartyCandidateVotes%
Democratic Annie McDaniel 9,630 78.15
United Citizens Fred Kennedy2,59321.04
Write-in 990.80
Total votes12,322 100.0
Democratic hold

District 42

42nd District General Election
PartyCandidateVotes%
Republican Doug Gilliam 8,074 98.21
Write-in 1471.79
Total votes8,221 100.0
Republican gain from Democratic

District 43

43rd District General Election
PartyCandidateVotes%
Republican Randy Ligon 8,247 65.75
Democratic Tom Hawk4,29334.23
Write-in 30.02
Total votes12,543 100.0
Republican hold

District 44

44th District General Election
PartyCandidateVotes%
Democratic Mandy Powers Norrell (incumbent) 6,903 93.32
Write-in 4946.68
Total votes7,397 100.0
Democratic hold

District 45

45th District General Election
PartyCandidateVotes%
Republican Brandon Newton (incumbent) 15,125 62.47
TOTALCorin Buskey9,07537.48
Democratic Corin Buskey8,72936.05
Working Families Corin Buskey3461.43
Write-in 130.05
Total votes24,213 100.0
Republican hold

District 46

46th District General Election
PartyCandidateVotes%
Republican Gary Simrill (incumbent) 9,395 60.56
Democratic Carl Kenny Dicks6,10439.35
Write-in 140.09
Total votes15,513 100.0
Republican hold

District 47

47th District General Election
PartyCandidateVotes%
Republican Tommy Pope (incumbent) 10,894 71.57
Democratic Marty R. Cotton4,31528.35
Write-in 120.08
Total votes15,221 100.0
Republican hold

District 48

48th District General Election
PartyCandidateVotes%
Republican Bruce M. Bryant (incumbent) 10,504 60.79
Democratic Vickie Holt6,76439.15
Write-in 110.06
Total votes17,279 100.0
Republican hold

District 49

49th District General Election
PartyCandidateVotes%
Democratic John R. King (incumbent)7,83075.54
Working Families John R. King (incumbent)5975.76
TOTALJohn R. King (incumbent)8,42781.3
American Johnny Walker1,88618.20
Write-in 520.50
Total votes10,365 100.0
Democratic hold

District 50

50th District General Election
PartyCandidateVotes%
Democratic Will Wheeler (incumbent) 9,139 98.51
Write-in 1381.49
Total votes9,277 100.0
Democratic hold

District 51

51st District General Election
PartyCandidateVotes%
Democratic David Weeks (incumbent) 8,758 99.01
Write-in 880.99
Total votes8,846 100.0
Democratic hold

District 52

52nd District General Election
PartyCandidateVotes%
Democratic Laurie Slade Funderburk (incumbent) 9,017 57.41
Republican Penry Gustafson6,67242.48
Write-in 180.11
Total votes15,707 100.0
Democratic hold

District 53

53rd District General Election
PartyCandidateVotes%
Republican Richie Yow (incumbent) 6,521 98.37
Write-in 1081.63
Total votes6,629 100.0
Republican hold

District 54

54th District General Election
PartyCandidateVotes%
Democratic Patricia "Pat" Moore Henegan (incumbent) 7,189 97.80
Write-in 1622.20
Total votes7,351 100.0
Democratic hold

District 55

55th District General Election
PartyCandidateVotes%
Democratic Jackie E. Hayes (incumbent) 6,758 97.04
Write-in 2062.96
Total votes6,964 100.0
Democratic hold

District 56

56th District General Election
PartyCandidateVotes%
Republican Tim McGinnis (incumbent) 10,984 97.59
Write-in 2712.41
Total votes11,255 100.0
Republican hold

District 57

57th District General Election
PartyCandidateVotes%
Democratic Lucas Atkinson (incumbent) 8,946 98.98
Write-in 921.02
Total votes9,038 100.0
Democratic hold

District 58

58th District General Election
PartyCandidateVotes%
Republican Jeff Johnson (incumbent) 9,580 98.65
Write-in 1311.35
Total votes9,711 100.0
Republican hold

District 59

59th District General Election
PartyCandidateVotes%
Democratic Terry Alexander (incumbent) 9,064 98.31
Write-in 1561.69
Total votes9,220 100.0
Democratic hold

District 60

60th District General Election
PartyCandidateVotes%
Republican Phillip Lowe (incumbent) 7,548 61.11
Democratic Devon Justin Long4,79438.81
Write-in 100.08
Total votes12,352 100.0
Republican hold

District 61

61st District General Election
PartyCandidateVotes%
Democratic Roger K. Kirby (incumbent) 7,246 98.54
Write-in 1071.46
Total votes7,246 100.0
Democratic hold

District 62

62nd District General Election
PartyCandidateVotes%
Democratic Robert Williams (incumbent) 7,821 63.12
Republican Billy Baldwin4,55536.76
Write-in 150.15
Total votes12,391 100.0
Democratic hold

District 63

63rd District General Election
PartyCandidateVotes%
Republican Jay Jordan (incumbent) 9,171 64.60
Democratic Mike Brank5,01635.33
Write-in 90.06
Total votes14,196 100.0
Republican hold

District 64

64th District General Election
PartyCandidateVotes%
Democratic Robert L. Ridgeway III (incumbent) 9,665 98.70
Write-in 1271.30
Total votes9,792 100.0
Democratic hold

District 65

65th District General Election
PartyCandidateVotes%
Republican Jay Lucas (incumbent) 8,962 98.83
Write-in 1061.17
Total votes9,068 100.0
Republican hold

District 66

66th District General Election
PartyCandidateVotes%
Democratic Gilda Cobb-Hunter (incumbent) 8,800 71.53
Republican Tom Connor3,49728.42
Write-in 60.05
Total votes12,303 100.0
Democratic hold

District 67

67th District General Election
PartyCandidateVotes%
Republican Murrell "George" Smith (incumbent) 8,640 82.17
Libertarian Brandon Humphries1,81117.22
Write-in 640.61
Total votes10,515 100.0
Republican hold

District 68

68th District General Election
PartyCandidateVotes%
Republican Heather Ammons Crawford (incumbent) 9,457 79.29
Libertarian Cameron Ventura2,40820.19
Write-in 620.52
Total votes11,927 100.0
Republican hold

District 69

69th District General Election
PartyCandidateVotes%
Republican Chris Wooten (incumbent) 10,587 64.69
TOTALBeth Ann Rocheleau5,33032.56
Democratic Beth Ann Rocheleau5,07431.00
Working Families Beth Ann Rocheleau2561.56
Libertarian David Morris4252.60
Write-in 240.15
Total votes16,366 100.0
Republican hold

District 70

70th District General Election
PartyCandidateVotes%
Democratic Wendy C. Brawley (incumbent) 9,820 98.21
Write-in 1791.79
Total votes9,999 100.0
Democratic hold

District 71

71st District General Election
PartyCandidateVotes%
Republican Nathan Ballentine (incumbent) 13,844 97.35
Write-in 3772.65
Total votes14,221 100.0
Republican hold

District 72

72nd District General Election
PartyCandidateVotes%
Democratic Seth Rose 7,301 98.66
Write-in 991.34
Total votes7,400 100.0
Democratic hold

District 73

73rd District General Election
PartyCandidateVotes%
Democratic Chris Hart (incumbent) 8,900 77.95
Republican Ralph Bell2,51322.01
Write-in 50.04
Total votes11,418 100.0
Democratic hold

District 74

74th District General Election
PartyCandidateVotes%
Democratic J. Todd Rutherford (incumbent) 9,681 90.05
United Citizens Michael L. Block1,0189.47
Write-in 520.48
Total votes10,751 100.0
Democratic hold

District 75

75th District General Election
PartyCandidateVotes%
Republican Kirkman Finlay III (incumbent) 7,842 57.48
TOTALJohn Crangle5,78042.37
Democratic John Crangle5,59441.01
American John Crangle1861.36
Write-in 200.15
Total votes13,642 100.0
Republican hold

District 76

76th District General Election
PartyCandidateVotes%
Democratic Leon Howard (incumbent) 10,639 100.0
Write-in 880.82
Total votes10,727 99.18
Democratic hold

District 77

77th District General Election
PartyCandidateVotes%
Democratic Kambrell Garvin 14,056 84.75
Libertarian Justin Bishop2,44514.74
Write-in 850.51
Total votes16,586 100.0
Democratic hold

District 78

78th District General Election
PartyCandidateVotes%
Democratic Beth Bernstein (incumbent) 10,178 97.87
Write-in 2222.13
Total votes10,400 100.0
Democratic hold

District 79

79th District General Election
PartyCandidateVotes%
Democratic Ivory Thigpen (incumbent) 13,307 87.82
Libertarian Victor Kocher1,78211.76
Write-in 630.43
Total votes15,152 100.0
Democratic hold

District 80

80th District General Election
PartyCandidateVotes%
Democratic Jimmy Bales (incumbent) 9,722 97.94
Write-in 2042.06
Total votes9,926 100.0
Democratic hold

District 81

81st District General Election
PartyCandidateVotes%
Republican Bart Blackwell (incumbent) 11,342 62.95
TOTALElise Fox6,66737.0
Democratic Elise Fox6,31735.06
Working Families Elise Fox3501.94
Write-in 80.04
Total votes18,017 100.0
Republican hold

District 82

82nd District General Election
PartyCandidateVotes%
Democratic William "Bill" Clyburn, Sr. (incumbent) 8,041 96.69
Write-in 2753.31
Total votes8,316 100.0
Democratic hold

District 83

83rd District General Election
PartyCandidateVotes%
Republican Bill Hixon (incumbent) 10,414 80.44
Libertarian David Weikle2,43118.78
Write-in 1020.79
Total votes12,947 100.0
Republican hold

District 84

84th District General Election
PartyCandidateVotes%
Republican Ronnie Young (incumbent) 8,270 64.76
Democratic Jennifer Cook Lariscey4,48735.13
Write-in 140.11
Total votes12,771 100.0
Republican hold

District 85

85th District General Election
PartyCandidateVotes%
Republican Chip Huggins (incumbent) 12,206 66.01
TOTALSam Edwards6,27333.93
Democratic Sam Edwards5,92632.05
Working Families Sam Edwards3471.88
Write-in 120.06
Total votes18,491 100.0
Republican hold

District 86

86th District General Election
PartyCandidateVotes%
Republican Bill Taylor (incumbent) 9,703 97.75
Write-in 2232.25
Total votes9,923 100.0
Republican hold

District 87

87th District General Election
PartyCandidateVotes%
Republican Paula Rawl Calhoon 13,617 73.68
Democratic Diane Summers4,83226.15
Write-in 320.17
Total votes18,481 100.0
Republican hold

District 88

88th District General Election
PartyCandidateVotes%
Republican McLain "Mac" Toole (incumbent) 9,872 98.24
Write-in 1771.76
Total votes10,049 100.0
Republican hold

District 89

89th District General Election
PartyCandidateVotes%
Republican Micah Caskey (incumbent) 8,861 97.34
Write-in 2422.66
Total votes9,103 100.0
Republican hold

District 90

90th District General Election
PartyCandidateVotes%
Democratic Justin Bamberg (incumbent) 7,146 96.54
Write-in 2563.46
Total votes7,402 100.0
Democratic hold

District 91

91st District General Election
PartyCandidateVotes%
Democratic Lonnie Hosey (incumbent) 8,768 98.78
Write-in 1081.22
Total votes8,876 100.0
Democratic hold

District 92

92nd District General Election
PartyCandidateVotes%
Republican Joe Daning (incumbent) 8,874 97.03
Write-in 2722.97
Total votes9,146 100.0
Republican hold

District 93

93rd District General Election
PartyCandidateVotes%
Democratic Russell L. Ott (incumbent) 8,507 65.99
Republican Terry L. Kiser, Sr.4,38133.98
Write-in 40.03
Total votes12,892 100.0
Democratic hold

District 94

94th District General Election
PartyCandidateVotes%
Republican Con Chellis 8,458 62.93
Democratic Damian Daly4,96836.96
Write-in 140.10
Total votes13,440 100.0
Republican hold

District 95

95th District General Election
PartyCandidateVotes%
Democratic Jerry Govan (incumbent) 8,602 72.48
Republican Chester D. Palmer3,25827.45
Write-in 80.07
Total votes11,868 100.0
Democratic hold

District 96

96th District General Election
PartyCandidateVotes%
Republican Kit Spires (incumbent) 7,040 71.73
Democratic Bob Vanlue2,75428.06
Write-in 200.20
Total votes9,814 100.0
Republican hold

District 97

97th District General Election
PartyCandidateVotes%
Republican Mandy W. Kimmons 7,746 53.86
Democratic Patsy G. Knight (incumbent)6,62946.10
Write-in 60.04
Total votes14,381 100.0
Republican gain from Democratic

District 98

98th District General Election
PartyCandidateVotes%
Republican Chris Murphy (incumbent) 9,179 96.12
Write-in 3713.88
Total votes9,550 100.0
Republican hold

District 99

99th District General Election
PartyCandidateVotes%
Republican Nancy Mace (incumbent) 10,836 60.97
TOTALJen Gibson6,92738.98
Democratic Jen Gibson6,59037.08
Working Families Jen Gibson3371.90
Write-in 90.05
Total votes17,772 100.0
Republican hold

District 100

100th District General Election
PartyCandidateVotes%
Republican Sylleste H. Davis (incumbent) 10,809 62.52
Democratic Michael W. Yates6,35336.75
Write-in 1270.73
Total votes17,289 100.0
Republican hold

District 101

101st District General Election
PartyCandidateVotes%
Democratic Cezar McKnight (incumbent) 8,759 96.40
Write-in 3273.60
Total votes9,086 100.0
Democratic hold

District 102

102nd District General Election
PartyCandidateVotes%
Democratic Joe Jefferson (incumbent) 7,480 60.92
Republican Terry Hardesty4,78838.99
Write-in 110.09
Total votes12,279 100.0
Democratic hold

District 103

103rd District General Election
PartyCandidateVotes%
Democratic Carl L. Anderson (incumbent) 9,078 98.27
Write-in 1601.73
Total votes9,238 100.0
Democratic hold

District 104

104th District General Election
PartyCandidateVotes%
Republican William Bailey 14,859 98.38
Write-in 2441.62
Total votes15,103 100.0
Republican hold

District 105

105th District General Election
PartyCandidateVotes%
Republican Kevin Hardee (incumbent) 8,965 97.99
Write-in 1842.01
Total votes9,149 100.0
Republican hold

District 106

106th District General Election
PartyCandidateVotes%
Republican Russell Fry (incumbent) 13,198 68.38
TOTALRobin Gause6,08831.54
Democratic Robin Gause5,77929.94
Working Families Robin Gause1820.94
American Robin Gause1270.66
Write-in 140.07
Total votes19,300 100.0
Republican hold

District 107

107th District General Election
PartyCandidateVotes%
Republican Alan Clemmons (incumbent) 10,617 97.49
Write-in 2732.51
Total votes10,890 100.0
Republican hold

District 108

108th District General Election
PartyCandidateVotes%
Republican Lee Hewitt (incumbent) 14,450 98.47
Write-in 2241.53
Total votes14,674 100.0
Republican hold

District 109

109th District General Election
PartyCandidateVotes%
Democratic David Mack III (incumbent)7,47380.81
Working Families David Mack III (incumbent)6166.66
TOTALDavid Mack III (incumbent)8,08987.47
Libertarian Rodney Travis1,12912.21
Write-in 300.35
Total votes9,248 100.0
Democratic hold

District 110

110th District General Election
PartyCandidateVotes%
Republican William S. Cogswell, Jr. (incumbent) 9,264 55.07
Democratic Ben Pogue7,54844.87
Write-in 90.05
Total votes16,821 100.0
Republican hold

District 111

111th District General Election
PartyCandidateVotes%
Democratic Wendell G. Gilliard (incumbent) 10,011 98.43
Write-in 4601.57
Total votes10,171 100.0
Democratic hold

District 112

112th District General Election
PartyCandidateVotes%
Republican Mike Sottile (incumbent) 12,210 57.31
TOTALJoe Preston9,08442.64
Democratic Joe Preston8,71240.89
Working Families Joe Preston3721.75
Write-in 130.06
Total votes21,307 100.0
Republican hold

District 113

113th District General Election
PartyCandidateVotes%
Democratic Marvin R. Pendarvis (incumbent) 8,256 98.49
Write-in 1271.51
Total votes8,383 100.0
Democratic hold

District 114

114th District General Election
PartyCandidateVotes%
Republican Lin Bennett (incumbent) 8,619 52.52
Democratic Dan P. Jones7,15343.59
Libertarian Melissa Couture6333.86
Write-in 60.04
Total votes16,411 100.0
Republican hold

District 115

115th District General Election
PartyCandidateVotes%
Republican Peter McCoy (incumbent) 9,727 51.45
TOTALCarol Tempel9,17348.52
Democratic Carol Tempel8,77646.42
Working Families Carol Tempel3972.10
Write-in 60.03
Total votes18,906 100.0
Republican hold

District 116

116th District General Election
PartyCandidateVotes%
Democratic Robert L. Brown (incumbent)8,69954.04
Working Families Robert L. Brown (incumbent)3292.04
TOTALRobert L. Brown (incumbent)9,02856.08
Republican Carroll O'Neal7,0654389
Write-in 40.02
Total votes16,097 100.0
Democratic hold

District 117

117th District General Election
PartyCandidateVotes%
Democratic Krystle Matthews 5,577 53.45
Republican Bill Crosby (incumbent)4,84246.41
Write-in 150.14
Total votes10,434 100.0
Democratic gain from Republican

District 118

118th District General Election
PartyCandidateVotes%
Republican Bill Herbkersman (incumbent) 12,175 97.98
Write-in 2512.02
Total votes12,426 100.0
Republican hold

District 119

119th District General Election
PartyCandidateVotes%
Democratic Leonidas "Leon" Stavrinakis (incumbent) 11,172 64.98
Republican Paul Sizemore6,01134.96
Write-in 110.06
Total votes17,194 100.0
Democratic hold

District 120

120th District General Election
PartyCandidateVotes%
Republican Weston Newton (incumbent) 10,806 64.12
Democratic Ryan Martz6,03935.83
Write-in 80.05
Total votes16,853 100.0
Republican hold

District 121

121st District General Election
PartyCandidateVotes%
Democratic Michael F. Rivers, Sr. (incumbent) 9,440 97.92
Write-in 2012.08
Total votes9,641 100.0
Democratic hold

District 122

122nd District General Election
PartyCandidateVotes%
Democratic Shedron Williams 7,509 80.70
Write-in 179619.30
Total votes9,305 100.0
Democratic hold

District 123

123rd District General Election
PartyCandidateVotes%
Republican Jeff Bradley (incumbent) 10,781 61.98
Democratic Mario Martinez6,59437.91
Write-in 190.11
Total votes17,394 100.0
Republican hold

District 124

124th District General Election
PartyCandidateVotes%
Republican Shannon Erickson (incumbent) 10,401 97.43
Write-in 2742.57
Total votes10,675 100.0
Republican hold

    See also

    Related Research Articles

    <span class="mw-page-title-main">2020 United States Senate elections</span>

    The 2020 United States Senate elections were held on November 3, 2020, with the 33 class 2 seats of the Senate contested in regular elections. Of these, 21 were held by Republicans, and 12 by Democrats. The winners were elected to 6-year terms from January 3, 2021, to January 3, 2027. Two special elections for seats held by Republicans were also held in conjunction with the general elections: one in Arizona, to fill the vacancy created by John McCain's death in 2018; and one in Georgia, following Johnny Isakson's resignation in 2019. These elections ran concurrently with the 2020 United States presidential election in which incumbent president Donald Trump lost to Democratic nominee Joe Biden.

    <span class="mw-page-title-main">2018 South Carolina elections</span>

    A general election was held in the U.S. state of South Carolina on November 6, 2018. All of South Carolina's executive officers were up for election as well as all of South Carolina's seven seats in the United States House of Representatives.

    <span class="mw-page-title-main">2018 Georgia State Senate election</span>

    The 2018 Georgia State Senate elections took place as part of the biennial United States elections. Georgia voters elected state senators in all 56 of the state senate's districts. State senators serve two-year terms in the Georgia State Senate.

    <span class="mw-page-title-main">2018 Maine House of Representatives election</span>

    The 2018 Maine House of Representatives elections took place as part of the biennial United States elections. Maine voters elected state representatives in all 151 of the state house's districts, as well as non-voting members from the Passamaquoddy Tribe and the Houlton Band of Maliseet Indians. State representatives serve two-year terms in the Maine State House.

    <span class="mw-page-title-main">2018 Texas House of Representatives election</span>

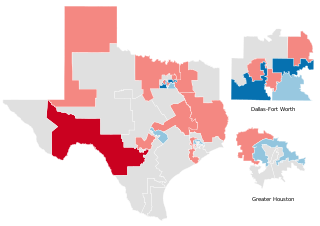
    The 2018 Texas House of Representatives elections took place as part of the biennial United States elections. Texas voters elected state representatives in all 150 of the state house's districts. The winners of this election served in the 86th Texas Legislature. State representatives serve two-year terms in the Texas State House. A statewide map of Texas' state House districts can be obtained from the Texas Legislative Council here, and individual district maps can be obtained from the U.S. Census here.

    <span class="mw-page-title-main">2018 Texas Senate election</span>

    The 2018 Texas Senate elections took place as part of the biennial United States elections. Texas voters elected state senators in 15 of the state senate's 31 districts. The winners of this election served in the 86th Texas Legislature. State senators serve four-year terms in the Texas State Senate. A statewide map of Texas's state Senate districts can be obtained from the Texas Legislative Council here, and individual district maps can be obtained from the U.S. Census here.

    <span class="mw-page-title-main">2018 Hawaii Senate election</span>

    The 2018 Hawaii Senate elections took place as part of the biennial United States elections. Hawaii voters elected state senators in 13 of the state senate's 25 districts. State senators serve four-year terms in the Hawaii Senate.

    <span class="mw-page-title-main">2018 Hawaii House of Representatives election</span>

    The 2018 Hawaii House of Representatives elections took place as part of the biennial United States elections. Hawaii voters elected state representatives in all 51 state house districts. State representatives serve two-year terms in the Hawaii House of Representatives.

    <span class="mw-page-title-main">2018 Maine Senate election</span> US state election

    The 2018 Maine State Senate elections took place as part of the biennial United States elections. Maine voters elected state senators in all 35 of the state senate's districts. State senators serve two-year terms in the State Senate.

    <span class="mw-page-title-main">2018 Georgia House of Representatives election</span>

    The 2018 Georgia House of Representatives elections took place as part of the biennial United States elections. Georgia voters elected state representatives in all 180 of the state house's districts. State representatives serve two-year terms in the Georgia House of Representatives.

    <span class="mw-page-title-main">2018 Colorado House of Representatives election</span>

    The 2018 Colorado House of Representatives elections took place as part of the biennial United States elections. Colorado voters elected state representatives in all 65 of the state house's districts. State representatives serve two-year terms in the Colorado House of Representatives. The Colorado Reapportionment Commission provides a statewide map of the state House here, and individual district maps are available from the U.S. Census here.

    <span class="mw-page-title-main">2018 Colorado Senate election</span>

    The 2018 Colorado State Senate elections took place as part of the biennial United States elections. Colorado voters elected state senators in 17 of the 35 districts in the state senate. State senators serve four-year terms in the Colorado State Senate. The Colorado Reapportionment Commission provides a statewide map of the state Senate here, and individual district maps are available from the U.S. Census here.

    <span class="mw-page-title-main">2018 Alabama Senate election</span> Elections in Alabama, USA

    The 2018 Alabama Senate elections took place on November 3, 2018, as part of the 2018 United States elections. Alabama voters elected state senators in all 35 of the state's Senate districts. State senators serve four-year terms in the Alabama Senate.

    <span class="mw-page-title-main">2020 United States House of Representatives elections in South Carolina</span>

    The 2020 United States House of Representatives elections in South Carolina were held on November 3, 2020, to elect the seven U.S. representatives from the state of South Carolina, one from each of the state's seven congressional districts. The elections coincided with the 2020 U.S. presidential election, as well as other elections to the House of Representatives, elections to the United States Senate and various state and local elections.

    <span class="mw-page-title-main">2004 Iowa Senate election</span>

    The 2004 Iowa State Senate elections took place as part of the biennial 2004 United States elections. Iowa voters elected state senators in half of the state senate's districts—the 25 even-numbered state senate districts. State senators serve four-year terms in the Iowa State Senate, with half of the seats up for election each cycle.

    <span class="mw-page-title-main">1992 Iowa Senate election</span>

    The 1992 Iowa State Senate elections took place as part of the biennial 1992 United States elections. Iowa voters elected state senators in 32 of the state senate's 50 districts—all 25 of the even-numbered seats were up for regularly-scheduled elections and, due to the oddities of redistricting following the 1990 Census, seven of the odd-numbered seats were up as well. State senators serve four-year terms in the Iowa State Senate, with half of the seats traditionally up for election each cycle.

    <span class="mw-page-title-main">1972 Iowa Senate election</span>

    The 1972 Iowa State Senate elections took place as part of the biennial 1972 United States elections. Iowa voters elected state senators in all of the state senate's 50 districts—the 25 even-numbered seats were up for regularly-scheduled four-year terms and, due to the oddities of redistricting following the 1970 Census, the 25 odd-numbered seats were up for shortened two-year terms. State senators typically serve four-year terms in the Iowa State Senate, with half of the seats traditionally up for election each cycle. The decennial census and redistricting process disrupts one cycle each decade.

    <span class="mw-page-title-main">2020 United States state legislative elections</span> 2020 U.S. stage legislative elections

    The 2020 United States state legislative elections were held on November 3, 2020, for 86 state legislative chambers in 44 states. Across the fifty states, approximately 65 percent of all upper house seats and 85 percent of all lower house seats were up for election. Nine legislative chambers in the five permanently-inhabited U.S. territories and the federal district of Washington, D.C. also held elections. The elections took place concurrently with several other federal, state, and local elections, including the presidential election, U.S. Senate elections, U.S. House elections, and gubernatorial elections.

    <span class="mw-page-title-main">2022 United States state legislative elections</span>

    The 2022 United States state legislative elections were held on November 8, 2022, for 88 state legislative chambers in 46 states. Across the fifty states, approximately 56 percent of all upper house seats and 92 percent of all lower house seats were up for election. Additionally, six territorial chambers were up in four territories and the District of Columbia. These midterm elections coincided with other state and local elections, including gubernatorial elections in multiple states.

    <span class="mw-page-title-main">2016 South Carolina House of Representatives election</span> Election

    The 2016 South Carolina House of Representatives elections took place as part of the biennial United States elections. South Carolina voters elected state representatives in all 124 of the state house's districts. State representatives serve two-year terms in the South Carolina State House. A statewide map of South Carolina's state House districts can be obtained from the South Carolina House's website here, and individual district maps can be obtained from the U.S. Census here.

    References

    1. 1 2 "Official Results". South Carolina Secretary of State . Retrieved February 22, 2019.
    2. "South Carolina House of Representatives elections, 2018". Ballotpedia . Retrieved February 22, 2019.
    3. "South Carolina House of Representatives elections, 2018". Ballotpedia . Retrieved February 22, 2019.
    4. "Official Results". South Carolina Secretary of State . Retrieved February 22, 2019.