| |||||||||||||||||||||||||
All 13 North Carolina seats to the United States House of Representatives | |||||||||||||||||||||||||
---|---|---|---|---|---|---|---|---|---|---|---|---|---|---|---|---|---|---|---|---|---|---|---|---|---|
Turnout | 52.97% | ||||||||||||||||||||||||
| |||||||||||||||||||||||||
|
Elections in North Carolina |
---|
The 2018 United States House of Representatives elections in North Carolina were held on November 6, 2018, electing the thirteen U.S. representatives from the State of North Carolina, one from each of the state's congressional districts. The elections coincided with other elections to the House of Representatives, as well as elections to the United States Senate and various state and local elections.
Primary elections in twelve of the thirteen districts were held on May 8, 2018.
Party | Candidates | Votes | Seats | ||||
---|---|---|---|---|---|---|---|
No. | % | No. | +/– | % | |||
Republican | 13 | 1,846,039 | 50.39% | 9 | 76.92% | ||
Democratic | 12 | 1,771,055 | 48.35% | 3 | 23.08% | ||
Libertarian | 5 | 38,728 | 1.06% | 0 | 0.00% | ||
Constitution | 1 | 4,665 | 0.13% | 0 | 0.00% | ||
Green | 1 | 2,831 | 0.08% | 0 | 0.00% | ||
Total | 32 | 3,663,326 | 100.00% | 12 | 100.00% |
Results of the 2018 United States House of Representatives elections in North Carolina by district: [1]
District | Republican | Democratic | Others | Total | Result | ||||
---|---|---|---|---|---|---|---|---|---|
Votes | % | Votes | % | Votes | % | Votes | % | ||
District 1 | 82,218 | 30.15% | 190,457 | 69.85% | 0 | 0.00% | 272,675 | 100.00% | Democratic Hold |
District 2 | 170,072 | 51.27% | 151,977 | 45.82% | 9,655 | 2.91% | 331,704 | 100.00% | Republican Hold |
District 3 | 187,901 | 100.00% | 0 | 0.00% | 0 | 0.00% | 187,901 | 100.00% | Republican Hold |
District 4 | 82,052 | 24.03% | 247,067 | 72.37% | 12,284 | 3.60% | 341,403 | 100.00% | Democratic Hold |
District 5 | 159,917 | 57.04% | 120,468 | 42.96% | 0 | 0.00% | 280,385 | 100.00% | Republican Hold |
District 6 | 160,709 | 56.52% | 123,651 | 43.48% | 0 | 0.00% | 284,360 | 100.00% | Republican Hold |
District 7 | 156,809 | 55.55% | 120,838 | 42.80% | 4,665 | 1.65% | 282,312 | 100.00% | Republican Hold |
District 8 | 141,402 | 55.35% | 114,119 | 44.65% | 0 | 0.00% | 255,521 | 100.00% | Republican Hold |
District 9 | Re-run Ordered [2] [3] | ||||||||
District 10 | 164,969 | 59.29% | 113,259 | 40.71% | 0 | 0.00% | 278,228 | 100.00% | Republican Hold |
District 11 | 178,012 | 59.21% | 116,508 | 38.75% | 6,146 | 2.04% | 300,666 | 100.00% | Republican Hold |
District 12 | 75,164 | 26.93% | 203,974 | 73.07% | 0 | 0.00% | 279,138 | 100.00% | Democratic Hold |
District 13 | 147,570 | 51.54% | 130,402 | 45.54% | 8,344 | 2.91% | 286,316 | 100.00% | Republican Hold |
Total | 1,846,041 | 50.39% | 1,771,061 | 48.35% | 46,224 | 1.26% | 3,663,326 | 100.00% |
| |||||||||||||||||
|
Incumbent Democrat G. K. Butterfield, who had represented the district since 2004, ran for re-election. He was re-elected with 69% of the vote in 2016. The district had a PVI of D+17.
Party | Candidate | Votes | % | |
---|---|---|---|---|
Democratic | G. K. Butterfield (incumbent) | 190,457 | 69.9 | |
Republican | Roger Allison | 82,218 | 30.1 | |
Total votes | 272,675 | 100.0 | ||
Democratic hold | ||||
| |||||||||||||||||
|
Incumbent Republican George Holding, who had represented the district since 2017, and had previously represented the 13th district between 2013 and 2017, ran for re-election. He was re-elected with 57% of the vote in 2016. The district had a PVI of R+7.
Party | Candidate | Votes | % | |
---|---|---|---|---|
Republican | George Holding (incumbent) | 17,979 | 76.2 | |
Republican | Allen Chesser II | 5,612 | 23.8 | |
Total votes | 23,591 | 100.0 |
The Democratic Congressional Campaign Committee included North Carolina's 2nd congressional district on its initial list of Republican-held seats considered targets in 2018. [11] [12]
Party | Candidate | Votes | % | |
---|---|---|---|---|
Democratic | Linda Coleman | 18,650 | 56.0 | |
Democratic | Ken Romley | 10,742 | 32.3 | |
Democratic | Wendy May | 3,895 | 11.7 | |
Total votes | 33,287 | 100.0 |
Poll source | Date(s) administered | Sample size | Margin of error | George Holding (R) | Linda Coleman (D) | Jeff Matemu (L) | Undecided |
---|---|---|---|---|---|---|---|
SurveyUSA | October 24–28, 2018 | 565 | ± 4.5% | 49% | 40% | 2% | 9% |
SurveyUSA | September 5–8, 2018 | 538 | ± 4.9% | 43% | 44% | 2% | 10% |
GQR Research (D-Coleman) | August 23–27, 2018 | 401 | ± 4.9% | 44% | 45% | 5% | 6% |
Source | Ranking | As of |
---|---|---|
The Cook Political Report [27] | Lean R | November 5, 2018 |
Inside Elections [28] | Lean R | November 5, 2018 |
Sabato's Crystal Ball [29] | Lean R | November 5, 2018 |
RCP [30] | Lean R | November 5, 2018 |
Daily Kos [31] | Lean R | November 5, 2018 |
538 [32] | Likely R | November 7, 2018 |
CNN [33] | Lean R | October 31, 2018 |
Politico [34] | Tossup | November 4, 2018 |
Party | Candidate | Votes | % | |
---|---|---|---|---|
Republican | George Holding (incumbent) | 170,072 | 51.3 | |
Democratic | Linda Coleman | 151,977 | 45.8 | |
Libertarian | Jeff Matemu | 9,655 | 2.9 | |
Total votes | 331,704 | 100.0 | ||
Republican hold | ||||
| |||||||||||||||||
|
Incumbent Republican Walter B. Jones Jr., who had represented the district since 1995, ran for re-election. He was re-elected with 67% of the vote in 2016. The district had a PVI of R+12.
Party | Candidate | Votes | % | |
---|---|---|---|---|
Republican | Walter B. Jones, Jr. (incumbent) | 20,963 | 43.0 | |
Republican | Phil Law | 14,343 | 29.4 | |
Republican | Scott Dacey | 13,421 | 27.5 | |
Total votes | 48,727 | 100.0 |
Party | Candidate | Votes | % | |
---|---|---|---|---|
Republican | Walter B. Jones, Jr. (incumbent) | 187,901 | 100.0 | |
Total votes | 187,901 | 100.0 | ||
Republican hold | ||||
| |||||||||||||||||
|
Incumbent Democrat David Price, who had represented the district since 1997, and previously between 1987 and 1995, ran for re-election. He was re-elected with 68% of the vote in 2016. [42] The district had a PVI of D+17.
Party | Candidate | Votes | % | |
---|---|---|---|---|
Democratic | David Price (incumbent) | 52,203 | 77.1 | |
Democratic | Michelle Laws | 11,120 | 16.4 | |
Democratic | Richard Lee Watkins III | 4,391 | 6.5 | |
Total votes | 67,714 | 100.0 |
Party | Candidate | Votes | % | |
---|---|---|---|---|
Libertarian | Barbara Howe | 528 | 76.9 | |
Libertarian | Scerry Perry Whitlock | 159 | 23.1 | |
Total votes | 687 | 100.0 |
Party | Candidate | Votes | % | |
---|---|---|---|---|
Democratic | David Price (incumbent) | 247,067 | 72.4 | |
Republican | Steve Loor | 82,052 | 24.0 | |
Libertarian | Barbara Howe | 12,284 | 3.6 | |
Total votes | 341,403 | 100.0 | ||
Democratic hold | ||||
| |||||||||||||||||
|
Incumbent Republican Virginia Foxx, who had represented the district since 2005, ran for re-election. She was re-elected with 58% of the vote in 2016. The district had a PVI of R+10.
Party | Candidate | Votes | % | |
---|---|---|---|---|
Republican | Virginia Foxx (incumbent) | 32,654 | 80.8 | |
Republican | Dillon Gentry | 5,703 | 14.1 | |
Republican | Cortland J. Meader | 2,063 | 5.1 | |
Total votes | 40,420 | 100.0 |
Party | Candidate | Votes | % | |
---|---|---|---|---|
Democratic | Denise D. Adams | 15,509 | 54.4 | |
Democratic | Jenny Marshall | 12,987 | 45.6 | |
Total votes | 28,496 | 100.0 |
Party | Candidate | Votes | % | |
---|---|---|---|---|
Republican | Virginia Foxx (incumbent) | 159,917 | 57.0 | |
Democratic | Denise D. Adams | 120,468 | 43.0 | |
Total votes | 280,385 | 100.0 | ||
Republican hold | ||||
| |||||||||||||||||
|
Incumbent Republican Mark Walker, who had represented the district since 2015, ran for re-election. He was re-elected with 59% of the vote in 2016. The district had a PVI of R+9.
Party | Candidate | Votes | % | |
---|---|---|---|---|
Democratic | Ryan Watts | 26,072 | 77.2 | |
Democratic | Gerald Wong | 7,719 | 22.8 | |
Total votes | 33,791 | 100.0 |
Source | Ranking | As of |
---|---|---|
The Cook Political Report [27] | Safe R | November 5, 2018 |
Inside Elections [28] | Safe R | November 5, 2018 |
Sabato's Crystal Ball [29] | Safe R | November 5, 2018 |
RCP [30] | Safe R | November 5, 2018 |
Daily Kos [31] | Safe R | November 5, 2018 |
538 [32] | Likely R | November 7, 2018 |
CNN [33] | Safe R | October 31, 2018 |
Politico [34] | Safe R | November 4, 2018 |
Party | Candidate | Votes | % | |
---|---|---|---|---|
Republican | Mark Walker (incumbent) | 160,709 | 56.5 | |
Democratic | Ryan Watts | 123,651 | 43.5 | |
Total votes | 284,360 | 100.0 | ||
Republican hold | ||||
| |||||||||||||||||
|
Incumbent Republican David Rouzer, who had represented the district since 2015, ran for re-election. He was re-elected with 61% of the vote in 2016. The district had a PVI of R+9.
Party | Candidate | Votes | % | |
---|---|---|---|---|
Democratic | Kyle Horton | 21,499 | 67.0 | |
Democratic | Grayson Parker | 10,587 | 33.0 | |
Total votes | 32,086 | 100.0 |
Poll source | Date(s) administered | Sample size | Margin of error | David Rouzer (R) | Kyle Horton (D) | Other | Undecided |
---|---|---|---|---|---|---|---|
Lincoln Park Strategies (D-Horton) | August 18–22, 2018 | 500 | ± 4.4% | 38% | 40% | 3% [66] | 19% |
Source | Ranking | As of |
---|---|---|
The Cook Political Report [27] | Safe R | November 5, 2018 |
Inside Elections [28] | Safe R | November 5, 2018 |
Sabato's Crystal Ball [29] | Safe R | November 5, 2018 |
RCP [30] | Safe R | November 5, 2018 |
Daily Kos [31] | Safe R | November 5, 2018 |
538 [32] | Likely R | November 7, 2018 |
CNN [33] | Safe R | October 31, 2018 |
Politico [34] | Safe R | November 4, 2018 |
Party | Candidate | Votes | % | |
---|---|---|---|---|
Republican | David Rouzer (incumbent) | 156,809 | 55.5 | |
Democratic | Kyle Horton | 120,838 | 42.8 | |
Constitution | David Fallin | 4,665 | 1.7 | |
Total votes | 282,312 | 100.0 | ||
Republican hold | ||||
| |||||||||||||||||
|
Incumbent Republican Richard Hudson, who had represented the district since 2013, ran for re-election. He was re-elected with 59% of the vote in 2016. The district had a PVI of R+8.
The Democratic Congressional Campaign Committee included North Carolina's 8th congressional district on its initial list of Republican-held seats considered targets in 2018.
Party | Candidate | Votes | % | |
---|---|---|---|---|
Democratic | Frank McNeill | 16,019 | 56.0 | |
Democratic | Scott Huffman | 6,581 | 23.0 | |
Democratic | Marc Tiegel | 5,997 | 21.0 | |
Total votes | 28,597 | 100.0 |
Source | Ranking | As of |
---|---|---|
The Cook Political Report [27] | Likely R | November 5, 2018 |
Inside Elections [28] | Safe R | November 5, 2018 |
Sabato's Crystal Ball [29] | Likely R | November 5, 2018 |
RCP [30] | Likely R | November 5, 2018 |
Daily Kos [31] | Safe R | November 5, 2018 |
538 [32] | Likely R | November 7, 2018 |
CNN [33] | Safe R | October 31, 2018 |
Politico [34] | Safe R | November 4, 2018 |
Party | Candidate | Votes | % | |
---|---|---|---|---|
Republican | Richard Hudson (incumbent) | 141,402 | 55.3 | |
Democratic | Frank McNeill | 114,119 | 44.7 | |
Total votes | 255,521 | 100.0 | ||
Republican hold | ||||
| ||||||||||||||||
| ||||||||||||||||
|
Incumbent Robert Pittenger, who had represented the district since 2013, ran for re-election. He was re-elected with 58% of the vote in 2016. The district had a PVI of R+8.
The results of the election were voided and the seat remained vacant until a special election was held in 2019.
The incumbent, Pittenger lost his party's nomination to Mark Harris.
Party | Candidate | Votes | % | |
---|---|---|---|---|
Republican | Mark Harris | 17,302 | 48.5 | |
Republican | Robert Pittenger (incumbent) | 16,474 | 46.2 | |
Republican | Clarence Goins | 1,867 | 5.2 | |
Total votes | 35,643 | 100.0 |
Party | Candidate | Votes | % | |
---|---|---|---|---|
Democratic | Dan McCready | 38,098 | 82.8 | |
Democratic | Christian Cano | 7,922 | 17.2 | |
Total votes | 46,020 | 100.0 |
Poll source | Date(s) administered | Sample size | Margin of error | Mark Harris (R) | Dan McCready (D) | Jeff Scott (L) | Undecided |
---|---|---|---|---|---|---|---|
NYT Upshot/Siena College | October 26–30, 2018 | 505 | ± 5.0% | 45% | 44% | 3% | 7% |
NYT Upshot/Siena College | October 1–5, 2018 | 502 | ± 4.9% | 47% | 42% | — | 11% |
SurveyUSA | October 2–4, 2018 | 556 | ± 4.7% | 41% | 45% | 3% | 12% |
SurveyUSA | July 5–8, 2018 | 600 | ± 4.6% | 36% | 43% | 3% | 19% |
ALG Research (D) | March 8—13, 2018 | 500 | ± 4.4% | 43% | 44% | — | 13% |
Poll source | Date(s) administered | Sample size | Margin of error | Robert Pittenger (R) | Dan McCready (D) | Undecided |
---|---|---|---|---|---|---|
Public Policy Polling (D) | April 16–17, 2018 | 662 | ±3.8% | 42% | 37% | 21% |
Source | Ranking | As of |
---|---|---|
The Cook Political Report [27] | Tossup | November 5, 2018 |
Inside Elections [28] | Tossup | November 5, 2018 |
Sabato's Crystal Ball [29] | Lean D (flip) | November 5, 2018 |
RCP [30] | Tossup | November 5, 2018 |
Daily Kos [31] | Tossup | November 5, 2018 |
538 [32] | Tossup | November 7, 2018 |
CNN [33] | Tossup | October 31, 2018 |
Politico [34] | Tossup | November 4, 2018 |
Party | Candidate | Votes | % | |
---|---|---|---|---|
Republican | Mark Harris | 139,246 | 49.25 | |
Democratic | Dan McCready | 138,341 | 48.93 | |
Libertarian | Jeff Scott | 5,130 | 1.81 | |
Total votes | 282,717 | 100.0 |
On November 27, 2018, the State Board of Elections declined to certify the election result in this congressional district, while certifying all the others, pending investigation of unspecified "potential wrongdoing". [88] An investigation was opened focusing on McCrae Dowless, a political operative who was hired by the Harris campaign for get-out-the-vote work, and allegations of irregularities involving the collection of absentee ballots. [89] [90] On December 28, 2018, incoming House Majority Leader Steny Hoyer stated House Democrats' official position of declining to seat Harris on January 3. [91] A new election was called.
| |||||||||||||||||
|
Incumbent Republican Patrick McHenry, who had represented the district since 2005, ran for re-election. He was re-elected with 63% of the vote in 2016. The district had a PVI of R+12.
Party | Candidate | Votes | % | |
---|---|---|---|---|
Republican | Patrick McHenry (incumbent) | 34,173 | 70.7 | |
Republican | Gina Collias | 6,664 | 13.8 | |
Republican | Jeff Gregory | 3,724 | 7.7 | |
Republican | Ira Roberts | 1,701 | 3.5 | |
Republican | Seth Blankenship | 1,443 | 3.0 | |
Republican | Albert Wiley, Jr. | 616 | 1.3 | |
Total votes | 48,321 | 100.0 |
Party | Candidate | Votes | % | |
---|---|---|---|---|
Republican | Patrick McHenry (incumbent) | 164,969 | 59.3 | |
Democratic | David Wilson Brown | 113,259 | 40.7 | |
Total votes | 278,228 | 100.0 | ||
Republican hold | ||||
| |||||||||||||||||
|
Incumbent Mark Meadows, who had represented the district since 2013, ran for re-election. He was re-elected with 64% of the vote in 2016. The district had a PVI of R+14.
Party | Candidate | Votes | % | |
---|---|---|---|---|
Republican | Mark Meadows (incumbent) | 35,665 | 86.4 | |
Republican | Chuck Archerd | 5,639 | 13.6 | |
Total votes | 41,304 | 100.0 |
Party | Candidate | Votes | % | |
---|---|---|---|---|
Democratic | Phillip Price | 13,499 | 40.6 | |
Democratic | Steve Woodsmall | 10,356 | 31.1 | |
Democratic | Scott Donaldson | 9,402 | 28.3 | |
Total votes | 33,257 | 100.0 |
Party | Candidate | Votes | % | |
---|---|---|---|---|
Republican | Mark Meadows (incumbent) | 178,012 | 59.2 | |
Democratic | Phillip Price | 116,508 | 38.8 | |
Libertarian | Clifton Ingram | 6,146 | 2.0 | |
Total votes | 300,666 | 100.0 | ||
Republican hold | ||||
| |||||||||||||||||
|
Incumbent Democrat Alma Adams, who had represented the district since 2014, ran for re-election. He was re-elected with 67% of the vote in 2016. The district had a PVI of D+18.
Party | Candidate | Votes | % | |
---|---|---|---|---|
Democratic | Alma Adams (incumbent) | 38,849 | 85.5 | |
Democratic | Keith Young | 2,549 | 5.6 | |
Democratic | Patrick Register | 2,074 | 4.6 | |
Democratic | Gabe Ortiz | 1,959 | 4.3 | |
Total votes | 45,431 | 100.0 |
Party | Candidate | Votes | % | |
---|---|---|---|---|
Republican | Paul Wright | 3,221 | 43.2 | |
Republican | Paul Bonham | 2,349 | 31.5 | |
Republican | Carl Persson | 1,885 | 25.3 | |
Total votes | 7,455 | 100.0 |
Party | Candidate | Votes | % | |
---|---|---|---|---|
Democratic | Alma Adams (incumbent) | 203,974 | 73.1 | |
Republican | Paul Wright | 75,164 | 26.9 | |
Total votes | 279,138 | 100.0 | ||
Democratic hold | ||||
| |||||||||||||||||
|
Incumbent Republican Ted Budd, who had represented the district since 2017, ran for re-election. He was elected with 56% of the vote in 2016. The district had a PVI of R+6.
Party | Candidate | Votes | % | |
---|---|---|---|---|
Democratic | Kathy Manning | 19,554 | 70.1 | |
Democratic | Adam Coker | 8,324 | 29.9 | |
Total votes | 27,878 | 100.0 |
Poll source | Date(s) administered | Sample size | Margin of error | Ted Budd (R) | Kathy Manning (D) | Other | Undecided |
---|---|---|---|---|---|---|---|
Change Research (D) | November 2–4, 2018 | 567 | – | 43% | 43% | 3% [120] | 12% |
SurveyUSA | October 9–12, 2018 | 533 | ± 5.2% | 44% | 41% | 2% [121] | 13% |
NYT Upshot/Siena College | October 3–8, 2018 | 500 | ± 4.9% | 47% | 41% | – | 12% |
DCCC (D) | September 13, 2018 | 537 | ± 4.2% | 42% | 46% | – | – |
SurveyUSA | July 12–16, 2018 | 537 | ± 4.7% | 40% | 35% | 6% [122] | 19% |
Public Policy Polling (D) | April 16–17, 2018 | 668 | ± 3.8% | 43% | 40% | – | 17% |
Source | Ranking | As of |
---|---|---|
The Cook Political Report [27] | Tossup | November 5, 2018 |
Inside Elections [28] | Tilt R | November 5, 2018 |
Sabato's Crystal Ball [29] | Lean R | November 5, 2018 |
RCP [30] | Lean R | November 5, 2018 |
Daily Kos [31] | Lean R | November 5, 2018 |
538 [32] | Lean R | November 7, 2018 |
CNN [33] | Lean R | October 31, 2018 |
Politico [34] | Lean R | November 4, 2018 |
Party | Candidate | Votes | % | |
---|---|---|---|---|
Republican | Ted Budd (incumbent) | 147,570 | 51.5 | |
Democratic | Kathy Manning | 130,402 | 45.6 | |
Libertarian | Tom Bailey | 5,513 | 1.9 | |
Green | Robert Corriher | 2,831 | 1.0 | |
Total votes | 286,316 | 100.0 | ||
Republican hold | ||||
The 2012 United States House of Representatives elections in Pennsylvania were held on Tuesday, November 6, 2012, to elect the 18 U.S. representatives from the state of Pennsylvania, a loss of one seat following the 2010 United States census. The elections coincided with the elections of other federal and state offices, including a quadrennial presidential election and an election to the U.S. Senate. Primary elections were held Tuesday, April 24.
The 2012 United States House of Representatives elections in New York were held on Tuesday, November 6, 2012 to elect the 27 U.S. representatives from the state, one from each of the state's 27 congressional districts, a loss of two seats following the 2010 United States census. The elections coincided with the elections of other federal and state offices, including a quadrennial presidential election, and a U.S. Senate election. The two existing districts that were eliminated were District 9, held by Republican Rep. Bob Turner, and District 22, held by retiring Democratic Rep. Maurice Hinchey.
The 2012 United States House of Representatives elections in California were held on November 6, 2012, with a primary election on June 5, 2012. Voters elected the 53 U.S. representatives from the state, one from each of the state's 53 congressional districts. The elections coincided with the elections of other federal and state offices, including a quadrennial presidential election and a U.S. Senate election.
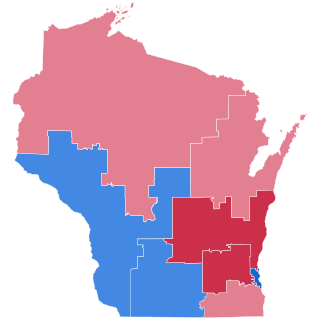
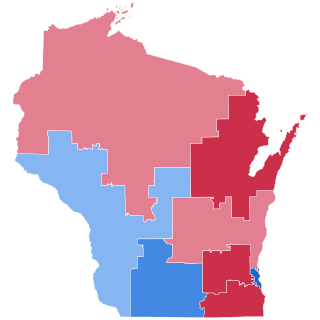
The 2012 United States House of Representatives elections in Wisconsin were held on Tuesday, November 6, 2012, to elect the eight U.S. representatives from Wisconsin, one from each of the state's eight congressional districts. Representatives are elected for two-year terms; those elected served in the 113th Congress from January 2013 until January 2015. The elections coincided with the elections of other federal and state offices, including a quadrennial presidential election and an election to the U.S. Senate. Primary elections were held on August 14, 2012.
The 2012 United States House of Representatives elections in North Carolina were held on Tuesday, November 6, 2012, to elect the 13 U.S. representatives from the state of North Carolina. The elections coincided with the U.S. presidential election, N.C. gubernatorial election, statewide judicial elections, Council of State elections and various local elections. Primary elections were held on May 8, 2012; for races in which no candidate received 40 percent of the vote in the primary, runoff elections were held on July 17.
The 2014 United States House of Representatives elections in North Carolina were held on Tuesday, November 4, 2014 to elect the 13 U.S. representatives from the state of North Carolina, one from each of the state's 13 congressional districts. The elections coincided with other elections to the United States Senate and House of Representatives and various state and local elections, including an election to the U.S. Senate.
The 2014 United States House of Representatives elections in New York were held on Tuesday, November 4, 2014, to elect the 27 U.S. representatives from the state of New York, one from each of the state's 27 congressional districts. The elections coincided with other elections to the United States Senate and House of Representatives and various state and local elections, including the governor, attorney general, and comptroller of New York.
The 2014 United States House of Representatives elections in Wisconsin were held on Tuesday, November 4, 2014, to elect the eight U.S. representatives from the state of Wisconsin, one from each of the state's eight congressional districts. The elections coincided with the elections of other federal and state offices, including an election for Governor of Wisconsin.
The 2016 United States House of Representatives elections in Texas were held on November 8, 2016, to elect the 36 U.S. representatives from the state of Texas, one from each of the state's 36 congressional districts. The elections coincided with the 2016 presidential election, as well as other elections to the House of Representatives, elections to the United States Senate and various state and local elections. The primaries were held on March 1.
The 2016 United States House of Representatives elections in North Carolina were held on November 8, 2016, to elect the 13 U.S. representatives from the state of North Carolina, one from each of the state's 13 congressional districts. The elections coincided with the 2016 U.S. presidential election, as well as other elections to the House of Representatives, elections to the United States Senate and various state and local elections.
The 2016 United States House of Representatives elections in California were held on Tuesday, November 8, 2016, with a primary election on June 7, 2016. Voters elected the 53 U.S. representatives from the state of California, one from each of the state's 53 congressional districts. The elections coincided with the elections of other offices, including a presidential election, as well as other elections to the House of Representatives, elections to the United States Senate and various state and local elections.
The 2018 United States House of Representatives elections in Arizona were held on November 6, 2018, to elect the nine U.S. representatives from the State of Arizona, one from each of the state's nine congressional districts. The elections coincided with the 2018 Arizona gubernatorial election, as well as other elections to the U.S. House of Representatives, elections to the United States Senate and various state and local elections. The 2018 general elections saw the Democratic party gain the 2nd congressional district, thus flipping the state from a 5–4 Republican advantage to a 5–4 Democratic advantage, the first time since the 2012 election in which Democrats held more House seats in Arizona than the Republicans.
The 2018 United States House of Representatives elections in Florida were held on Tuesday, November 6, 2018, to elect the 27 U.S. representatives from the state of Florida, one from each of the state's 27 congressional districts. The elections coincided with the elections of other offices, including a gubernatorial election, other elections to the House of Representatives, elections to the United States Senate, and various state and local elections. The party primaries were held on August 28, 2018.
The 2018 United States House of Representatives elections in Georgia were held on November 6, 2018, to elect the fourteen U.S. representatives from the state of Georgia, one from each of the state's fourteen congressional districts. The elections coincided with a gubernatorial election, as well as other elections to the House of Representatives, elections to the United States Senate, and various state and local elections. The primary elections took place on May 22, 2018.
The 2018 United States House of Representatives elections in Michigan were held on November 6, 2018, to elect the 14 U.S. representatives from the state of Michigan, one from each of the state's 14 congressional districts. The elections coincided with the elections of other offices, including a gubernatorial election, other elections to the House of Representatives, elections to the United States Senate, and various state and local elections. The filing deadline for candidates filing for the August 7 primary was April 24, 2018. Unless otherwise indicated, the Cook Political Report rated the congressional races as safe for the party of the incumbent.
The 2018 United States House of Representatives elections in Minnesota were held on November 6, 2018, to elect the eight U.S. representatives from the state of Minnesota, one from each of the state's eight congressional districts. The elections coincided with an open gubernatorial election, a U.S. Senate election, a special U.S. Senate election, State House elections, and other elections.
The 2018 United States House of Representatives elections in Texas were held on Tuesday, November 6, 2018. Voters elected the 36 U.S. representatives from the state of Texas, one from each of the state's 36 congressional districts. The elections coincided with the elections of other offices, including the gubernatorial election, as well as other elections to the House of Representatives, elections to the United States Senate and various state and local elections. The primaries were held on March 6 and the run-offs were held on May 22.
The 2020 United States House of Representatives elections in North Carolina were held on November 3, 2020, to elect the 13 U.S. representatives from the state of North Carolina, one from each of the state's 13 congressional districts. The elections coincided with the 2020 U.S. presidential election, as well as other elections to the House of Representatives, elections to the United States Senate and various state and local elections.
A special election was held on September 10, 2019, to fill the vacancy in North Carolina's 3rd congressional district in the United States House of Representatives for the remainder of the 116th United States Congress. Walter B. Jones Jr., the incumbent representative, died on February 10, 2019.
The 2022 United States House of Representatives elections in North Carolina were held on November 8, 2022, to elect U.S. representatives from the state of North Carolina, concurrent with nationwide elections to the House of Representatives and U.S. Senate, alongside legislative elections to the state house and senate. Primaries were held on May 17, 2022.