| |||||||||||||||||
| |||||||||||||||||
Burr: 40–50% 50–60% 60–70% 70–80% 80–90% >90% Ross: 40–50% 50–60% 60–70% 70–80% 80–90% >90% Tie: 40–50% | |||||||||||||||||
|
Elections in North Carolina |
---|
The 2016 United States Senate election in North Carolina was held November 8, 2016, to elect a member of the United States Senate to represent the State of North Carolina, concurrently with the 2016 U.S. presidential election, as well as other elections to the United States Senate in other states and elections to the United States House of Representatives and various state and local elections. Primary elections were held March 15. [1]
Incumbent Republican Senator Richard Burr won re-election to a third term in office against Democratic former state representative Deborah Ross and Libertarian Sean Haugh.
There had been speculation that Burr might retire, [2] but he said in September 2014 that he was "planning" on running [3] and reaffirmed this in January 2015. [4] If Burr had retired, the seat was expected to draw significant interest, with potential Republican candidates including U.S. representatives George Holding, Mark Meadows, and Robert Pittenger, Labor Commissioner Cherie Berry, Lieutenant Governor Dan Forest, Agriculture Commissioner Steve Troxler, State Senator Phil Berger, and former Ambassador to Denmark James P. Cain. [2] [3]
Poll source | Date(s) administered | Sample size | Margin of error | Richard Burr | Greg Brannon | Paul Wright | Larry Holmquist | Undecided |
---|---|---|---|---|---|---|---|---|
Public Policy Polling | March 11–13, 2016 | 749 | ±3.6% | 48% | 20% | 4% | 3% | 24% |
High Point University | March 9–10, 2016 | 734 | ±2.5% | 56% | 20% | 5% | 3% | 17% |
SurveyUSA | March 4–7, 2016 | 688 | ±3.8% | 45% | 17% | 7% | 4% | 27% |
SurveyUSA | February 14–16, 2016 | 437 | ±2.8% | 45% | 14% | 6% | 6% | 30% |
Public Policy Polling | February 14–16, 2016 | 597 | ±4.0% | 56% | 13% | 4% | 3% | 24% |
High Point University | January 30 – February 4, 2016 | 477 | ±4.5% | 46% | 10% | 5% | 2% | 37% |
Public Policy Polling | January 18–19, 2016 | 433 | ±3.2% | 55% | 10% | 6% | 5% | 24% |
Poll source | Date(s) administered | Sample size | Margin of error | Richard Burr | Mark Meadows | Undecided |
---|---|---|---|---|---|---|
Public Policy Polling | July 2–6, 2015 | 288 | ± 5.8% | 62% | 9% | 28% |
Party | Candidate | Votes | % | |
---|---|---|---|---|
Republican | Richard Burr (incumbent) | 622,074 | 61.41% | |
Republican | Greg Brannon | 255,030 | 25.17% | |
Republican | Paul Wright | 85,944 | 8.48% | |
Republican | Larry Holmquist | 50,010 | 4.94% | |
Total votes | 1,013,058 | 100.00% |
Poll source | Date(s) administered | Sample size | Margin of error | Kevin Griffin | Ernest Reeves | Chris Rey | Deborah Ross | Undecided |
---|---|---|---|---|---|---|---|---|
Public Policy Polling | March 11–13, 2016 | 746 | ±3.6% | 4% | 8% | 8% | 40% | 41% |
High Point University | March 9–10, 2016 | 669 | ±2.5% | 9% | 5% | 7% | 52% | 27% |
SurveyUSA | March 4–7, 2016 | 687 | ±3.8% | 7% | 6% | 9% | 34% | 44% |
SurveyUSA | February 14–16, 2016 | 449 | ±2.8% | 7% | 3% | 5% | 30% | 55% |
Public Policy Polling | February 14–16, 2016 | 575 | ±4.1% | 10% | 2% | 10% | 22% | 55% |
High Point University | January 30 – February 4, 2016 | 478 | ±4.5% | 6% | 4% | 5% | 19% | 66% |
Public Policy Polling | January 18–19, 2016 | 461 | ±3.2% | 14% | 3% | 10% | 19% | 55% |
Public Policy Polling | December 5–7, 2015 | 555 | ±2.8% | 15% | - | 5% | 41% | 39% |
Public Policy Polling | October 23–25, 2015 | 421 | ±4.8% | 16% | - | 6% | 33% | 45% |
Party | Candidate | Votes | % | |
---|---|---|---|---|
Democratic | Deborah Ross | 614,414 | 62.32% | |
Democratic | Chris Rey | 162,869 | 16.52% | |
Democratic | Kevin Griffin | 115,618 | 11.73% | |
Democratic | Ernest Reeves | 93,005 | 9.43% | |
Total votes | 985,906 | 100.00% |
Dates | Location | Burr | Ross | Link |
---|---|---|---|---|
October 13, 2016 | Chapel Hill, North Carolina | Participant | Participant | Full debate - C-SPAN |
Source | Ranking | As of |
---|---|---|
The Cook Political Report [74] | Tossup | November 2, 2016 |
Sabato's Crystal Ball [75] | Lean R | November 7, 2016 |
Rothenberg Political Report [76] | Tossup | November 3, 2016 |
Daily Kos [77] | Tossup | November 8, 2016 |
Real Clear Politics [78] | Tossup | November 7, 2016 |
Poll source | Date(s) administered | Sample size | Margin of error | Richard Burr (R) | Deborah Ross (D) | Sean Haugh (L) | Other | Undecided |
---|---|---|---|---|---|---|---|---|
SurveyMonkey | November 1–7, 2016 | 3,126 | ±4.6% | 43% | 47% | 6% | – | 4% |
New York Times Upshot/Siena College Archived January 16, 2018, at the Wayback Machine | November 4–6, 2016 | 800 | ±3.5% | 46% | 45% | – | – | 9% |
Quinnipiac University Archived November 7, 2016, at the Wayback Machine | November 3–6, 2016 | 870 | ±3.3% | 47% | 47% | – | 1% | 4% |
SurveyMonkey | October 31 – November 6, 2016 | 2,865 | ±4.6% | 44% | 47% | 6% | – | 3% |
Breitbart/Gravis Marketing | November 1–4, 2016 | 1,250 | ±2.8% | 47% | 48% | – | – | 5% |
SurveyMonkey | October 28 – November 3, 2016 | 2,292 | ±4.6% | 44% | 47% | 6% | – | 3% |
SurveyMonkey | October 27 – November 2, 2016 | 1,886 | ±4.6% | 44% | 47% | 6% | – | 3% |
Public Policy Polling | October 31 – November 1, 2016 | 1,169 | ±2.9% | 48% | 45% | – | – | 7% |
Quinnipiac University Archived November 4, 2016, at the Wayback Machine | October 27 – November 1, 2016 | 602 | ±4.0% | 45% | 49% | – | 1% | 5% |
SurveyMonkey | October 26 – November 1, 2016 | 1,617 | ±4.6% | 43% | 47% | 6% | – | 4% |
SurveyUSA | October 28–31, 2016 | 659 | ±3.9% | 49% | 43% | 2% | – | 6% |
SurveyMonkey | October 25–31, 2016 | 1,574 | ±4.6% | 43% | 47% | 7% | – | 3% |
CBS News/YouGov | October 26–28, 2016 | 992 | ±4.1% | 44% | 44% | – | 1% | 10% |
Emerson College | October 26–27, 2016 | 650 | ±3.8% | 48% | 44% | – | 3% | 6% |
Elon University Poll Archived November 3, 2016, at the Wayback Machine | October 23–27, 2016 | 710 | ±3.7% | 44% | 40% | 3% | – | 11% |
Breitbart/Gravis Marketing | October 25–26, 2016 | 1,273 | ±2.8% | 45% | 48% | – | – | 7% |
NBC/WSJ/Marist | October 25–26, 2016 | 780 LV | ±3.5% | 48% | 48% | – | 2% | 3% |
1,018 RV | ±3.1% | 48% | 46% | – | 2% | 4% | ||
Quinnipiac University Archived July 30, 2019, at the Wayback Machine | October 20–26, 2016 | 702 | ±3.7% | 48% | 47% | – | – | 5% |
New York Times Upshot/Siena College | October 20–23, 2016 | 792 | ±3.5% | 46% | 47% | – | – | 7% |
Monmouth University | October 20–23, 2016 | 402 | ±4.9% | 49% | 43% | 2% | – | 5% |
Public Policy Polling | October 21–22, 2016 | 875 | ±3.3% | 42% | 41% | 6% | – | 11% |
The Times-Picayune/Lucid Archived October 22, 2016, at the Wayback Machine | October 17–18, 2016 | 924 | ±3.0% | 46% | 44% | – | – | 10% |
SurveyUSA | October 14–18, 2016 | 651 | ±3.9% | 45% | 43% | 6% | – | 6% |
Civitas Institute (R) | October 14–17, 2016 | 600 | ±4.0% | 44% | 37% | 4% | – | 11% |
Washington Post/SurveyMonkey Archived October 19, 2016, at the Wayback Machine | October 8–16, 2016 | 1,191 | ±0.5% | 42% | 48% | – | 7% | 3% |
CNN/ORC | October 10–15, 2016 | 788 LV | ±3.5% | 48% | 47% | – | – | 2% |
929 RV | ±3.0% | 46% | 49% | – | 1% | 2% | ||
NBC/WSJ/Marist | October 10–12, 2016 | 743 LV | ±3.6% | 46% | 46% | – | 2% | 6% |
1,025 RV | ±3.1% | 45% | 46% | – | 2% | 7% | ||
Emerson College | October 10–12, 2016 | 600 | ±3.9% | 45% | 43% | – | 3% | 8% |
Suffolk University Archived October 22, 2016, at the Wayback Machine | October 10–12, 2016 | 500 | ±4.4% | 40% | 36% | 6% | – | 16% |
NCSU Pack Poll Archived October 18, 2016, at the Wayback Machine | October 3–6, 2016 | 895 | ±3.0% | 39% | 49% | 12% | – | 0% |
High Point University | October 1–6, 2016 | 479 | ±4.5% | 47% | 42% | 6% | – | 4% |
SurveyUSA | September 29 – October 3, 2016 | 656 | ±3.9% | 46% | 44% | 3% | – | 7% |
Bloomberg/Selzer | September 29 – October 3, 2016 | 805 | ±3.5% | 44% | 46% | – | – | 11% |
Quinnipiac University Archived October 6, 2016, at the Wayback Machine | September 27 – October 2, 2016 | 507 | ±4.4% | 46% | 46% | – | – | 7% |
Elon University Poll Archived October 5, 2016, at the Wayback Machine | September 27–30, 2016 | 660 | ±3.8% | 43% | 44% | 4% | – | 8% |
Public Policy Polling | September 27–28, 2016 | 861 | ±3.3% | 41% | 39% | 6% | – | 14% |
46% | 42% | – | – | 12% | ||||
Breitbart/Gravis Marketing | September 23, 2016 | 694 | ±3.7% | 39% | 48% | – | – | 13% |
Meredith College Archived September 30, 2016, at the Wayback Machine | September 18–22, 2016 | 487 | ±4.4% | 35% | 38% | 1% | 7% | 19% |
High Point University | September 17–22, 2016 | 404 | ±4.9% | 45% | 43% | 4% | – | 6% |
FOX News | September 18–20, 2016 | 734 LV | ±3.5% | 43% | 37% | 6% | – | 12% |
800 RV | 42% | 36% | 7% | – | 13% | |||
Public Policy Polling | September 18–20, 2016 | 1,024 | ±3.1% | 41% | 41% | 4% | – | 15% |
New York Times Upshot/Siena College | September 16–19, 2016 | 782 | ±3.6% | 42% | 46% | – | – | 11% |
Greenberg Quinlan Rosner - Democracy Corps Archived September 23, 2016, at the Wayback Machine | September 10–19, 2016 | 400 | ±4.0% | 46% | 30% | – | 3% | 21% |
Elon University Poll Archived September 19, 2016, at the Wayback Machine | September 12–16, 2016 | 644 | ±3.9% | 43% | 44% | 4% | – | 9% |
Civitas Institute (R) | September 11–12, 2016 | 600 | ±4.0% | 44% | 39% | 2% | – | 15% |
Suffolk University Archived September 8, 2016, at the Wayback Machine | September 5–7, 2016 | 500 | ±4.4% | 41% | 37% | 4% | – | 16% |
Quinnipiac University Archived September 15, 2016, at the Wayback Machine | August 29 – September 7, 2016 | 751 | ±3.6% | 49% | 43% | – | – | 8% |
CBS News/YouGov | August 30 – September 2, 2016 | 1,088 | ±4.0% | 40% | 41% | – | 2% | 17% |
Emerson College | August 27–29, 2016 | 800 | ±3.4% | 45% | 41% | – | 5% | 14% |
Public Policy Polling | August 26–27, 2016 | 1,177 | ±3.0% | 46% | 43% | – | – | 12% |
Monmouth University | August 20–23, 2016 | 401 | ±4.9% | 45% | 43% | 4% | – | 8% |
CNN/ORC | August 18–23, 2016 | 803 | ±3.5% | 50% | 45% | – | – | 5% |
NBC/WSJ/Marist | August 4–10, 2016 | 921 | ±3.2% | 44% | 46% | – | 1% | 9% |
Public Policy Polling | August 5–7, 2016 | 830 | ±3.4% | 41% | 37% | 5% | – | 17% |
NBC/WSJ/Marist | July 5–11, 2016 | 907 | ±3.3% | 48% | 41% | – | 1% | 10% |
Public Policy Polling | June 20–21, 2016 | 947 | ±3.2% | 40% | 37% | 5% | – | 18% |
Greenberg Quinlan Rosner - Democracy Corps Archived July 5, 2016, at the Wayback Machine | June 11–20, 2016 | 300 | ±5.7% | 36% | 38% | – | – | 26% |
Public Policy Polling | May 20–22, 2016 | 928 | ±3.2% | 39% | 36% | 8% | – | 18% |
Civitas Institute (R) | April 23–25, 2016 | 600 | ±4.0% | 39% | 38% | 7% | – | 16% |
Public Policy Polling | April 22–24, 2016 | 960 | ±3.2% | 40% | 36% | 7% | – | 17% |
Elon University Poll | April 10–15, 2016 | 621 | ±3.9% | 37% | 33% | – | – | 30% |
Public Policy Polling | March 18–20, 2016 | 843 | ±3.4% | 40% | 35% | 7% | – | 18% |
High Point University | March 9–10, 2016 | 1,576 | ±2.5% | 48% | 41% | – | – | 11% |
SurveyUSA | February 14–16, 2016 | 1,250 | ±2.8% | 45% | 37% | – | – | 18% |
Public Policy Polling | February 14–16, 2016 | 1,291 | ±2.7% | 43% | 37% | – | – | 20% |
Public Policy Polling | January 18–19, 2016 | 948 | ±3.2% | 43% | 33% | – | – | 23% |
Public Policy Polling | December 5–7, 2015 | 1,214 | ±2.8% | 46% | 35% | – | – | 19% |
Public Policy Polling | October 23–25, 2015 | 893 | ±3.3% | 43% | 39% | – | – | 18% |
Public Policy Polling | September 24–27, 2015 | 1,268 | ±2.8% | 45% | 34% | – | – | 21% |
Public Policy Polling | August 12–16, 2015 | 957 | ±3.2% | 43% | 36% | – | – | 21% |
This article's use of external links may not follow Wikipedia's policies or guidelines.(August 2016) |
Poll source | Date(s) administered | Sample size | Margin of error | Richard Burr (R) | Kevin Griffin (D) | Undecided |
---|---|---|---|---|---|---|
SurveyUSA | February 14–16, 2016 | 1,250 | ±2.8% | 45% | 35% | 20% |
Public Policy Polling | February 14–16, 2016 | 1,291 | ±2.7% | 43% | 36% | 21% |
Public Policy Polling | January 18–19, 2016 | 948 | ±3.2% | 42% | 35% | 24% |
Public Policy Polling | December 5–7, 2015 | 1,214 | ± 2.8% | 46% | 35% | 19% |
Public Policy Polling | October 23–25, 2015 | 893 | ± 3.3% | 44% | 35% | 21% |
Poll source | Date(s) administered | Sample size | Margin of error | Richard Burr (R) | Chris Rey (D) | Undecided |
---|---|---|---|---|---|---|
SurveyUSA | February 14–16, 2016 | 1,250 | ±2.8% | 46% | 34% | 20% |
Public Policy Polling | February 14–16, 2016 | 1,291 | ±2.7% | 43% | 36% | 21% |
Public Policy Polling | January 18–19, 2016 | 948 | ±3.2% | 44% | 32% | 24% |
Public Policy Polling | December 5–7, 2015 | 1,214 | ± 2.8% | 47% | 33% | 21% |
Public Policy Polling | October 23–25, 2015 | 893 | ± 3.3% | 45% | 34% | 21% |
Public Policy Polling | September 24–27, 2015 | 1,268 | ± 2.8% | 46% | 34% | 20% |
Public Policy Polling | August 12–16, 2015 | 957 | ± 3.2% | 44% | 37% | 20% |
Poll source | Date(s) administered | Sample size | Margin of error | Richard Burr (R) | Dan Blue (D) | Undecided |
---|---|---|---|---|---|---|
Public Policy Polling | July 2–6, 2015 | 529 | ± 4.1% | 45% | 35% | 19% |
Public Policy Polling | May 28–31, 2015 | 561 | ± 4.1% | 48% | 34% | 18% |
Public Policy Polling | April 2–5, 2015 | 751 | ± 3.6% | 47% | 36% | 17% |
Poll source | Date(s) administered | Sample size | Margin of error | Richard Burr (R) | Roy Cooper (D) | Undecided |
---|---|---|---|---|---|---|
Meeting Street Research Archived February 6, 2015, at the Wayback Machine | January 21–22, 2015 | 500 | ± 4.38% | 44% | 41% | 15% |
Poll source | Date(s) administered | Sample size | Margin of error | Richard Burr (R) | Janet Cowell (D) | Undecided |
---|---|---|---|---|---|---|
Public Policy Polling | April 2–5, 2015 | 751 | ± 3.6% | 46% | 35% | 19% |
Public Policy Polling | February 24–26, 2015 | 849 | ± 3.4% | 44% | 38% | 18% |
Public Policy Polling | January 29–31, 2015 | 845 | ± 3.4% | 45% | 38% | 18% |
Public Policy Polling | December 4–7, 2014 | 823 | ± 3.4% | 44% | 38% | 17% |
Public Policy Polling | August 14–17, 2014 | 856 | ± 3.4% | 44% | 37% | 19% |
Poll source | Date(s) administered | Sample size | Margin of error | Richard Burr (R) | Anthony Foxx (D) | Undecided |
---|---|---|---|---|---|---|
Public Policy Polling | February 24–26, 2015 | 849 | ± 3.4% | 45% | 36% | 20% |
Public Policy Polling | January 29–31, 2015 | 845 | ± 3.4% | 47% | 36% | 17% |
Public Policy Polling | December 4–7, 2014 | 823 | ± 3.4% | 44% | 38% | 18% |
Public Policy Polling | August 14–17, 2014 | 856 | ± 3.4% | 45% | 35% | 19% |
Poll source | Date(s) administered | Sample size | Margin of error | Richard Burr (R) | Kay Hagan (D) | Other | Undecided |
---|---|---|---|---|---|---|---|
Public Policy Polling | May 28–31, 2015 | 561 | ± 4.1% | 49% | 40% | — | 11% |
Elon University Poll Archived May 5, 2015, at the Wayback Machine | April 20–24, 2015 | 677 | ± 3.77% | 44% | 43% | 4% | 8% |
Public Policy Polling | April 2–5, 2015 | 751 | ± 3.6% | 50% | 38% | — | 12% |
Public Policy Polling | February 24–26, 2015 | 849 | ± 3.4% | 50% | 43% | — | 7% |
Meeting Street Research Archived February 6, 2015, at the Wayback Machine | January 21–22, 2015 | 500 | ± 4.38% | 49% | 45% | — | 6% |
Public Policy Polling | January 29–31, 2015 | 845 | ± 3.4% | 48% | 42% | — | 10% |
Public Policy Polling | December 4–7, 2014 | 823 | ± 3.4% | 46% | 43% | — | 11% |
Poll source | Date(s) administered | Sample size | Margin of error | Richard Burr (R) | Duane Hall (D) | Undecided |
---|---|---|---|---|---|---|
Public Policy Polling | September 24–27, 2015 | 1,268 | ± 2.8% | 45% | 35% | 19% |
Public Policy Polling | Aug 12-16, 2015 | 957 | ± 3.2% | 44% | 36% | 21% |
Poll source | Date(s) administered | Sample size | Margin of error | Richard Burr (R) | Jeff Jackson (D) | Undecided |
---|---|---|---|---|---|---|
Public Policy Polling | May 28–31, 2015 | 561 | ± 4.1% | 48% | 30% | 22% |
Public Policy Polling | April 2–5, 2015 | 751 | ± 3.6% | 46% | 30% | 24% |
Poll source | Date(s) administered | Sample size | Margin of error | Richard Burr (R) | Allen Joines (D) | Undecided |
---|---|---|---|---|---|---|
Public Policy Polling | February 24–26, 2015 | 849 | ± 3.4% | 45% | 33% | 23% |
Public Policy Polling | August 14–17, 2014 | 856 | ± 3.4% | 45% | 32% | 23% |
Poll source | Date(s) administered | Sample size | Margin of error | Richard Burr (R) | Grier Martin (D) | Undecided |
---|---|---|---|---|---|---|
Public Policy Polling | July 2–6, 2015 | 529 | ± 4.1% | 47% | 33% | 20% |
Public Policy Polling | May 28–31, 2015 | 561 | ± 4.1% | 46% | 31% | 23% |
Public Policy Polling | April 2–5, 2015 | 751 | ± 3.6% | 46% | 32% | 23% |
Public Policy Polling | August 14–17, 2014 | 856 | ± 3.4% | 45% | 33% | 22% |
Poll source | Date(s) administered | Sample size | Margin of error | Richard Burr (R) | Mike McIntyre (D) | Undecided |
---|---|---|---|---|---|---|
Public Policy Polling | July 2–6, 2015 | 529 | ± 4.1% | 44% | 35% | 21% |
Public Policy Polling | May 28–31, 2015 | 561 | ± 4.1% | 43% | 34% | 22% |
Public Policy Polling | January 29–31, 2015 | 845 | ± 3.4% | 44% | 37% | 19% |
Poll source | Date(s) administered | Sample size | Margin of error | Richard Burr (R) | Brad Miller (D) | Undecided |
---|---|---|---|---|---|---|
Public Policy Polling | July 2–6, 2015 | 529 | ± 4.1% | 46% | 36% | 18% |
Public Policy Polling | April 2–5, 2015 | 751 | ± 3.6% | 45% | 34% | 20% |
Poll source | Date(s) administered | Sample size | Margin of error | Richard Burr (R) | Tom Ross (D) | Undecided |
---|---|---|---|---|---|---|
Public Policy Polling | January 29–31, 2015 | 845 | ± 3.4% | 44% | 35% | 21% |
Poll source | Date(s) administered | Sample size | Margin of error | Richard Burr (R) | Heath Shuler (D) | Undecided |
---|---|---|---|---|---|---|
Public Policy Polling | September 24–27, 2015 | 1,268 | ± 2.8% | 42% | 37% | 20% |
Public Policy Polling | Aug 12-16, 2015 | 957 | ± 3.2% | 42% | 35% | 22% |
Public Policy Polling | July 2–6, 2015 | 529 | ± 4.1% | 44% | 36% | 20% |
Poll source | Date(s) administered | Sample size | Margin of error | Richard Burr (R) | Beth Wood (D) | Undecided |
---|---|---|---|---|---|---|
Public Policy Polling | July 2–6, 2015 | 529 | ± 4.1% | 45% | 34% | 21% |
Poll source | Date(s) administered | Sample size | Margin of error | Phil Berger (R) | Janet Cowell (D) | Undecided |
---|---|---|---|---|---|---|
Public Policy Polling | December 4–7, 2014 | 823 | ± 3.4% | 41% | 38% | 21% |
Poll source | Date(s) administered | Sample size | Margin of error | Phil Berger (R) | Anthony Foxx (D) | Undecided |
---|---|---|---|---|---|---|
Public Policy Polling | December 4–7, 2014 | 823 | ± 3.4% | 40% | 37% | 24% |
Poll source | Date(s) administered | Sample size | Margin of error | Phil Berger (R) | Kay Hagan (D) | Undecided |
---|---|---|---|---|---|---|
Public Policy Polling | December 4–7, 2014 | 823 | ± 3.4% | 45% | 43% | 13% |
Party | Candidate | Votes | % | ±% | |
---|---|---|---|---|---|
Republican | Richard Burr (incumbent) | 2,395,376 | 51.06% | −3.75% | |
Democratic | Deborah Ross | 2,128,165 | 45.37% | +2.32% | |
Libertarian | Sean Haugh | 167,592 | 3.57% | +1.48% | |
Total votes | 4,691,133 | 100.00% | N/A | ||
Republican hold | |||||
Deborah Ross is an American lawyer and politician who has served as the U.S. representative for North Carolina's 2nd congressional district since 2021. Her district is based in Raleigh. A member of the Democratic Party, Ross served as a member of the North Carolina House of Representatives from 2003 to 2013, representing the state's 38th and then 34th House district, including much of northern Raleigh and surrounding suburbs in Wake County.
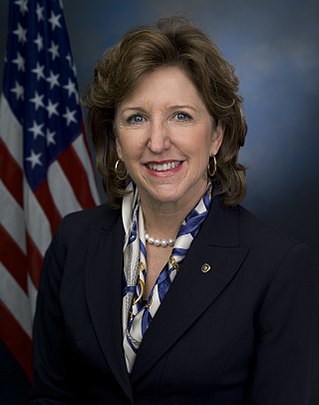
Janet Kay Hagan was an American lawyer, banking executive, and politician who served as a United States Senator from North Carolina from 2009 to 2015. A member of the Democratic Party, she previously served in the North Carolina Senate from 1999 to 2009. By defeating Republican Elizabeth Dole in the 2008 election, she became the first woman to defeat an incumbent woman in a U.S. Senate election. She ran for reelection in 2014 but lost to Republican Thom Tillis, Speaker of the North Carolina House of Representatives, in a close race.
Richard Mauze Burr is an American businessman and politician who served as a United States senator from North Carolina from 2005 to 2023. A member of the Republican Party, Burr was previously a member of the United States House of Representatives.
The 2010 United States Senate election in North Carolina was held on November 2, 2010. The filing deadline for the primaries was February 26; the primaries were held on May 4, with a Democratic primary runoff held on June 22. Incumbent Republican U.S. Senator Richard Burr won re-election to a second term. Burr is the first incumbent to win re-election for this seat since Sam Ervin's last re-election in 1968.
The 2016 United States Senate elections were held on November 8, 2016. The presidential election, House elections, 14 gubernatorial elections, and many state and local elections were held concurrently.
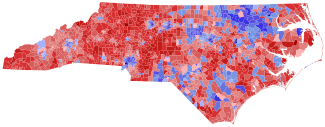
The 2014 United States Senate election in North Carolina took place on November 4, 2014, to elect a member of the United States Senate to represent the state of North Carolina, concurrently with other elections to the United States Senate in other states and elections to the United States House of Representatives and various state and local elections. The primary took place on May 6, 2014.
The 2016 United States Senate election in New Hampshire was held November 8, 2016, to elect a member of the United States Senate to represent the State of New Hampshire, concurrently with the 2016 U.S. presidential election, as well as other elections to the United States Senate in other states and elections to the United States House of Representatives and various state and local elections. The primary election to select the candidates who appeared on the general election ballot took place on September 13, 2016.
The 2014 United States House of Representatives elections in North Carolina were held on Tuesday, November 4, 2014 to elect the 13 U.S. representatives from the state of North Carolina, one from each of the state's 13 congressional districts. The elections coincided with other elections to the United States Senate and House of Representatives and various state and local elections, including an election to the U.S. Senate.
The 2016 United States Senate election in Nevada was held November 8, 2016 to elect a member of the United States Senate to represent the State of Nevada, concurrently with the 2016 U.S. presidential election, as well as other elections to the United States Senate in other states and elections to the United States House of Representatives and various state and local elections. The state primary election was held June 14, 2016.
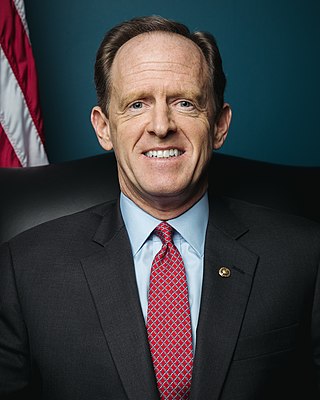
The 2016 United States Senate election in Pennsylvania took place on November 8, 2016, to elect a member of the United States Senate to represent the Commonwealth of Pennsylvania, concurrently with the 2016 U.S. presidential election, as well as other elections to the United States Senate in numerous other states and elections to the United States House of Representatives and various state and local elections. The primaries were held on April 26. Incumbent Republican U.S. Senator Pat Toomey was reelected to a second term in a close race, defeating Democratic nominee Katie McGinty and Libertarian Party nominee Edward Clifford. With a margin of 1.43%, this election was the second-closest race of the 2016 Senate election cycle, behind only the election in New Hampshire.
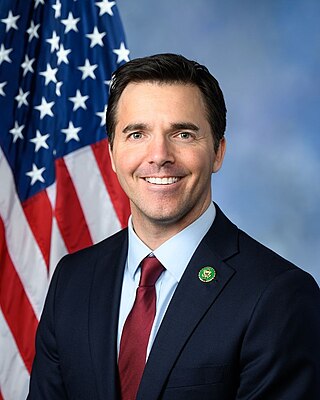
Jeffrey Neale Jackson is an American politician, attorney, and military officer serving as the U.S. representative for North Carolina's 14th congressional district since 2023. A member of the Democratic Party, he represented the 37th district in the North Carolina Senate from 2014 to 2022.
The 2016 North Carolina election was held on November 8, 2016, to elect the Attorney General of North Carolina, concurrently with the 2016 U.S. presidential election, as well as elections to the United States Senate and elections to the United States House of Representatives and various state and local elections.
The 2016 United States House of Representatives elections in North Carolina were held on November 8, 2016, to elect the 13 U.S. representatives from the state of North Carolina, one from each of the state's 13 congressional districts. The elections coincided with the 2016 U.S. presidential election, as well as other elections to the House of Representatives, elections to the United States Senate and various state and local elections.
The 2020 United States Senate election in North Carolina was held on November 3, 2020, to elect a member of the United States Senate to represent the State of North Carolina, concurrently with the 2020 United States presidential election as well as other elections to the United States Senate in other states and elections to the United States House of Representatives and various state and local elections. North Carolina was one of just five states holding presidential, gubernatorial, and senatorial elections concurrently in 2020. On March 3, 2020, Republican incumbent Thom Tillis and Democratic former state senator Cal Cunningham won their respective primaries.
The 2020 North Carolina lieutenant gubernatorial election took place on November 3, 2020, to elect the Lieutenant Governor of North Carolina, concurrently with the 2020 U.S. presidential election, as well as elections to the United States Senate and elections to the United States House of Representatives and various state and local elections. Primary elections were held on March 3, 2020.
The 2020 United States House of Representatives elections in North Carolina were held on November 3, 2020, to elect the 13 U.S. representatives from the state of North Carolina, one from each of the state's 13 congressional districts. The elections coincided with the 2020 U.S. presidential election, as well as other elections to the House of Representatives, elections to the United States Senate and various state and local elections.
The 2022 United States Senate election in North Carolina was held on November 8, 2022 to elect a member of the United States Senate to represent the State of North Carolina. Primary elections were scheduled for March 8, 2022, but were delayed by the North Carolina Supreme Court and rescheduled for May 17.
The 2022 United States House of Representatives elections in North Carolina were held on November 8, 2022, to elect U.S. representatives from the state of North Carolina, concurrent with nationwide elections to the House of Representatives and U.S. Senate, alongside legislative elections to the state house and senate. Primaries were held on May 17, 2022.
The 2024 North Carolina gubernatorial election will be held on November 5, 2024, to elect the Governor of North Carolina, concurrently with the 2024 U.S. presidential election, as well as elections to the United States Senate, elections to the United States House of Representatives, and various other state and local elections. Incumbent governor Roy Cooper is term-limited and cannot seek re-election to a third consecutive term in office. This is the only Democratic-held governorship up for election in 2024 in a state Donald Trump won in 2020. Primary elections will take place on March 5, 2024.
The 2024 United States House of Representatives elections in North Carolina will be held on November 5, 2024, to elect the fourteen U.S. representatives from the State of North Carolina, one from all fourteen of the state's congressional districts. The elections will coincide with the 2024 U.S. presidential election, as well as other elections to the House of Representatives, elections to the United States Senate, and various state and local elections.
{{cite web}}
: CS1 maint: unfit URL (link)