2000 United States presidential election in North Carolina

Last updated

2000 United States presidential election in North Carolina
Flag of North Carolina.svg
  1996 November 7, 2000 2004  
  Official Portrait- President George Walker Bush, 43rd President of the United States, Republican - DPLA - 7482eac0e113bf03014d1686a3733f97.jpeg Al Gore, Vice President of the United States, official portrait 1994.jpg
Nominee George W. Bush Al Gore
Party Republican Democratic
Home state Texas Tennessee
Running mate Dick Cheney Joe Lieberman
Electoral vote140
Popular vote1,631,1631,257,692
Percentage56.03%43.20%

North Carolina Presidential Election Results 2000.svg
2000 United States presidential election in North Carolina results map by congressional district.svg

President before election

Bill Clinton
Democratic

Elected President

George W. Bush
Republican

The 2000 United States presidential election in North Carolina took place on November 7, 2000, and was part of the 2000 United States presidential election. Voters chose 14 representatives, or electors, to the Electoral College, who voted for president and vice president.

Contents

North Carolina was won by Governor George W. Bush with a 12.83% margin of victory. Bush won most of the counties and congressional districts of the state. He won nine of the twelve districts, and also won the most populated counties including Forsyth County (home to Winston-Salem) with 56%, Wake County (home to the state's capital, Raleigh) with 53%, Guilford County (home to Greensboro) with 51%, and Mecklenburg County (home to the state's largest city, Charlotte) with 51% of the vote. [1] As of the 2020 presidential election , this is the last election in which Guilford County and Mecklenburg County voted for a Republican presidential candidate and the last election in which Columbus County, Chowan County, and Tyrrell County voted for a Democratic presidential candidate. [2]

Results

2000 United States presidential election in North Carolina
PartyCandidateVotesPercentageElectoral votes
Republican George W. Bush 1,631,16356.03%14
Democratic Al Gore 1,257,69243.20%0
Libertarian Harry Browne 12,3070.42%0
Reform Patrick Buchanan 8,8740.30%0
Write-In David McReynolds 1,2260.04%0
Totals2,911,262100.00%14
Voter turnout (Voting age/registered)48%/57%

Results by county

County [3] George W. Bush
Republican
Al Gore
Democratic
Harry Browne
Libertarian
Pat Buchanan
Reform
David McReynolds
Write-in
MarginTotal
#%#%#%#%#%#%
Alamance 29,30562.23%17,45937.08%1570.33%1700.36%00.00%11,84625.15%47,091
Alexander 9,24268.50%4,16630.88%360.27%430.32%50.04%5,07637.62%13,492
Alleghany 2,53158.68%1,71539.76%160.37%511.18%00.00%81618.92%4,313
Anson 3,16139.59%4,79260.01%140.18%180.23%00.00%-1,631-20.42%7,985
Ashe 6,22660.35%4,01138.88%420.41%370.36%00.00%2,21521.47%10,316
Avery 4,95674.04%1,68625.19%240.36%280.42%00.00%3,27048.85%6,694
Beaufort 10,53160.83%6,63438.32%630.36%400.23%450.26%3,89722.51%17,313
Bertie 2,48834.67%4,66064.94%110.15%170.24%00.00%-2,172-30.27%7,176
Bladen 4,97745.63%5,88953.99%180.17%240.22%00.00%-912-8.36%10,908
Brunswick 15,42753.49%13,11845.49%1360.47%1580.55%00.00%2,3098.00%28,839
Buncombe 46,10153.93%38,54545.09%4710.55%3590.42%00.00%7,5568.84%85,476
Burke 18,46660.23%11,92438.89%1250.41%1430.47%00.00%6,54221.34%30,658
Cabarrus 32,70466.23%16,28432.98%2420.49%1510.31%00.00%16,42033.25%49,381
Caldwell 17,33766.39%8,58832.89%950.36%950.36%00.00%8,74933.50%26,115
Camden 1,62857.51%1,18741.93%90.32%70.25%00.00%44115.58%2,831
Carteret 17,38165.69%8,83933.40%1060.40%1320.50%30.01%8,54232.29%26,461
Caswell 4,27050.70%4,09148.58%260.31%350.42%00.00%1792.12%8,422
Catawba 34,24467.36%16,24631.95%2090.41%1410.28%10.00%17,99835.41%50,841
Chatham 10,24848.96%10,46149.98%1480.71%580.28%160.08%-213-1.02%20,931
Cherokee 6,30565.17%3,23933.48%520.54%780.81%00.00%3,06631.69%9,674
Chowan 2,41549.39%2,43049.69%280.57%170.35%00.00%-15-0.30%4,890
Clay 2,41662.72%1,36135.33%300.78%250.65%200.52%1,05527.39%3,852
Cleveland 19,06458.22%13,45541.09%1090.33%1040.32%140.04%5,60917.13%32,746
Columbus 8,34245.28%9,98654.20%480.26%490.27%00.00%-1,644-8.92%18,425
Craven 19,49460.95%12,21338.18%1130.35%1650.52%00.00%7,28122.77%31,985
Cumberland 38,12949.42%38,62650.07%2370.31%1590.21%00.00%-497-0.65%77,151
Currituck 4,09560.77%2,59538.51%310.46%180.27%00.00%1,50022.26%6,739
Dare 7,30156.15%5,58942.99%790.61%330.25%00.00%1,71213.16%13,002
Davidson 35,38767.99%16,19931.12%1730.33%2880.55%00.00%19,18836.87%52,047
Davie 10,18472.75%3,65126.08%670.48%960.69%00.00%6,53346.67%13,998
Duplin 7,84054.48%6,47545.00%360.25%320.22%70.05%1,3659.48%14,390
Durham 30,15035.64%53,90763.72%4330.51%1030.12%110.01%-23,757-28.08%84,604
Edgecombe 6,83637.56%11,31562.16%300.16%210.12%00.00%-4,479-24.60%18,202
Forsyth 67,70055.98%52,45743.37%4420.37%3430.28%00.00%15,24312.61%120,942
Franklin 8,50152.96%7,45446.44%620.39%340.21%00.00%1,0476.52%16,051
Gaston 39,45366.67%19,28132.58%2530.43%1920.32%00.00%20,17234.09%59,179
Gates 1,48042.95%1,94456.41%50.15%70.20%100.29%-464-13.46%3,446
Graham 2,30468.55%1,00629.93%210.62%260.77%40.12%1,29838.62%3,361
Granville 7,36448.47%7,73350.90%700.46%270.18%00.00%-369-2.43%15,194
Greene 3,35357.12%2,47842.21%80.14%300.51%10.02%87514.91%5,870
Guilford 84,39450.76%80,78748.59%5690.34%4850.29%290.02%3,6072.17%166,264
Halifax 6,69839.47%10,22260.24%250.15%250.15%00.00%-3,524-20.77%16,970
Harnett 14,76261.08%9,15537.88%720.30%740.31%1040.43%5,60723.20%24,167
Haywood 12,11854.41%9,79343.97%1070.48%1040.47%1510.68%2,32510.44%22,273
Henderson 25,68866.54%12,56232.54%1830.47%1740.45%00.00%13,12634.00%38,607
Hertford 2,38230.16%5,48469.44%170.22%140.18%00.00%-3,102-39.28%7,897
Hoke 3,43940.07%5,01758.46%911.06%350.41%00.00%-1,578-18.39%8,582
Hyde 1,13250.60%1,08848.64%100.45%70.31%00.00%441.96%2,237
Iredell 29,85365.49%15,43433.86%1630.36%1360.30%00.00%14,41931.63%45,586
Jackson 6,23751.46%5,72247.21%880.73%740.61%00.00%5154.25%12,121
Johnston 27,21266.12%13,70433.30%1570.38%820.20%00.00%13,50832.82%41,155
Jones 2,11453.33%1,82245.96%130.33%150.38%00.00%2927.37%3,964
Lee 9,40657.77%6,78541.67%510.31%410.25%00.00%2,62116.10%16,283
Lenoir 11,51254.40%9,52745.02%430.20%530.25%280.13%1,9859.38%21,163
Lincoln 15,95165.03%8,41234.29%900.37%760.31%00.00%7,53930.74%24,529
Macon 8,40663.52%4,68335.39%730.55%720.54%00.00%3,72328.13%13,234
Madison 4,67656.17%3,50542.10%400.48%550.66%490.59%1,17114.07%8,325
Martin 4,42047.19%4,92952.63%40.04%130.14%00.00%-509-5.44%9,366
McDowell 9,10965.01%4,74733.88%390.28%570.41%590.42%4,36231.13%14,011
Mecklenburg 134,06850.97%126,91148.25%1,2910.49%4870.19%2790.11%7,1572.72%263,036
Mitchell 4,98475.52%1,53523.26%260.39%550.83%00.00%3,44952.26%6,600
Montgomery 4,94655.11%3,97944.34%190.21%200.22%100.11%96710.77%8,974
Moore 19,88263.52%11,23235.88%1060.34%810.26%00.00%8,65027.64%31,301
Nash 17,99558.97%12,37640.56%730.24%690.23%00.00%5,61918.41%30,513
New Hanover 36,50355.04%29,29244.17%3770.57%1470.22%00.00%7,21110.87%66,319
Northampton 2,66732.52%5,51367.23%90.11%110.13%00.00%-2,846-34.71%8,200
Onslow 19,65765.06%10,26933.99%1670.55%1220.40%00.00%9,38831.07%30,215
Orange 17,93036.34%30,92162.66%3920.79%750.15%260.05%-12,991-26.32%49,344
Pamlico 2,99957.21%2,18841.74%360.69%190.36%00.00%81115.47%5,242
Pasquotank 4,94345.34%5,87453.88%380.35%480.44%00.00%-931-8.54%10,903
Pender 7,66154.13%6,41545.32%370.26%410.29%00.00%1,2468.81%14,154
Perquimans 2,23051.79%2,03347.21%230.53%200.46%00.00%1974.58%4,306
Person 6,72256.81%5,04242.61%430.36%260.22%00.00%1,68014.20%11,833
Pitt 23,19253.84%19,68545.70%1150.27%810.19%20.00%3,5078.14%43,075
Polk 5,07461.11%3,11437.50%620.75%530.64%00.00%1,96023.61%8,303
Randolph 30,95972.51%11,36626.62%1490.35%2220.52%00.00%19,59345.89%42,696
Richmond 6,26343.89%7,93555.61%300.21%410.29%00.00%-1,672-11.72%14,269
Robeson 11,72139.40%17,83459.95%520.17%810.27%590.20%-6,113-20.55%29,747
Rockingham 18,97958.35%13,26040.76%750.23%1270.39%870.27%5,71917.59%32,528
Rowan 28,92265.53%14,89133.74%1460.33%1740.39%00.00%14,03131.79%44,133
Rutherford 13,75563.34%7,69735.44%930.43%1710.79%00.00%6,05827.90%21,716
Sampson 10,41054.11%8,76845.57%330.17%280.15%00.00%1,6428.54%19,239
Scotland 3,74039.77%5,62759.84%110.12%250.27%00.00%-1,887-20.07%9,403
Stanly 15,54868.14%7,06630.97%690.30%1350.59%00.00%8,48237.17%22,818
Stokes 12,02870.00%5,03029.27%560.33%680.40%00.00%6,99840.73%17,182
Surry 15,40165.93%7,75733.21%850.36%1150.49%00.00%7,64432.72%23,358
Swain 2,22450.89%2,09747.99%220.50%250.57%20.05%1272.90%4,370
Transylvania 9,01163.35%5,04435.46%910.64%790.56%00.00%3,96727.89%14,225
Tyrrell 70645.08%84954.21%50.32%60.38%00.00%-143-9.13%1,566
Union 31,87667.59%14,89031.57%2470.52%1460.31%20.00%16,98636.02%47,161
Vance 5,56443.81%7,09255.84%320.25%130.10%00.00%-1,528-12.03%12,701
Wake 142,49453.13%123,46646.03%1,7540.65%4970.19%90.00%19,0287.10%268,220
Warren 2,20232.41%4,57667.34%70.10%80.12%20.03%-2,374-34.93%6,795
Washington 2,16944.36%2,70455.30%70.14%100.20%00.00%-535-10.94%4,890
Watauga 10,43855.75%7,95942.51%1510.81%570.30%1180.63%2,47913.24%18,723
Wayne 20,75861.26%13,00538.38%650.19%560.17%00.00%7,75322.88%33,884
Wilkes 16,82669.18%7,22629.71%790.32%1200.49%720.30%9,60039.47%24,323
Wilson 13,46654.24%11,26645.38%510.21%430.17%00.00%2,2008.86%24,826
Yadkin 10,43576.27%3,12722.85%530.39%670.49%00.00%7,30853.42%13,682
Yancey 4,97056.71%3,71442.38%200.23%590.67%10.01%1,25614.33%8,764
Totals1,631,16356.03%1,257,69243.20%12,3070.42%8,8740.30%1,2260.04%373,47112.83%2,911,262

Counties that flipped from Democratic to Republican

By congressional district

Bush won nine of twelve congressional districts, including two held by Democrats. [4]

DistrictBushGoreRepresentative
1st 42%58% Eva Clayton
2nd 56%44% Bob Etheridge
3rd 62%38% Walter B. Jones
4th 47%52% David Price
5th 66%33% Richard Burr
6th 65%34% Howard Coble
7th 53%47% Mike McIntyre
8th 56%43% Robin Hayes
9th 61%38% Sue Wilkins Myrick
10th 67%33% Cass Ballenger
11th 59%40% Charles H. Taylor
12th 37%62% Mel Watt

Electors

Technically the voters of North Carolina cast their ballots for electors: representatives to the Electoral College. North Carolina is allocated 14 electors because it has 12 congressional districts and 2 senators. All candidates who appear on the ballot or qualify to receive write-in votes must submit a list of 14 electors, who pledge to vote for their candidate and his or her running mate. Whoever wins the majority of votes in the state is awarded all 14 electoral votes. Their chosen electors then vote for president and vice president. Although electors are pledged to their candidate and running mate, they are not obligated to vote for them. An elector who votes for someone other than his or her candidate is known as a faithless elector.

The electors of each state and the District of Columbia met on December 18, 2000 [5] to cast their votes for president and vice president. The Electoral College itself never meets as one body. Instead the electors from each state and the District of Columbia met in their respective capitols.

The following were the members of the Electoral College from the state. All were pledged to and voted for George W. Bush and Dick Cheney: [6]

  1. Fran Barnhart
  2. Claude Billings
  3. Sam Currin
  4. Tom Dwiggins
  5. A. Dial Gray
  6. Barbara Holt
  7. Marshall Hurley
  8. Margaret King
  9. Jeff Mixon
  10. Joe L. Morgan
  11. Steve Rader
  12. Robert Rector
  13. Dewitt Rhoades
  14. Linda Young

Notes

    Related Research Articles

    <span class="mw-page-title-main">2004 United States presidential election in Iowa</span>

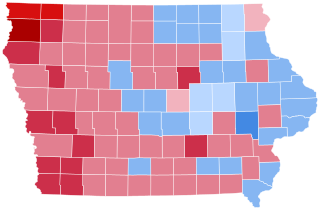
    The 2004 United States presidential election in Iowa took place on November 2, 2004, as part of the 2004 United States presidential election in which all 50 states plus the District of Columbia participated. Voters chose seven electors to represent them in the Electoral College via a popular vote pitting incumbent Republican President George W. Bush and his running mate, Vice President Dick Cheney, against Democratic challenger and Senator from Massachusetts John F. Kerry and his running mate, Senator from North Carolina John Edwards. Six third parties were also on the ballot.

    <span class="mw-page-title-main">2004 United States presidential election in Alabama</span> Election in Alabama

    The 2004 United States presidential election in Alabama took place on November 2, 2004. Voters chose nine representatives, or electors, to the Electoral College, who voted for president and vice president.

    <span class="mw-page-title-main">2004 United States presidential election in Arkansas</span> Election in Arkansas

    The 2004 United States presidential election in Arkansas took place on November 2, 2004, and was part of the 2004 United States presidential election. State voters chose six representatives, or electors to the Electoral College, who voted for president and vice president.

    <span class="mw-page-title-main">2004 United States presidential election in Missouri</span> Election in Missouri

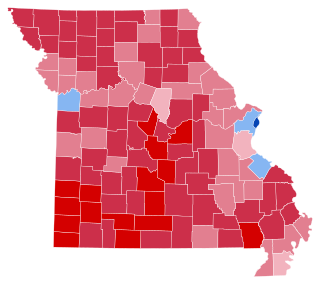
    The 2004 United States presidential election in Missouri took place on November 2, 2004, and was part of the 2004 United States presidential election. Voters chose 11 representatives, or electors to the Electoral College, who voted for president and vice president.

    <span class="mw-page-title-main">2004 United States presidential election in North Carolina</span>

    The 2004 United States presidential election in North Carolina took place on November 2, 2004, and was part of the 2004 United States presidential election. Voters chose 15 representatives, or electors to the Electoral College, who voted for president and vice president.

    The 2004 United States presidential election in Tennessee took place on November 2, 2004, and was part of the 2004 United States presidential election. Voters chose 11 representatives, or electors to the Electoral College, who voted for president and vice president.

    <span class="mw-page-title-main">2004 United States presidential election in Louisiana</span> Election in Louisiana

    The 2004 United States presidential election in Louisiana took place on November 2, 2004, and was part of the 2004 United States presidential election. Voters chose nine representatives, or electors to the Electoral College, who voted for president and vice president.

    <span class="mw-page-title-main">2000 United States presidential election in Alabama</span> Election in Alabama

    The 2000 United States presidential election in Alabama took place on November 7, 2000, and was part of the 2000 United States presidential election. Voters chose 9 representatives, or electors to the Electoral College, who voted for president and vice president.

    <span class="mw-page-title-main">2000 United States presidential election in New Hampshire</span> Election in New Hampshire

    The 2000 United States presidential election in New Hampshire took place on Election Day on November 7, 2000 as part of the 2000 United States presidential election. The two major candidates were Texas Governor George W. Bush of the Republican Party and Vice President Al Gore of the Democratic Party. When all votes were tallied, Bush was declared the winner with a plurality of the vote over Gore, receiving 48% of the vote to Gore's 47%, while Green Party candidate Ralph Nader received almost 4% of the vote in the state. Bush went on to win the election nationwide. Had incumbent Gore come out victorious in New Hampshire with its four electoral votes, he would have won the presidency, regardless of the outcome of Bush v. Gore.

    <span class="mw-page-title-main">2000 United States presidential election in Nevada</span> Election in Nevada

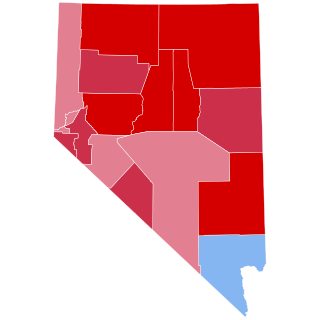
    The 2000 United States presidential election in Nevada took place on November 7, 2000, and was part of the 2000 United States presidential election. Voters chose four representatives, or electors to the Electoral College, who voted for president and vice president.

    <span class="mw-page-title-main">2000 United States presidential election in Colorado</span> Election in Colorado

    The 2000 United States presidential election in Colorado took place on November 7, 2000, and was part of the 2000 United States presidential election. Voters chose eight representatives, or electors to the Electoral College, who voted for president and vice president.

    <span class="mw-page-title-main">2000 United States presidential election in Idaho</span> Election in Idaho

    The 2000 United States presidential election in Idaho took place on November 7, 2000, as part of the 2000 United States presidential election. Voters chose four representatives, or electors to the Electoral College, who voted for president and vice president.

    <span class="mw-page-title-main">2000 United States presidential election in Georgia</span> Election in Georgia

    The 2000 United States presidential election in Georgia took place on November 7, 2000, and was part of the 2000 United States presidential election. Voters chose 13 representatives, or electors to the Electoral College, who voted for president and vice president.

    <span class="mw-page-title-main">2000 United States presidential election in Indiana</span> Election in Indiana

    The 2000 United States presidential election in Indiana took place on November 7, 2000, and was part of the 2000 United States presidential election. Voters chose 12 representatives, or electors to the Electoral College, who voted for president and vice president.

    <span class="mw-page-title-main">2000 United States presidential election in Kansas</span> Election in Kansas

    The 2000 United States presidential election in Kansas took place on November 7, 2000, and was part of the 2000 United States presidential election. Voters chose six representatives, or electors to the Electoral College, who voted for president and vice president.

    <span class="mw-page-title-main">2000 United States presidential election in Minnesota</span>

    The 2000 United States presidential election in Minnesota took place on November 7, 2000, as part of the 2000 United States presidential election, which was held throughout all 50 states and D.C. Voters chose ten representatives, or electors to the Electoral College, who voted for president and vice president.

    <span class="mw-page-title-main">2000 United States presidential election in New Mexico</span> Election in New Mexico

    The 2000 United States presidential election in New Mexico took place on November 7, 2000, and was part of the 2000 United States presidential election. Voters chose five electors to the Electoral College, who voted for president and vice president. New Mexico was won by Vice President Al Gore by a 0.06 percent margin. It was the closest state in the entire presidential election by raw vote margin, closer than Florida. News outlets called New Mexico for Gore at approximately 10:21 p.m. (EST), but later retracted the call when it was determined to be too close to call.

    <span class="mw-page-title-main">2000 United States presidential election in North Dakota</span> Election in North Dakota

    The 2000 United States presidential election in North Dakota took place on November 7, 2000, and was part of the 2000 United States presidential election. Voters chose three representatives, or electors to the Electoral College, who voted for president and vice president.

    <span class="mw-page-title-main">2000 United States presidential election in Utah</span> Election in Utah

    The 2000 United States presidential election in Utah took place on November 7, 2000, as part of the 2000 United States presidential election. Voters chose five representatives, or electors to the Electoral College, who voted for president and vice president.

    <span class="mw-page-title-main">1996 United States presidential election in North Carolina</span>

    The 1996 United States presidential election in North Carolina took place on 5 November 1996 as part of the 1996 United States presidential election. Voters in North Carolina chose 14 representatives, or electors to the Electoral College, who voted for president and vice president.

    References

    1. "2000 Presidential General Election Results – North Carolina". Dave Leip’s U.S. Election Atlas.
    2. Sullivan, Robert David (June 29, 2016). "How the Red and Blue Map Evolved Over the Past Century". The National Catholic Review (America Magazine ed.).
    3. "NC US President Race, November 07, 2000". Our Campaigns.
    4. "2000 Presidential General Election Data – North Carolina". Dave Leip’s U.S. Election Atlas.
    5. "2000 Events Timeline". Dave Leip’s U.S. Election Atlas.
    6. "President Elect - 2000". Archived from the original on February 12, 2012. Retrieved November 8, 2009.