2000 United States presidential election in Texas

Last updated

2000 United States presidential election in Texas
Flag of Texas.svg
  1996 November 7, 2000 2004  
Turnout51.8% (of registered voters) Decrease2.svg
44.3% (of voting age population) [1]
  GeorgeWBush (1).jpg Al Gore, Vice President of the United States, official portrait 1994 (a).jpg
Nominee George W. Bush Al Gore
Party Republican Democratic
Home state Texas Tennessee
Running mate Dick Cheney Joe Lieberman
Electoral vote320
Popular vote3,799,6392,433,746
Percentage59.30%37.98%

Texas Presidential Election Results 2000.svg
2000 TX Pres.svg

President before election

Bill Clinton
Democratic

Elected President

George W. Bush
Republican

The 2000 United States presidential election in Texas took place on November 7, 2000, and was part of the 2000 United States presidential election. State voters chose 32 representatives, or electors, to the Electoral College, who voted for president and vice president.

Contents

Texas was won by the Republican Party candidate, the state's incumbent governor, George W. Bush, by a 21.32% margin of victory. This was the first time since 1928 that Cottle County voted Republican. Many counties that Bill Clinton won in 1996 swung towards Bush in this election, in part due to the increasingly conservative bent of rural areas and Bush's favorite son status within the state. Perhaps the most notable and surprising county to be won by Bush was the very liberal Travis County. Bush's win in the county is likely due to the somewhat strong showing of left-wing third-party candidate Ralph Nader, who got 10.37% of the vote on the Green ticket, his best showing in any Texas county. Had those voters voted for Gore, he would have narrowly won the county by 5.16% (52.04% to Bush's 46.88%). [2]

Results

2000 United States presidential election in Texas [3]
PartyCandidateVotesPercentageElectoral votes
Republican George W. Bush 3,799,63959.30%32
Democratic Al Gore 2,433,74637.98%0
Green Ralph Nader 137,9942.15%0
Libertarian Harry Browne 23,1600.36%0
Reform Pat Buchanan 12,3940.19%0

By county

CountyGeorge W. Bush
Republican
Al Gore
Democratic
Various candidates
Other parties
MarginTotal
#%#%#%#%
Anderson 9,83565.22%5,04133.43%2041.35%4,79431.79%15,080
Andrews 3,09176.81%87621.77%571.42%2,21555.04%4,024
Angelina 16,64861.72%9,95736.91%3691.37%6,69124.81%26,974
Aransas 5,39065.36%2,63731.98%2202.67%2,75333.38%8,247
Archer 2,95173.83%99324.84%531.33%1,95848.99%3,997
Armstrong 77282.30%15015.99%161.71%62266.31%938
Atascosa 6,23157.98%4,32240.22%1931.80%1,90917.76%10,746
Austin 6,66172.19%2,40726.09%1591.72%4,25446.10%9,227
Bailey 1,58976.03%48823.35%130.62%1,10152.68%2,090
Bandera 5,61377.18%1,42619.61%2343.22%4,18757.57%7,273
Bastrop 10,31056.31%6,97338.09%1,0255.60%3,33718.22%18,308
Baylor 1,28564.77%66333.42%361.81%62231.35%1,984
Bee 4,42953.17%3,79545.56%1061.27%6347.61%8,330
Bell 41,20865.11%21,01133.20%1,0721.69%20,19731.91%63,291
Bexar 215,61352.24%185,15844.86%11,9552.90%30,4557.38%412,726
Blanco 2,77773.72%81121.53%1794.75%1,96652.19%3,767
Borden 28380.17%6217.56%82.27%22162.61%353
Bosque 4,74570.09%1,93028.51%951.40%2,81541.58%6,770
Bowie 18,32560.44%11,66238.46%3331.10%6,66321.98%30,320
Brazoria 53,44566.79%24,88331.10%1,6912.11%28,56235.69%80,019
Brazos 32,86470.01%12,35926.33%1,7183.66%20,50543.68%46,941
Brewster 1,86752.15%1,34937.68%36410.17%51814.47%3,580
Briscoe 54470.47%22429.02%40.52%32041.45%772
Brooks 55622.87%1,85476.26%210.86%-1,298-53.39%2,431
Brown 9,60974.37%3,13824.29%1731.34%6,47150.08%12,920
Burleson 3,54260.38%2,23538.10%891.52%1,30722.28%5,866
Burnet 9,28670.18%3,55726.88%3892.94%5,72943.30%13,232
Caldwell 5,21655.34%3,87241.08%3373.58%1,34414.26%9,425
Calhoun 3,72456.74%2,76642.15%731.11%95814.59%6,563
Callahan 3,65674.67%1,17423.98%661.35%2,48250.69%4,896
Cameron 27,80044.80%33,21453.52%1,0431.68%-5,414-8.72%62,057
Camp 2,12156.05%1,62542.94%381.00%49613.11%3,784
Carson 2,21680.82%48017.51%461.68%1,73663.31%2,742
Cass 6,29557.13%4,61841.91%1060.96%1,67715.22%11,019
Castro 1,60768.27%72730.88%200.85%88037.39%2,354
Chambers 6,76969.03%2,88829.45%1491.52%3,88139.58%9,806
Cherokee 9,59966.03%4,75532.71%1831.26%4,84433.32%14,537
Childress 1,50670.84%60228.32%180.85%90442.52%2,126
Clay 3,11267.11%1,46031.49%651.40%1,65235.62%4,637
Cochran 80768.92%34429.38%201.71%46339.54%1,171
Coke 1,13775.05%35523.43%231.52%78251.62%1,515
Coleman 2,68775.10%85323.84%381.06%1,83451.26%3,578
Collin 128,17973.07%42,88424.45%4,3572.48%85,29548.62%175,420
Collingsworth 97468.83%42930.32%120.85%54538.51%1,415
Colorado 4,91367.77%2,22930.75%1071.48%2,68437.02%7,249
Comal 24,59975.12%7,13121.78%1,0183.11%17,46853.34%32,748
Comanche 3,33466.39%1,63632.58%521.04%1,69833.81%5,022
Concho 81874.16%26824.30%171.54%55049.86%1,103
Cooke 10,12875.19%3,15323.41%1881.40%6,97551.78%13,469
Coryell 10,32168.41%4,49329.78%2731.81%5,82838.63%15,087
Cottle 50266.31%24131.84%141.85%26134.47%757
Crane 1,24675.33%38723.40%211.27%85951.93%1,654
Crockett 92466.09%46733.40%70.50%45732.69%1,398
Crosby 1,27063.44%70535.21%271.35%56528.23%2,002
Culberson 41340.81%57757.02%222.17%-164-16.21%1,012
Dallam 1,38579.42%34119.55%181.03%1,04459.87%1,744
Dallas 322,34552.58%275,30844.91%15,3862.51%47,0377.67%613,039
Dawson 3,33768.96%1,46330.23%390.81%1,87438.73%4,839
Deaf Smith 3,68773.98%1,24024.88%571.14%2,44749.10%4,984
Delta 1,14360.16%72638.21%311.63%41721.95%1,900
Denton 102,17169.60%40,14427.35%4,4753.05%62,02742.25%146,790
DeWitt 4,54173.44%1,57025.39%721.16%2,97148.05%6,183
Dickens 58966.86%28432.24%80.91%30534.62%881
Dimmit 1,03227.50%2,67871.36%431.15%-1,646-43.86%3,753
Donley 1,33377.55%36020.94%261.51%97356.61%1,719
Duval 1,01020.08%3,99079.32%300.60%-2,980-59.24%5,030
Eastland 4,53170.64%1,77427.66%1091.70%2,75742.98%6,414
Ector 22,89369.58%9,42528.65%5831.77%13,46840.93%32,901
Edwards 66370.76%26127.85%131.39%40242.91%937
El Paso 57,57439.69%83,84857.81%3,6202.50%-26,274-18.12%145,042
Ellis 26,09169.94%10,62928.49%5871.57%15,46241.45%37,307
Erath 8,12673.11%2,80425.23%1851.66%5,32247.88%11,115
Falls 3,23956.68%2,41742.29%591.03%82214.39%5,715
Fannin 6,07458.74%4,10239.67%1641.59%1,97219.07%10,340
Fayette 6,65870.93%2,54227.08%1871.99%4,11643.85%9,387
Fisher 96851.71%88447.22%201.07%844.49%1,872
Floyd 1,83075.62%58023.97%100.41%1,25051.65%2,420
Foard 28651.44%26347.30%71.26%234.14%556
Fort Bend 73,56759.56%47,56938.51%2,3731.92%25,99821.05%123,509
Franklin 2,42069.70%1,01829.32%340.98%1,40240.38%3,472
Freestone 4,24763.95%2,31634.87%781.17%1,93129.08%6,641
Frio 1,77442.97%2,31756.13%370.90%-543-13.16%4,128
Gaines 2,69177.80%72320.90%451.30%1,96856.90%3,459
Galveston 50,39754.20%40,02043.04%2,5662.76%10,37711.16%92,983
Garza 1,30273.56%45425.65%140.79%84847.91%1,770
Gillespie 8,09681.61%1,51115.23%3133.16%6,58566.38%9,920
Glasscock 52892.47%396.83%40.70%48985.64%571
Goliad 2,10862.15%1,23336.35%511.50%87525.80%3,392
Gonzales 4,09267.42%1,87730.93%1001.65%2,21536.49%6,069
Gray 6,73282.25%1,37616.81%770.94%5,35665.44%8,185
Grayson 25,59664.09%13,64734.17%6971.75%11,94929.92%39,940
Gregg 26,73969.57%11,24429.26%4501.17%15,49540.31%38,433
Grimes 4,19761.70%2,45036.02%1552.28%1,74725.68%6,802
Guadalupe 21,49970.33%8,31127.19%7572.48%13,18843.14%30,567
Hale 6,86875.39%2,15823.69%840.92%4,71051.70%9,110
Hall 96666.80%47232.64%80.55%49434.16%1,446
Hamilton 2,44772.48%87826.01%511.51%1,56946.47%3,376
Hansford 1,87489.75%1989.48%160.77%1,67680.27%2,088
Hardeman 97662.68%56636.35%150.96%41026.33%1,557
Hardin 11,96267.07%5,59531.37%2791.56%6,36735.70%17,836
Harris 529,15954.28%418,26742.91%27,3962.81%110,89211.37%974,822
Harrison 13,83460.23%8,87838.65%2581.12%4,95621.58%22,970
Hartley 1,64580.99%35917.68%271.33%1,28663.31%2,031
Haskell 1,48850.84%1,40147.86%381.30%872.98%2,927
Hays 20,17058.78%11,38733.18%2,7608.04%8,78325.60%34,317
Hemphill 1,20381.61%25117.03%201.36%95264.58%1,474
Henderson 16,60764.80%8,70433.96%3161.23%7,90330.84%25,627
Hidalgo 38,30137.90%61,39060.75%1,3591.34%-23,089-22.85%101,150
Hill 7,05465.71%3,52432.83%1571.46%3,53032.88%10,735
Hockley 5,25077.84%1,41921.04%761.13%3,83156.80%6,745
Hood 12,42971.00%4,70426.87%3722.13%7,72544.13%17,505
Hopkins 7,07664.86%3,69233.84%1421.30%3,38431.02%10,910
Houston 5,30864.45%2,83334.40%951.15%2,47530.05%8,236
Howard 6,66869.84%2,74428.74%1361.42%3,92441.10%9,548
Hudspeth 51455.75%38041.21%283.04%13414.54%922
Hunt 16,17766.12%7,85732.11%4321.77%8,32034.01%24,466
Hutchinson 7,44379.60%1,79619.21%1121.20%5,64760.39%9,351
Irion 62478.69%16220.43%70.88%46258.26%793
Jack 2,10770.85%82227.64%451.51%1,28543.21%2,974
Jackson 3,36569.30%1,44629.78%450.93%1,91921.95%4,856
Jasper 7,07160.22%4,53338.61%1381.18%2,53821.61%11,742
Jeff Davis 70866.79%28326.70%696.51%42540.09%1,060
Jefferson 40,32046.39%45,40952.25%1,1801.36%-5,089-5.86%86,909
Jim Hogg 62328.88%1,51270.10%221.02%-889-41.22%2,157
Jim Wells 4,49837.41%7,41861.70%1070.89%-2,920-24.29%12,023
Johnson 26,20267.66%11,77830.41%7461.93%14,42437.25%38,726
Jones 4,08067.46%1,89931.40%691.14%2,18136.06%6,048
Karnes 2,63861.23%1,61737.53%531.23%1,02123.70%4,308
Kaufman 15,29066.30%7,45532.32%3181.38%7,83533.98%23,063
Kendall 8,78879.36%1,90117.17%3843.47%6,88762.19%11,073
Kenedy 10646.49%11952.19%31.32%-13-5.70%228
Kent 34664.55%18534.51%50.93%16130.04%536
Kerr 14,63776.12%4,00220.81%5893.06%10,63555.31%19,228
Kimble 1,31378.81%32819.69%251.50%98559.12%1,666
King 12087.59%1410.22%32.19%10677.37%137
Kinney 93264.54%48633.66%261.80%44630.88%1,444
Kleberg 4,52649.23%4,48148.74%1872.03%450.49%9,194
Knox 94760.09%61739.15%120.76%33020.94%1,576
La Salle 73136.30%1,26662.86%170.84%-535-26.56%2,014
Lamar 9,77563.35%5,55335.99%1020.66%4,22227.36%15,430
Lamb 3,45175.05%1,11424.23%330.72%2,33750.82%4,598
Lampasas 4,52672.84%1,56925.25%1191.92%2,95747.59%6,214
Lavaca 5,28870.08%2,17128.77%871.15%3,11741.31%7,546
Lee 3,69966.82%1,73331.30%1041.88%1,96635.52%5,536
Leon 4,36268.95%1,89329.92%711.12%2,46939.03%6,326
Liberty 12,45862.05%7,31136.41%3081.53%5,14725.64%20,077
Limestone 4,21259.53%2,76839.12%951.34%1,44420.41%7,075
Lipscomb 1,07282.84%20615.92%161.24%86666.92%1,294
Live Oak 2,82870.63%1,11427.82%621.55%1,71442.81%4,004
Llano 6,29572.97%2,14324.84%1892.19%4,15248.13%8,627
Loving 12479.49%2918.59%31.92%9560.90%156
Lubbock 56,05473.75%18,46924.30%1,4851.95%37,58549.45%76,008
Lynn 1,50772.31%56226.97%150.72%94545.34%2,084
Madison 2,33364.39%1,24134.25%491.35%1,09230.14%3,623
Marion 2,03951.88%1,85247.12%390.99%1874.76%3,930
Martin 1,52077.99%41521.29%140.72%1,10556.70%1,949
Mason 1,35275.07%41723.15%321.78%93551.92%1,801
Matagorda 7,58460.87%4,69637.69%1791.44%2,88823.18%12,459
Maverick 3,14334.06%5,99564.96%910.99%-2,852-30.90%9,229
McCulloch 2,08471.37%79427.19%421.44%1,29044.18%2,920
McLennan 43,95563.90%23,46234.11%1,3721.99%20,49329.79%68,789
McMullen 35881.55%7717.54%40.91%28164.01%439
Medina 8,59066.73%4,02531.27%2582.00%4,56535.46%12,873
Menard 64264.85%33433.74%141.41%30831.11%990
Midland 31,51479.30%7,53418.96%6921.74%23,98060.34%39,740
Milam 4,70656.91%3,42941.47%1341.62%1,27715.44%8,269
Mills 1,73875.11%54823.68%281.21%1,19051.43%2,314
Mitchell 1,70866.36%83732.52%291.13%87133.84%2,574
Montague 4,95167.54%2,25630.78%1231.68%2,69536.76%7,330
Montgomery 80,60075.89%23,28621.92%2,3272.19%57,31453.97%106,213
Moore 4,20179.41%1,04019.66%490.93%3,16159.75%5,290
Morris 2,38148.70%2,45550.21%531.08%-74-1.51%4,889
Motley 51480.06%11818.38%101.56%39661.68%642
Nacogdoches 13,14566.39%6,20431.33%4502.27%6,94135.06%19,799
Navarro 8,35860.17%5,36638.63%1661.20%2,99221.54%13,890
Newton 2,42348.56%2,50350.16%641.28%-80-1.60%4,990
Nolan 3,33762.82%1,87435.28%1011.90%1,46327.54%5,312
Nueces 49,90651.28%45,34946.59%2,0712.13%4,5574.69%97,326
Ochiltree 2,68790.72%2518.47%240.81%2,43682.25%2,962
Oldham 65985.14%10813.95%70.91%55171.19%774
Orange 17,32558.42%11,88740.09%4421.49%5,43818.33%29,654
Palo Pinto 5,69062.40%3,26335.79%1651.81%2,42726.61%9,118
Panola 5,97565.85%3,01133.18%880.97%2,96432.67%9,074
Parker 23,65171.18%8,87826.72%6962.09%14,77344.46%33,225
Parmer 2,27482.87%44716.29%230.84%1,82766.58%2,744
Pecos 2,70062.75%1,53935.77%641.49%1,16126.98%4,303
Polk 11,74661.84%6,87736.21%3711.95%4,86925.63%18,994
Potter 17,62969.47%7,24228.54%5051.99%10,38740.93%25,376
Presidio 61835.17%1,06460.56%754.27%-446-25.39%1,757
Rains 2,04961.48%1,22536.75%591.77%82424.73%3,333
Randall 33,92181.17%7,20917.25%6601.58%26,71263.92%41,790
Reagan 95976.41%28222.47%141.12%67753.94%1,255
Real 1,14676.91%31621.21%281.88%83055.70%1,490
Red River 2,94156.54%2,21942.66%420.81%72213.88%5,202
Reeves 1,27340.08%1,87258.94%310.98%-599-18.86%3,176
Refugio 1,72158.92%1,17240.12%280.96%54918.80%2,921
Roberts 47285.97%7213.11%50.91%40072.86%549
Robertson 3,00747.21%3,28351.55%791.24%-276-4.34%6,369
Rockwall 13,66677.42%3,64220.63%3441.95%10,02456.79%17,652
Runnels 3,02074.64%96923.95%571.41%2,05150.69%4,046
Rusk 11,61169.81%4,84129.10%1811.09%6,77040.71%16,633
Sabine 2,76460.20%1,75338.18%741.61%1,01122.02%4,591
San Augustine 2,11655.61%1,63643.00%531.39%48012.61%3,805
San Jacinto 4,62359.93%2,94638.19%1451.88%1,67721.74%7,714
San Patricio 10,59956.68%7,84041.93%2601.39%2,75914.75%18,699
San Saba 1,69172.48%61826.49%241.03%1,07345.99%2,333
Schleicher 82670.42%33828.82%90.77%48841.60%1,173
Scurry 4,06076.23%1,19322.40%731.37%2,86753.83%5,326
Shackelford 1,06679.14%26419.60%171.26%80259.54%1,347
Shelby 5,69263.21%3,22735.84%860.96%2,46527.37%9,005
Sherman 99885.81%14412.38%211.81%85473.43%1,163
Smith 43,32071.46%16,47027.17%8341.38%26,85044.29%60,624
Somervell 2,12072.65%75225.77%461.58%1,36846.88%2,918
Starr 1,91122.58%6,50576.85%480.57%-4,594-54.27%8,464
Stephens 2,42573.69%81124.64%551.67%1,61449.05%3,291
Sterling 52078.91%13220.03%71.06%38858.88%659
Stonewall 49662.08%29436.80%91.13%20225.28%799
Sutton 1,06369.03%46830.39%90.58%59538.64%1,540
Swisher 1,61264.45%85634.23%331.32%75630.22%2,501
Tarrant 286,92160.74%173,75836.78%11,7102.48%113,16323.96%472,389
Taylor 31,70173.69%10,50424.42%8151.89%21,19749.27%43,020
Terrell 24350.94%21945.91%153.14%245.03%477
Terry 2,91071.78%1,10827.33%360.89%1,80244.45%4,054
Throckmorton 60872.21%22827.08%60.71%38045.13%842
Titus 4,99561.64%3,00837.12%1001.23%1,98724.52%8,103
Tom Green 24,73371.43%9,28826.82%6051.75%15,44544.61%34,626
Travis 141,23546.88%125,52641.67%34,50211.45%15,7095.21%301,263
Trinity 3,09358.39%2,14240.44%621.17%95117.95%5,297
Tyler 4,23659.53%2,77539.00%1051.48%1,46120.53%7,116
Upshur 8,44865.96%4,18032.64%1801.41%4,26833.32%12,808
Upton 98277.14%26620.90%251.96%71656.24%1,273
Uvalde 4,85557.66%3,43640.81%1291.53%1,41916.85%8,420
Val Verde 6,22354.24%5,05644.06%1951.70%1,16710.18%11,474
Van Zandt 12,38369.21%5,24529.32%2631.47%7,13839.89%17,891
Victoria 18,78768.55%8,17629.83%4451.62%10,61138.72%27,408
Walker 9,07663.14%4,94334.39%3552.47%4,13328.75%14,374
Waller 5,68652.37%5,04646.47%1261.16%6405.90%10,858
Ward 2,53465.41%1,25632.42%842.17%1,27832.99%3,874
Washington 8,64573.21%2,99625.37%1681.42%5,64947.84%11,809
Webb 13,07641.42%18,12057.39%3751.19%-5,044-15.97%31,571
Wharton 8,45562.97%4,83836.03%1330.99%3,61726.94%13,426
Wheeler 1,78774.80%57924.24%230.96%1,20850.56%2,389
Wichita 27,80265.09%14,10833.03%8031.88%13,69432.06%42,713
Wilbarger 3,13868.56%1,35629.63%831.81%1,78238.93%4,577
Willacy 1,78935.34%3,21863.57%551.09%-1,429-28.23%5,062
Williamson 65,04167.80%26,59127.72%4,3034.49%38,45040.08%95,935
Wilson 7,50964.19%3,99734.17%1921.64%3,51230.02%11,698
Winkler 1,46871.86%55627.21%190.93%91244.65%2,043
Wise 11,23468.63%4,83029.51%3041.86%6,40439.12%16,368
Wood 9,81070.66%3,89328.04%1811.30%5,91742.62%13,884
Yoakum 1,91177.53%53121.54%230.93%1,38055.99%2,465
Young 5,02272.22%1,84326.50%891.28%3,17945.72%6,954
Zapata 95336.43%1,63862.61%250.96%-685-26.18%2,616
Zavala 75122.15%2,61677.15%240.71%-1,865-55.00%3,391
Totals3,799,63959.30%2,433,74637.98%174,2522.72%1,365,89321.32%6,407,637

Counties that flipped from Democratic to Republican

By congressional district

Bush won 20 of 30 congressional districts, including seven held by Democrats. [4]

DistrictBushGoreRepresentative
1st 63%35% Max Sandlin
2nd 61%37% Jim Turner
3rd 68%29% Sam Johnson
4th 71%27% Ralph Hall
5th 56%41% Pete Sessions
6th 70%29% Joe Barton
7th 70%26% Bill Archer
John Culberson
8th 76%22% Kevin Brady
9th 53%44% Nick Lampson
10th 46%43% Lloyd Doggett
11th 65%33% Chet Edwards
12th 59%40% Kay Granger
13th 68%31% Mac Thornberry
14th 63%34% Ron Paul
15th 44%54% Rubén Hinojosa
16th 40%59% Silvestre Reyes
17th 70%28% Charles Stenholm
18th 26%70% Sheila Jackson Lee
19th 79%19% Larry Combest
20th 43%56% Charlie Gonzalez
21st 74%24% Lamar S. Smith
22nd 62%35% Tom DeLay
23rd 57%41% Henry Bonilla
24th 47%51% Martin Frost
25th 47%49% Ken Bentsen Jr.
26th 71%27% Dick Armey
27th 48%49% Solomon Ortiz
28th 42%56% Ciro Rodriguez
29th 38%59% Gene Green
30th 28%69% Eddie Bernice Johnson

Analysis

The 2000 election in Texas was a very partisan election, with nearly 60% of voters voting for the Republican Party candidate. The third party vote shrunk to a total of 2.7%, likely because Ross Perot was not on the ballot that year. The vast majority of counties voted heavily for Governor Bush as his approval rating and popularity in the state was high. Many of the long time rural Democratic counties, including those in East Texas along the border of Louisiana, swung Republican as the national Democratic Party moved further to the left. Texas Democrats are more moderate to conservative by national standards, and many had a favorable view towards Bush because of his bipartisan approach with the Democratic state legislature during his tenure as governor.

Bush carried 230 of Texas's 254 counties. He racked up big margins in the Texas Panhandle, East Texas, the Permian Basin, the Texas Hill Country, and the Gulf Coast. He won every major and mid-sized city with the exceptions of El Paso, Laredo, Brownsville, McAllen, and Beaumont, all of which were carried by Vice President Al Gore. Two thinly populated counties, Glasscock and Ochiltree, gave Bush over 90% of the vote, with the former being the strongest Republican voting county in 2000. [5] This marked the first time since 1956 that a Republican candidate won any of Texas's counties with over 90% of the vote, and the first time since Texas native Lyndon B. Johnson in 1964 any candidate has done so.

Vice President Al Gore, the Democratic Party candidate, performed strongly in South Texas, which is composed of a heavy Latino population, and the city of El Paso. Three counties in East Texas voted for Gore by narrow margins: Jefferson, Morris, and Newton. This was the worst performance for a Democrat in East Texas since the 1984 election.

The Green Party candidate Ralph Nader, had his best performance in Travis County, home to the state capital Austin, winning 10.37% of the vote. As of the 2020 presidential election , this is the last time a Republican won this liberal Democratic-leaning county. [6] This is also the last time Robertson County, and the East Texas counties of Newton and Morris voted Democratic, leaving Jefferson, home of Beaumont and Port Arthur, as the sole Democratic stronghold in this region until Donald Trump won it in 2016.

Electors

The electors of each state and the District of Columbia met on December 18, 2000, [7] to cast their votes for president and vice president. The Electoral College itself never meets as one body. Instead the electors from each state and the District of Columbia met in their respective capitols.

The following were the members of the Electoral College from the state. All were pledged to and voted for George Bush and Dick Cheney: [8]

  1. Ernie Angelo
  2. James R. Batsell
  3. Carmen P. Castillo
  4. Mary Ceverha
  5. Ken Clark
  6. Hally B. Clements
  7. Mary E. Cowart
  8. Sue Daniel
  9. Michael Dugas
  10. Betty R. Hines
  11. Jim Hamlin
  12. Cruz G. Hernandez
  13. Chuck Jones
  14. William Earl Juett
  15. Neal J. Katz
  16. Betsy Lake
  17. Adair Margo
  18. Loyce McCarter
  19. Joseph I. Oniell III
  20. Michael Paddie
  21. Nancy Palm
  22. Howard Pebley Jr.
  23. Robert J. Peden
  24. Helen Quiram
  25. James B. Randall
  26. Clyde Moody Siebman
  27. Stan Stanart
  28. Henry W. Teich Jr.
  29. Randal Tye Thomas
  30. James Davidson Walker
  31. Tom F. Ward Jr.
  32. Gayle West

See also

Related Research Articles

<span class="mw-page-title-main">2000 United States presidential election in New York</span>

The 2000 United States presidential election in New York took place on November 7, 2000, as part of the 2000 United States presidential election. Voters chose 33 representatives, or electors to the Electoral College, who voted for president and vice president.

<span class="mw-page-title-main">2004 United States presidential election in Texas</span> Election in Texas

The 2004 United States presidential election in Texas took place on November 2, 2004, and was part of the 2004 United States presidential election. State voters chose 34 representatives, or electors to the Electoral College, who voted for president and vice president.

<span class="mw-page-title-main">2004 United States presidential election in Iowa</span>

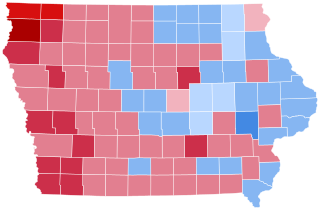
The 2004 United States presidential election in Iowa took place on November 2, 2004, as part of the 2004 United States presidential election in which all 50 states plus the District of Columbia participated. Voters chose seven electors to represent them in the Electoral College via a popular vote pitting incumbent Republican President George W. Bush and his running mate, Vice President Dick Cheney, against Democratic challenger and Senator from Massachusetts John F. Kerry and his running mate, Senator from North Carolina John Edwards. Six third parties were also on the ballot.

<span class="mw-page-title-main">2004 United States presidential election in Connecticut</span> Election in Connecticut

The 2004 United States presidential election in Connecticut took place on November 2, 2004, and was part of the 2004 United States presidential election. Voters chose seven representatives, or electors to the Electoral College, who voted for president and vice president.

<span class="mw-page-title-main">2004 United States presidential election in Missouri</span> Election in Missouri

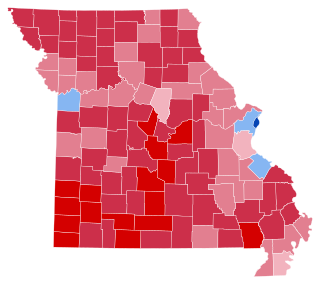
The 2004 United States presidential election in Missouri took place on November 2, 2004, and was part of the 2004 United States presidential election. Voters chose 11 representatives, or electors to the Electoral College, who voted for president and vice president.

The 2004 United States presidential election in Tennessee took place on November 2, 2004, and was part of the 2004 United States presidential election. Voters chose 11 representatives, or electors to the Electoral College, who voted for president and vice president.

<span class="mw-page-title-main">2000 United States presidential election in Massachusetts</span> Election in Massachusetts

The 2000 United States presidential election in Massachusetts took place on November 7, 2000, and was part of the 2000 United States presidential election. Voters chose 12 representatives, or electors to the Electoral College, who voted for president and vice president.

<span class="mw-page-title-main">2004 United States presidential election in Oklahoma</span> Election in Oklahoma

The 2004 United States presidential election in Oklahoma took place on November 2, 2004, and was part of the 2004 United States presidential election. Voters chose seven representatives, or electors to the Electoral College, who voted for president and vice president.

<span class="mw-page-title-main">2000 United States presidential election in California</span>

The 2000 United States presidential election in California took place on November 7, 2000, as part of the wider 2000 United States presidential election. Voters chose 54 representatives, or electors to the Electoral College, who voted for president and vice president.

<span class="mw-page-title-main">2000 United States presidential election in New Jersey</span> Election in New Jersey

In 2000, the United States presidential election in New Jersey, along with every U.S. state and Washington, D.C., took place on November 7, 2000 as part of the 2000 United States presidential election. The major party candidates were Democratic Vice President Al Gore of the incumbent administration and Republican Governor of Texas George W. Bush, son of the 41st U.S. president, George H. W. Bush. Owing to the indirect system of voting used in U.S. presidential elections, George W. Bush narrowly defeated Gore in Electoral College votes despite that Gore earned a higher percentage of the popular vote. Green Party candidate Ralph Nader, the only third-party candidate represented on most states' ballots, came in a distant third.

<span class="mw-page-title-main">2000 United States presidential election in Iowa</span>

The 2000 United States presidential election in Iowa took place on November 7, 2000, and was part of the 2000 United States presidential election. Voters chose seven representatives, or electors to the Electoral College, who voted for President and Vice President.

<span class="mw-page-title-main">2000 United States presidential election in Vermont</span> Election in Vermont

The 2000 United States presidential election in Vermont took place on November 7, 2000, and was part of the 2000 United States presidential election. Voters chose three representatives, or electors to the Electoral College, who voted for president and vice president.

<span class="mw-page-title-main">2000 United States presidential election in Rhode Island</span> Election in Rhode Island

The 2000 United States presidential election in Rhode Island took place on November 7, 2000, and was part of the 2000 United States presidential election. Voters chose four representatives, or electors to the Electoral College, who voted for president and vice president.

<span class="mw-page-title-main">2000 United States presidential election in New Hampshire</span> Election in New Hampshire

The 2000 United States presidential election in New Hampshire took place on Election Day on November 7, 2000 as part of the 2000 United States presidential election. The two major candidates were Texas Governor George W. Bush of the Republican Party and Vice President Al Gore of the Democratic Party. When all votes were tallied, Bush was declared the winner with a plurality of the vote over Gore, receiving 48% of the vote to Gore's 47%, while Green Party candidate Ralph Nader received almost 4% of the vote in the state. Bush went on to win the election nationwide. Had incumbent Gore come out victorious in New Hampshire with its four electoral votes, he would have won the presidency, regardless of the outcome of Bush v. Gore.

<span class="mw-page-title-main">2000 United States presidential election in Nevada</span> Election in Nevada

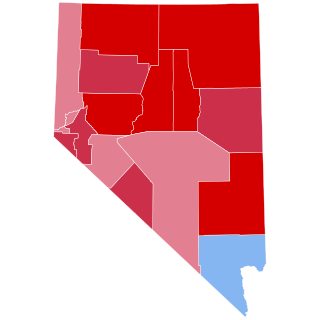
The 2000 United States presidential election in Nevada took place on November 7, 2000, and was part of the 2000 United States presidential election. Voters chose four representatives, or electors to the Electoral College, who voted for president and vice president.

<span class="mw-page-title-main">2000 United States presidential election in Colorado</span> Election in Colorado

The 2000 United States presidential election in Colorado took place on November 7, 2000, and was part of the 2000 United States presidential election. Voters chose eight representatives, or electors to the Electoral College, who voted for president and vice president.

<span class="mw-page-title-main">2000 United States presidential election in Illinois</span>

The 2000 United States presidential election in Illinois took place on November 7, 2000, and was part of the 2000 United States presidential election. Voters chose 22 representatives, or electors to the Electoral College, who voted for president and vice president.

<span class="mw-page-title-main">2000 United States presidential election in Montana</span> Election in Montana

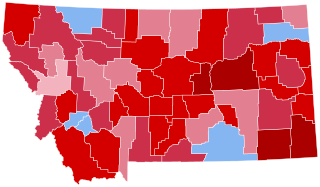
The 2000 United States presidential election in Montana took place on November 7, 2000, and was part of the 2000 United States presidential election. Voters chose three electors to the Electoral College, which voted for president and vice president.

<span class="mw-page-title-main">2000 United States presidential election in Pennsylvania</span> Election in Pennsylvania

The 2000 United States presidential election in Pennsylvania took place on November 7, 2000, and was part of the 2000 United States presidential election. Voters chose 23 representatives, or electors to the Electoral College, who voted for president and vice president.

<span class="mw-page-title-main">1996 United States presidential election in Texas</span> Election in Texas

The 1996 United States presidential election in Texas took place on November 5, 1996. All fifty states, and the District of Columbia, took part in the 1996 United States presidential election. State voters chose 32 electors to the Electoral College, which selected the president and vice president.

References

  1. "Turnout and Voter Registration Figures (1970-current)". www.sos.state.tx.us.
  2. Southwell, Priscilla L (September 1, 2004). "Nader voters in the 2000 Presidential Election: what would they have done without him?". The Social Science Journal. 41 (3): 423–431. doi:10.1016/j.soscij.2004.04.009. S2CID   144552793.
  3. "Dave Leip's Atlas of U.S. Presidential Elections". uselectionatlas.org.
  4. "Dave Leip's Atlas of U.S. Presidential Elections - County Data".
  5. "Dave Leip's Atlas of U.S. Presidential Elections". uselectionatlas.org.
  6. "Texas Presidential Election Results" via NYTimes.com.
  7. "2000 Presidential General Election Results - Pennsylvania".
  8. "President Elect - 2000". Archived from the original on March 3, 2009. Retrieved May 10, 2011.

See also