2012 United States presidential election in Texas

Last updated

2012 United States presidential election in Texas
Flag of Texas.svg
  2008 November 6, 2012 2016  
Turnout58.6% (of registered voters) Decrease2.svg
43.7% (of voting age population) [1]
  Mitt Romney by Gage Skidmore 6 cropped.jpg President Barack Obama, 2012 portrait crop.jpg
Nominee Mitt Romney Barack Obama
Party Republican Democratic
Home state Massachusetts Illinois
Running mate Paul Ryan Joe Biden
Electoral vote380
Popular vote4,569,843 3,308,124
Percentage57.17%41.38%

Texas Presidential Election Results 2012.svg
TX-12-pres-districts.svg
2012 Election in Texas using 2022 VTD(General) (1).svg

President before election

Barack Obama
Democratic

Elected President

Barack Obama
Democratic

The 2012 United States presidential election in Texas took place on November 6, 2012, as part of the 2012 United States presidential election in which all 50 states plus the District of Columbia participated. Texas voters chose 38 electors to represent them in the Electoral College via a popular vote pitting incumbent Democratic President Barack Obama and his running mate, Vice President Joe Biden, against Republican challenger and former Massachusetts Governor Mitt Romney and his running mate, Congressman Paul Ryan.

Contents

As the largest Republican stronghold in the country, Romney won Texas with 57.17%, over Obama's 41.38%, a margin of 15.79%. As in past elections, Obama and the Democrats dominated the Rio Grande Valley, winning upwards of 70% or 80% of the vote in most of these counties, with his best performance in Starr County at 86.34% to Romney's 13.02%, a 73.32% margin. Furthermore, he won the major urban centers of Austin, El Paso, Dallas, Houston, and San Antonio, but Republicans were able to overwhelm the urban vote by sweeping the vast rural areas and suburbs of Texas by large margins. Romney also came extremely close to carrying Harris County, home to Houston, which Obama carried by only 0.08%, or 971 votes. [2] In the process, Romney beat George W. Bush's 2004 record of the most votes for a presidential candidate in Texas, a record later surpassed in 2016 by Donald Trump and in 2020 by both Trump and Joe Biden. By receiving 95.86% of the vote in King County, [3] Romney also recorded the highest proportion of any county's vote cast for one candidate since Barry Goldwater received between 95.92 and 96.59% of the vote in seven Mississippi counties [lower-alpha 1] in Mississippi in 1964 – although this occurred when African-American majorities in these counties had been almost totally disenfranchised for seven and a half decades.

Texas's 38 electoral votes were Romney's largest electoral prize in the election. The state solidified its Republican identity in the Reagan Era and had not voted for a Democratic presidential nominee since fellow Southerner Jimmy Carter carried it in 1976. The oil industry is the driving factor of the state's economy, with numerous oil companies such as ExxonMobil being based in the state, [4] and consequently the state has rejected the Democratic Party which has increasingly embraced environmentalist policies. In addition, moderate Republicans' popularity among suburban Texans boosted their support. However, although Romney improved on John McCain's 2008 performance, this election solidified the Texan urban areas' move away from the GOP. Dallas and Harris Counties, home to Dallas and Houston, respectively, both of which flipped in 2008, remained blue this year, setting the stage for suburban areas beginning to slip from the Republican Party.

As of the 2020 presidential election, this is the last time in which Texas was decided by double digits as well as the last time that Fort Bend County voted for the Republican nominee and the last time Jefferson County voted for the Democratic nominee.

Primary elections

Democratic primary

2012 Texas Democratic presidential primary
Flag of Texas.svg
  2008 May 29, 2012 (2012-05-29) 2016  
  President Barack Obama, 2012 portrait crop.jpg John Wolfe, Jr.jpg
Candidate Barack Obama John Wolfe Jr.
Home state Illinois Tennessee
Delegate count2870
Popular vote520,41029,879
Percentage88.18%5.06%

Texas Democratic primary results, 2012.svg
Texas results by county
  Barack Obama
  John Wolfe Jr.
  Bob Ely
  Tie
  No votes

The 2012 Texas Democratic Primary was held on May 29, 2012. Incumbent Barack Obama, running for the nomination without significant opposition, won the primary with 88.18% of the vote and was awarded all of Texas' 287 delegates to the 2012 Democratic National Convention.

This was the last time the Texas Democratic Party used the caucus system to allocate delegates.

2012 Texas Democratic presidential primary [5]
CandidateVotesPercentageDelegates
America Symbol.svg Barack Obama 520,41088.18%287
John Wolfe Jr. 29,8795.06%0
Darcy Richardson25,4304.31%0
Bob Ely 14,4452.45%0
Total:590,164100.0%287
Key:Withdrew prior to contest

Republican primary

Members of Texas' delegation at the 2012 Republican National Convention Texas Delegation at 2012 RNC.jpg
Members of Texas' delegation at the 2012 Republican National Convention
2012 Texas Republican presidential primary
Flag of Texas.svg
  2008 May 29, 2012 (2012-05-29) 2016  
  Mitt Romney by Gage Skidmore 6 cropped.jpg Ron Paul by Gage Skidmore 3 (crop 2).jpg Rick Santorum by Gage Skidmore.jpg
Candidate Mitt Romney Ron Paul Rick Santorum
Home state Massachusetts Texas Pennsylvania
Delegate count1051812
Popular vote1,001,387174,207115,584
Percentage69.09%12.02%7.97%

Texas Republican presidential primary, 2012.svg
Texas results by county
  Mitt Romney
  No votes
(Note: Italicization indicates a withdrawn candidacy)

The Republican primary was held May 29, 2012. [6] [7]

152 delegates were chosen, for a total of 155 delegates to go to the national convention.

The election was originally scheduled to take place on Super Tuesday, March 6. [8] Due to litigation over the state's redistricting following the 2010 United States Census, it was rescheduled for April 3. [9] [10] That date also became uncertain and the primary was expected to be held, at the earliest, in late May 2012, with both May 22 [8] and May 29 [11] being proposed. U.S. District Court judge Xavier Rodriguez, one of the three judges overseeing the litigation, had suggested a June 26 date for the election. [8] Finally, on March 1, 2012, the court issued an order setting the date of the primary to May 29, 2012. [6]

2012 Texas Republican presidential primary [12]
CandidateVotesPercentageDelegates
America Symbol.svg Mitt Romney 1,001,38769%105
Ron Paul 174,20712.02%18
Rick Santorum 115,5847.97%12
Newt Gingrich 68,2474.71%7
Uncommited60,6594.18%6
Michele Bachmann 12,0970.83%1
Jon Huntsman 8,6950.60%1
Buddy Roemer 4,7140.33%0
L. John Davis Jr.3,8870.27%0
Unpledged delegates:4
Superdelegates:3
Total:1,449,477100.0%155
Key:Withdrew prior to contest

General election

Candidate ballot access

Write-in candidate access:

Results

2012 United States presidential election in Texas [13]
PartyCandidateRunning mateVotesPercentageElectoral votes
Republican Mitt Romney Paul Ryan 4,569,84357.17%38
Democratic Barack Obama Joe Biden 3,308,12441.38%0
Libertarian Gary Johnson Jim Gray 88,5801.11%0
Green Jill Stein Cheri Honkala 24,6570.31%0
Constitution (Write-in) Virgil Goode Jim Clymer1,2870.02%0
Justice (Write-in) Rocky Anderson Luis J. Rodriguez 4260.01%0
America's Party (Write-in) Thomas Hoefling Jonathan D. Ellis3740.00%0
Other Write-ins3110.00%0
Socialist (Write-in) Stewart Alexander Alex Mendoza 1620.00%0
Reform (Write-in) Andre Barnett Kenneth Cross870.00%0
Totals7,993,851100.00%38
Voter turnout (Voting age population)43.73%

By county

CountyMitt Romney
Republican
Barack Obama
Democratic
Various candidates
Other parties
MarginTotal
#%#%#%#%
Anderson 12,26275.64%3,81323.52%1370.84%8,44952.12%16,212
Andrews 3,63981.19%79517.74%481.07%2,84463.45%4,482
Angelina 20,30371.47%7,83427.58%2690.95%12,46943.89%28,406
Aransas 6,83070.79%2,70428.03%1141.18%4,12642.76%9,648
Archer 3,60086.46%52512.61%390.93%3,07573.85%4,164
Armstrong 82888.56%9810.48%90.96%73078.08%935
Atascosa 7,46158.65%5,13340.35%1271.00%2,32818.30%12,721
Austin 9,26579.53%2,25219.33%1321.14%7,01360.20%11,649
Bailey 1,33973.73%46625.66%110.61%87348.07%1,816
Bandera 7,42678.60%1,86419.73%1581.67%5,56258.87%9,448
Bastrop 14,03357.32%9,86440.29%5842.39%4,16917.03%24,481
Baylor 1,29781.47%26716.77%281.76%1,03064.70%1,592
Bee 4,35655.29%3,45243.81%710.90%90411.48%7,879
Bell 49,57457.36%35,51241.09%1,3391.55%14,06216.27%86,425
Bexar 241,61746.94%264,85651.46%8,2371.60%-23,239-4.52%514,710
Blanco 3,63873.16%1,22024.53%1152.31%2,41848.63%4,973
Borden 32489.26%328.82%71.92%29280.44%363
Bosque 5,88580.00%1,36718.58%1041.42%4,51861.42%7,356
Bowie 24,86970.24%10,19628.80%3390.96%14,67341.44%35,404
Brazoria 70,86266.39%34,42132.25%1,4561.36%36,44134.14%106,739
Brazos 37,20966.49%17,47731.23%1,2762.28%19,73235.26%55,962
Brewster 1,97651.10%1,76545.64%1263.26%2115.46%3,867
Briscoe 57882.34%11716.67%70.99%46165.67%702
Brooks 50721.10%1,88678.49%100.41%-1,379-57.39%2,403
Brown 11,89585.29%1,90413.65%1481.06%9,99171.64%13,947
Burleson 4,67172.35%1,70526.41%801.24%2,96645.94%6,456
Burnet 12,84376.46%3,67421.87%2791.67%9,16954.59%16,796
Caldwell 6,02154.40%4,79143.29%2562.31%1,23011.11%11,068
Calhoun 4,14462.33%2,41036.25%941.42%1,73426.08%6,648
Callahan 4,37884.24%75114.45%681.31%3,62769.79%5,197
Cameron 26,09933.94%49,97564.99%8211.07%-23,876-31.05%76,895
Camp 2,88166.46%1,42832.94%260.60%1,45333.52%4,335
Carson 2,45188.23%29210.51%351.26%2,15977.72%2,778
Cass 8,76374.34%2,92424.80%1010.86%5,83949.54%11,788
Castro 1,47069.37%63029.73%190.90%84039.64%2,119
Chambers 11,78779.99%2,79018.93%1581.08%8,99761.06%14,735
Cherokee 12,09475.00%3,87524.03%1570.97%8,21950.97%16,126
Childress 1,66583.42%32016.03%110.55%1,34567.39%1,996
Clay 4,26684.36%74014.63%511.01%3,52669.73%5,057
Cochran 64970.77%25627.92%121.31%39342.85%917
Coke 1,21886.51%17912.71%110.78%1,03973.80%1,408
Coleman 3,01286.25%44212.66%381.09%2,57073.59%3,492
Collin 196,88864.86%101,41533.41%5,2641.73%95,47331.45%303,567
Collingsworth 96283.65%17715.39%110.96%78568.26%1,150
Colorado 6,02674.24%2,02925.00%620.76%3,99749.24%8,117
Comal 39,31876.30%11,45022.22%7611.48%27,86854.08%51,529
Comanche 3,94480.39%89018.14%721.47%3,05462.25%4,906
Concho 79379.22%19419.38%141.40%59959.84%1,001
Cooke 11,95183.28%2,24615.65%1541.07%9,70567.63%14,351
Coryell 11,22067.57%5,15831.06%2261.37%6,06236.51%16,604
Cottle 55574.90%18024.29%60.81%37550.61%741
Crane 98576.77%27521.43%231.80%71055.34%1,283
Crockett 95765.68%48032.94%201.38%47732.74%1,457
Crosby 1,13263.35%63935.76%160.89%49327.59%1,787
Culberson 29533.56%56864.62%161.82%-273-31.06%879
Dallam 1,24881.36%25316.49%332.15%99564.87%1,534
Dallas 295,81341.57%405,57156.99%10,2281.44%-109,758-15.42%711,612
Dawson 2,59171.14%1,01927.98%320.88%1,57243.16%3,642
Deaf Smith 3,04270.60%1,23928.75%280.65%1,80341.85%4,309
Delta 1,52475.52%45422.50%401.98%1,07053.02%2,018
Denton 157,57964.91%80,97833.35%4,2241.74%76,60131.56%242,781
DeWitt 5,12277.16%1,46722.10%490.74%3,65555.06%6,638
Dickens 79377.82%21621.20%100.98%57756.62%1,019
Dimmit 76226.12%2,14173.40%140.48%-1,379-47.28%2,917
Donley 1,28783.84%22614.72%221.44%1,06169.12%1,535
Duval 98022.56%3,33176.68%330.76%-2,351-54.12%4,344
Eastland 5,44483.82%97014.93%811.25%4,47468.89%6,495
Ector 24,01073.85%8,11824.97%3851.18%15,89248.88%32,513
Edwards 64272.62%23226.24%101.14%41046.38%884
Ellis 39,57472.94%13,88125.59%7991.47%25,69347.35%54,254
El Paso 57,15033.09%112,95265.40%2,6011.51%-55,802-32.31%172,703
Erath 10,32982.81%1,96515.75%1791.44%8,36467.06%12,473
Falls 3,35661.76%2,03337.41%450.83%1,32324.35%5,434
Fannin 8,16175.54%2,48623.01%1571.45%5,67552.53%10,804
Fayette 8,10676.61%2,31521.88%1601.51%5,79154.73%10,581
Fisher 1,09467.16%51231.43%231.41%58235.73%1,629
Floyd 1,52373.05%55126.43%110.52%97246.62%2,085
Foard 34870.30%14028.28%71.42%20842.02%495
Fort Bend 116,12652.91%101,14446.08%2,2191.01%14,9826.83%219,489
Franklin 3,44680.95%75117.64%601.41%2,69563.31%4,257
Freestone 5,64674.58%1,85024.44%740.98%3,79650.14%7,570
Frio 1,55939.29%2,37659.88%330.83%-817-20.59%3,968
Gaines 3,48485.69%53513.16%471.15%2,94972.53%4,066
Galveston 69,05962.74%39,51135.89%1,5081.37%29,54826.85%110,078
Garza 1,26380.96%27917.88%181.16%98463.08%1,560
Gillespie 10,30682.12%2,05516.37%1891.51%8,25165.75%12,550
Glasscock 52691.00%447.61%81.39%48283.39%578
Goliad 2,29466.34%1,12732.59%371.07%1,16733.75%3,458
Gonzales 4,21669.61%1,77729.34%641.05%2,43940.27%6,057
Gray 6,44387.20%88611.99%600.81%5,55775.21%7,389
Grayson 30,93673.20%10,67025.25%6581.55%20,26647.95%42,264
Gregg 28,74269.25%12,39829.87%3670.88%16,34439.38%41,507
Grimes 6,14171.40%2,33927.19%1211.41%3,80244.21%8,601
Guadalupe 33,11766.73%15,74431.73%7651.54%17,37335.00%49,626
Hale 6,49073.30%2,24325.33%1211.37%4,24747.97%8,854
Hall 83275.02%26523.90%121.08%56751.12%1,109
Hamilton 2,91882.15%59116.64%431.21%2,32765.51%3,552
Hansford 1,78891.13%1598.10%150.77%1,62983.03%1,962
Hardeman 1,17678.66%30220.20%171.14%87458.46%1,495
Hardin 17,74683.33%3,35915.77%1920.90%14,38767.56%21,297
Harris 586,07349.31%587,04449.39%15,4681.30%-971-0.08%1,188,585
Harrison 17,51266.92%8,45632.31%2020.77%9,05634.61%26,170
Hartley 1,70889.28%1849.62%211.10%1,52479.66%1,913
Haskell 1,42470.74%55327.47%361.79%87143.27%2,013
Hays 31,66153.65%25,53743.27%1,8133.08%6,12410.38%59,011
Hemphill 1,29886.02%19212.72%191.26%1,10673.30%1,509
Henderson 21,23176.85%6,10622.10%2901.05%15,12554.75%27,627
Hidalgo 39,86528.61%97,96970.32%1,4881.07%-58,104-41.71%139,322
Hill 9,13275.82%2,75222.85%1611.33%6,38052.97%12,045
Hockley 5,54677.74%1,48620.83%1021.43%4,06056.91%7,134
Hood 18,40981.53%3,84317.02%3271.45%14,56664.51%22,579
Hopkins 9,83677.13%2,77721.78%1401.09%7,05955.35%12,753
Houston 5,88071.59%2,26527.57%690.84%3,61544.02%8,214
Howard 6,45374.22%2,11024.27%1321.51%4,34349.95%8,695
Hudspeth 47154.58%37943.92%131.50%9210.66%863
Hunt 21,01174.91%6,67123.78%3671.31%14,34051.13%28,049
Hutchinson 6,80485.82%1,04513.18%791.00%5,75972.64%7,928
Irion 66884.77%11214.21%81.02%55670.56%788
Jack 2,58088.72%30310.42%250.86%2,27778.30%2,908
Jackson 3,90677.73%1,07021.29%490.98%2,83656.44%5,025
Jasper 9,95773.66%3,42325.32%1371.02%6,53448.34%13,517
Jeff Davis 71960.32%44036.91%332.77%27923.41%1,192
Jefferson 43,24248.73%44,66850.34%8250.93%-1,426-1.61%88,735
Jim Hogg 35621.36%1,30178.04%100.60%-945-56.68%1,667
Jim Wells 4,59841.18%6,49258.14%760.68%-1,894-16.96%11,166
Johnson 37,66177.11%10,49621.49%6811.40%27,16555.62%48,838
Jones 4,26276.56%1,22622.02%791.42%3,03654.54%5,567
Karnes 2,82567.50%1,32531.66%350.84%1,50035.84%4,185
Kaufman 24,84671.66%9,47227.32%3521.02%15,37444.34%34,670
Kendall 14,50881.58%3,04317.11%2321.31%11,46564.47%17,783
Kenedy 8450.30%8249.10%10.60%21.20%167
Kent 33582.72%6616.30%40.98%26966.42%405
Kerr 17,27478.95%4,33819.83%2671.22%12,93659.12%21,879
Kimble 1,66788.11%21711.47%80.42%1,45076.64%1,892
King 13995.86%53.45%10.69%13492.41%145
Kinney 88061.75%52236.63%231.62%35825.12%1,425
Kleberg 4,05845.56%4,75453.37%951.07%-696-7.81%8,907
Knox 1,16076.82%33221.99%181.19%82854.83%1,510
Lamar 12,82674.58%4,18124.31%1901.11%8,64550.27%17,197
Lamb 3,05874.75%99824.40%350.85%2,06050.35%4,091
Lampasas 5,62178.03%1,47920.53%1041.44%4,14257.50%7,204
La Salle 66940.64%96558.63%120.73%-296-17.99%1,646
Lavaca 6,79681.74%1,42817.18%901.08%5,36864.56%8,314
Lee 4,50772.27%1,63226.17%971.56%2,87546.10%6,236
Leon 5,81483.53%1,06215.26%841.21%4,75268.27%6,960
Liberty 17,32376.16%5,20222.87%2210.97%12,12153.29%22,746
Limestone 5,28869.92%2,20829.19%670.89%3,08040.73%7,563
Lipscomb 1,04489.38%11910.19%50.43%92579.19%1,168
Live Oak 3,15476.68%91922.34%400.98%2,23554.34%4,113
Llano 7,61079.62%1,82219.06%1261.32%5,78860.56%9,558
Loving 5484.38%914.06%11.56%4570.32%64
Lubbock 63,46969.61%26,27128.81%1,4441.58%37,19840.80%91,184
Lynn 1,43973.46%50625.83%140.71%93347.63%1,959
Madison 3,02875.17%96724.01%330.82%2,06151.16%4,028
Marion 2,73363.83%1,49534.91%541.26%1,23828.92%4,282
Martin 1,36884.24%24815.27%80.49%1,12068.97%1,624
Mason 1,56579.52%38019.31%231.17%1,18560.21%1,968
Matagorda 8,04066.27%3,98032.80%1130.93%4,06033.47%12,133
Maverick 2,17120.55%8,30378.60%890.85%-6,132-58.05%10,563
McCulloch 2,41980.82%53717.94%371.24%1,88262.88%2,993
McLennan 47,90364.26%25,69434.47%9441.27%22,20929.79%74,541
McMullen 43185.69%6713.32%50.99%36472.37%503
Medina 11,07969.03%4,78429.81%1861.16%6,29539.22%16,049
Menard 66578.33%17120.14%131.53%49458.19%849
Midland 35,68979.85%8,28618.54%7221.61%27,40361.31%44,697
Milam 5,48166.60%2,63632.03%1131.37%2,84534.57%8,230
Mills 1,88285.51%27912.68%401.81%1,60372.83%2,201
Mitchell 1,75675.82%53823.23%220.95%1,21852.59%2,316
Montague 6,54984.49%1,11614.40%861.11%5,43370.09%7,751
Montgomery 137,96979.51%32,92018.97%2,6341.52%105,04960.54%173,523
Moore 3,96879.60%96419.34%531.06%3,00460.26%4,985
Morris 3,23262.89%1,85836.15%490.96%1,37426.74%5,139
Motley 53889.67%559.17%71.16%48380.50%600
Nacogdoches 13,92567.42%6,46531.30%2631.28%7,46036.12%20,653
Navarro 10,84770.60%4,35028.31%1671.09%6,49742.29%15,364
Newton 4,11270.06%1,67728.57%801.37%2,43541.49%5,869
Nolan 3,28271.74%1,21626.58%771.68%2,06645.16%4,575
Nueces 48,96650.95%45,77247.63%1,3661.42%3,1943.32%96,104
Ochiltree 2,71990.85%2538.45%210.70%2,46682.40%2,993
Oldham 79090.91%718.17%80.92%71982.74%869
Orange 23,36676.12%6,80022.15%5291.73%16,56653.97%30,695
Palo Pinto 7,39379.06%1,81119.37%1471.57%5,58259.69%9,351
Panola 7,95077.71%2,21121.61%690.68%5,73956.10%10,230
Parker 39,24382.28%7,85316.47%5981.25%31,39065.81%47,694
Parmer 2,01178.74%52920.71%140.55%1,48258.03%2,554
Pecos 2,51260.53%1,59138.34%471.13%92122.19%4,150
Polk 14,07173.54%4,85925.39%2041.07%9,21248.15%19,134
Potter 18,91871.52%7,12626.94%4061.54%11,79244.58%26,450
Presidio 50427.74%1,28270.56%311.70%-778-42.82%1,817
Rains 3,27980.23%76118.62%471.15%2,51861.61%4,087
Randall 41,44783.40%7,57415.24%6751.36%33,87368.16%49,696
Reagan 67680.19%15818.74%91.07%51861.45%843
Real 1,23680.52%27718.05%221.43%95962.47%1,535
Red River 3,54969.94%1,48229.21%430.85%2,06740.73%5,074
Reeves 1,18841.29%1,65557.53%341.18%-467-16.24%2,877
Refugio 1,66362.12%99837.28%160.60%66524.84%2,677
Roberts 46892.13%336.50%71.37%43585.63%508
Robertson 4,41960.64%2,79838.40%700.96%1,62122.24%7,287
Rockwall 27,11375.81%8,12022.70%5311.49%18,99353.11%35,764
Runnels 3,10484.62%51914.15%451.23%2,58570.47%3,668
Rusk 13,92475.08%4,45124.00%1710.92%9,47351.08%18,546
Sabine 3,72781.41%80717.63%440.96%2,92063.78%4,578
San Augustine 2,46966.91%1,19332.33%280.76%1,27634.58%3,690
San Jacinto 7,10773.91%2,41025.06%991.03%4,69748.85%9,616
San Patricio 12,00559.79%7,85639.13%2171.08%4,14920.66%20,078
San Saba 1,90584.33%32314.30%311.37%1,58270.03%2,259
Schleicher 78777.38%22121.73%90.89%56655.65%1,017
Scurry 4,12482.04%83816.67%651.29%3,28665.37%5,027
Shackelford 1,21889.36%1319.61%141.03%1,08779.75%1,363
Shelby 6,87974.03%2,32224.99%910.98%4,55749.04%9,292
Sherman 90887.48%12111.66%90.86%78775.82%1,038
Smith 57,33172.02%21,45626.95%8141.03%35,87545.07%79,601
Somervell 2,87181.15%61317.33%541.52%2,25863.82%3,538
Starr 1,54713.02%10,26086.34%760.64%-8,713-73.32%11,883
Stephens 2,89284.76%47513.92%451.32%2,41770.84%3,412
Sterling 45992.91%316.28%40.81%42886.63%494
Stonewall 50775.11%16023.70%81.19%34751.41%675
Sutton 1,11074.45%36924.75%120.80%74149.70%1,491
Swisher 1,65572.91%57925.51%361.58%1,07647.40%2,270
Tarrant 348,92057.12%253,07141.43%8,8991.45%95,84915.69%610,890
Taylor 32,90476.06%9,75022.54%6091.40%23,15453.52%43,263
Terrell 35864.50%18433.15%132.35%17431.35%555
Terry 2,60270.15%1,05928.55%481.30%1,54341.60%3,709
Throckmorton 70086.10%10913.41%40.49%59172.69%813
Titus 6,08468.71%2,64829.91%1221.38%3,43638.80%8,854
Tom Green 26,87873.20%9,29425.31%5481.49%17,58447.89%36,720
Travis 140,15236.21%232,78860.14%14,1173.65%-92,636-23.93%387,057
Trinity 4,53772.77%1,61425.89%841.34%2,92346.88%6,235
Tyler 5,91077.21%1,66821.79%761.00%4,24255.42%7,654
Upshur 12,01579.37%2,97119.63%1521.00%9,04459.74%15,138
Upton 95373.31%33325.62%141.07%62047.69%1,300
Uvalde 4,52953.69%3,82545.35%810.96%7048.34%8,435
Val Verde 5,63546.64%6,28552.02%1611.34%-650-5.38%12,081
Van Zandt 15,79482.69%3,08416.15%2221.16%12,71066.54%19,100
Victoria 19,69268.25%8,80230.51%3591.24%10,89037.74%28,853
Walker 12,14064.97%6,25233.46%2931.57%5,88831.51%18,685
Waller 9,24458.13%6,51440.96%1440.91%2,73017.17%15,902
Ward 2,36672.91%84125.92%381.17%1,52546.99%3,245
Washington 10,85775.41%3,38123.48%1591.11%7,47651.93%14,397
Webb 11,07822.52%37,59776.42%5211.06%-26,519-53.90%49,196
Wharton 9,75069.21%4,23530.06%1020.73%5,51539.15%14,087
Wheeler 1,87888.25%23210.90%180.85%1,64677.35%2,128
Wichita 29,81272.68%10,52525.66%6811.66%19,28747.02%41,018
Wilbarger 2,95674.27%97124.40%531.33%1,98549.87%3,980
Willacy 1,41627.96%3,60071.09%480.95%-2,184-43.13%5,064
Williamson 97,00659.22%61,87537.77%4,9233.01%35,13121.45%163,804
Wilson 12,21871.01%4,82128.02%1660.97%7,39742.99%17,205
Winkler 1,31176.00%39823.07%160.93%91352.93%1,725
Wise 17,20782.95%3,22115.53%3171.52%13,98667.42%20,745
Wood 14,35181.63%3,05617.38%1740.99%11,29564.25%17,581
Yoakum 1,69879.79%40919.22%210.99%1,28960.57%2,128
Young 6,22585.09%99213.56%991.35%5,23371.53%7,316
Zapata 99728.14%2,52771.32%190.54%-1,530-43.18%3,543
Zavala 57415.71%3,04283.27%371.02%-2,468-67.56%3,653
Totals4,569,84357.13%3,308,12441.35%121,6901.52%1,261,71915.78%7,999,657
County Flips:
Democratic
Hold
Republican
Hold
Gain from Democratic Texas County Flips 2012.svg
County Flips:

Counties that flipped from Democratic to Republican

By congressional district

Romney won 25 of 36 congressional districts, including one that elected a Democrat. [14]

DistrictRomneyObamaRepresentative
1st 71.5%27.5% Louie Gohmert
2nd 63.95%35.56% Ted Poe
3rd 64.32%34.21% Sam Johnson
4th 74%24.8% Ralph Hall
5th 64.5%34.4% Jeb Hensarling
6th 57.9%40.8% Joe Barton
7th 59.9%38.6% John Culberson
8th 77%21.75% Kevin Brady
9th 21%78% Al Green
10th 59.12%38.8% Michael McCaul
11th 79.17%19.57% Mike Conaway
12th 66.84%31.68% Kay Granger
13th 80.2%18.5% Mac Thornberry
14th 59.34%39.5% Randy Weber
15th 41.55%57.44% Rubén Hinojosa
16th 34.5%64.2% Beto O'Rourke
17th 60.4%37.7% Bill Flores
18th 22.81%76.13% Sheila Jackson Lee
19th 73.6%25.0% Randy Neugebauer
20th 39.7%58.9% Joaquín Castro
21st 59.84%37.9% Lamar Smith
22nd 62.13%36.7% Pete Olson
23rd 50.74%48.1% Pete Gallego
24th 60.44%37.99% Kenny Marchant
25th 59.9%37.8% Roger Williams
26th 67.6%30.7% Michael Burgess
27th 60.53%38.19% Blake Farenthold
28th 38.7%60.3% Henry Cuellar
29th 32.99%65.9% Gene Green
30th 19.65%79.63% Eddie Bernice Johnson
31st 59.59%38.25% John Carter
32nd 57%41.48% Pete Sessions
33rd 27.1%71.95% Marc Veasey
34th 38.33%60.8% Filemon Vela Jr.
35th 34.63%63% Lloyd Doggett
36th 73.15%25.7% Steve Stockman

See also

Notes

  1. Counties where Goldwater exceeded Romney's King County proportion were Amite, Franklin, Grenada, Holmes, Leake, Noxubee and Yazoo.

Related Research Articles

<span class="mw-page-title-main">2012 United States presidential election in Iowa</span>

The 2012 United States presidential election in Iowa took place on November 6, 2012, as part of the 2012 United States presidential election in which all 50 states plus the District of Columbia participated. Iowa voters chose six electors to represent them in the Electoral College via a popular vote pitting incumbent Democratic President Barack Obama and his running mate, Vice President Joe Biden, against Republican challenger and former Massachusetts Governor Mitt Romney and his running mate, Congressman Paul Ryan.

<span class="mw-page-title-main">2012 United States presidential election in Colorado</span> Election in Colorado

The 2012 United States presidential election in Colorado took place on November 6, 2012, as part of the 2012 United States presidential election in which all 50 states plus the District of Columbia participated. Colorado voters chose nine electors to represent them in the Electoral College via a popular vote pitting incumbent Democratic President Barack Obama and his running mate, Vice President Joe Biden, against Republican challenger and former Massachusetts Governor Mitt Romney and his running mate, Congressman Paul Ryan. Obama and Biden carried Colorado with 51.45% of the popular vote to Romney's and Ryan's 46.09%, thus winning the state's nine electoral votes by a 5.36% margin.

<span class="mw-page-title-main">2012 United States presidential election in Minnesota</span>

The 2012 United States presidential election in Minnesota took place on November 6, 2012, as part of the 2012 United States presidential election in which all 50 states plus the District of Columbia participated. State voters chose ten electors to represent them in the Electoral College via a popular vote pitting incumbent Democratic President Barack Obama and his running mate, Vice President Joe Biden, against Republican challenger and former Massachusetts Governor Mitt Romney and his running mate, Congressman Paul Ryan.

<span class="mw-page-title-main">2012 United States presidential election in Washington (state)</span> Election in Washington

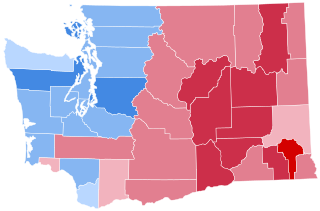
The 2012 United States presidential election in Washington took place on November 6, 2012, as part of the 2012 United States presidential election in which all 50 states plus the District of Columbia participated. Washington voters chose 12 electors to represent them in the Electoral College via a popular vote pitting incumbent Democratic President Barack Obama and his running mate, Vice President Joe Biden, against Republican challenger and former Massachusetts Governor Mitt Romney and his running mate, Congressman Paul Ryan.

<span class="mw-page-title-main">2012 United States presidential election in Arkansas</span>

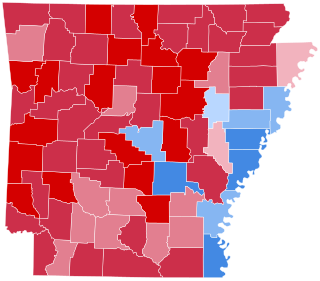
The 2012 United States presidential election in Arkansas took place on November 6, 2012, as part of the 2012 General Election in which all 50 states plus the District of Columbia participated. Arkansas voters chose six electors to represent them in the Electoral College via a popular vote pitting incumbent Democratic President Barack Obama and his running mate, Vice President Joe Biden, against Republican challenger and former Massachusetts Governor Mitt Romney and his running mate, Congressman Paul Ryan.

<span class="mw-page-title-main">2012 United States presidential election in California</span>

The 2012 United States presidential election in California took place on November 6, 2012, as part of the 2012 United States presidential election in which all 50 states plus the District of Columbia participated. California voters chose 55 electors, the most out of any state, to represent them in the Electoral College via a popular vote pitting incumbent Democratic President Barack Obama and his running mate, Vice President Joe Biden, against Republican challenger and former Massachusetts Governor Mitt Romney and his running mate, Congressman Paul Ryan.

<span class="mw-page-title-main">2012 United States presidential election in Connecticut</span> Election in Connecticut

The 2012 United States presidential election in Connecticut took place on November 6, 2012, as part of the 2012 United States presidential election in which all 50 states plus the District of Columbia participated. Connecticut voters chose seven electors to represent them in the Electoral College via a popular vote pitting incumbent Democratic President Barack Obama and his running mate, Vice President Joe Biden, against Republican challenger and former Massachusetts Governor Mitt Romney and his running mate, Congressman Paul Ryan. Obama and Biden carried Connecticut with 58.1% of the popular vote to Romney's and Ryan's 40.7%, thus winning the state's seven electoral votes. Romney managed to flip the traditionally Republican Litchfield County, which Obama had won in 2008. As of the 2020 United States presidential election, this was the last election that the Democratic presidential nominee won Windham County.

<span class="mw-page-title-main">2012 United States presidential election in Georgia</span> Election in Georgia

The 2012 United States presidential election in Georgia took place on November 6, 2012, as part of the 2012 General Election in which all 50 states plus the District of Columbia participated. Georgia voters chose 16 electors to represent them in the Electoral College via a popular vote pitting incumbent Democratic President Barack Obama and his running mate, Vice President Joe Biden, against Republican challenger and former Massachusetts Governor Mitt Romney and his running mate, Congressman Paul Ryan.

<span class="mw-page-title-main">2012 United States presidential election in Kentucky</span> Election in Kentucky

The 2012 United States presidential election in Kentucky took place on November 6, 2012, as part of the 2012 General Election in which all 50 states plus the District of Columbia participated. Kentucky voters chose eight electors to represent them in the Electoral College via a popular vote pitting incumbent Democratic President Barack Obama and his running mate, Vice President Joe Biden, against Republican challenger and former Massachusetts Governor Mitt Romney and his running mate, Congressman Paul Ryan.

<span class="mw-page-title-main">2012 United States presidential election in Massachusetts</span> Election in Massachusetts

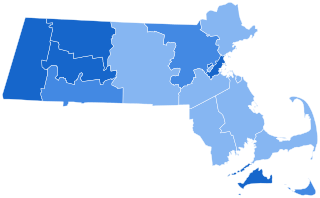
The 2012 United States presidential election in Massachusetts took place on November 6, 2012, as part of the 2012 United States presidential election in which all 50 states plus the District of Columbia participated. Massachusetts voters chose 11 electors to represent them in the Electoral College via a popular vote pitting incumbent Democratic President Barack Obama and his running mate, Vice President Joe Biden, against Republican challenger and former Massachusetts Governor Mitt Romney and his running mate, Congressman Paul Ryan.

<span class="mw-page-title-main">2012 United States presidential election in Mississippi</span> Election in Mississippi

The 2012 United States presidential election in Mississippi took place on November 6, 2012, as part of the 2012 general election in which all 50 states plus the District of Columbia participated. Mississippi voters chose six electors to represent them in the Electoral College via a popular vote pitting incumbent Democratic President Barack Obama and his running mate, Vice President Joe Biden, against Republican challenger and former Massachusetts Governor Mitt Romney and his running mate, Congressman Paul Ryan.

<span class="mw-page-title-main">2012 United States presidential election in New Mexico</span> Election in New Mexico

The 2012 United States presidential election in New Mexico took place on November 6, 2012, as part of the 2012 United States presidential election in which all 50 states plus the District of Columbia participated. This was the 25th U.S. presidential election in which New Mexico participated. New Mexico voters chose five electors to represent them in the Electoral College via a popular vote pitting incumbent Democratic President Barack Obama and his running mate, Vice President Joe Biden, against Republican challenger and former Massachusetts Governor Mitt Romney and his running mate, Congressman Paul Ryan.

<span class="mw-page-title-main">2012 United States presidential election in Idaho</span> Election in Idaho

The 2012 United States presidential election in Idaho took place on November 6, 2012, as part of the 2012 United States presidential election in which all 50 states plus the District of Columbia participated. Idaho voters chose four electors to represent them in the Electoral College via a popular vote pitting incumbent Democratic President Barack Obama and his running mate, Vice President Joe Biden, against Republican challenger and former Massachusetts Governor Mitt Romney and his running mate, Congressman Paul Ryan. Prior to the election, 17 news organizations considered this a state Romney would win, or otherwise considered as a safe red state. Romney and Ryan carried Idaho with 64.09% of the popular vote to Obama's and Biden's 32.40%, thus winning the state's four electoral votes. Romney's victory in Idaho made it his fourth strongest state in the 2012 election after Utah, Wyoming and Oklahoma. He improved on McCain's performance in 2008, expanding his margin from 25.3% to 31.69% and flipping Teton County which had previously voted for Obama.

<span class="mw-page-title-main">2012 United States presidential election in Ohio</span> Election in Ohio

The 2012 United States presidential election in Ohio took place on November 6, 2012, as part of the 2012 United States presidential election in which all 50 states plus the District of Columbia participated. Ohio voters chose 18 electors to represent them in the Electoral College via a popular vote pitting incumbent Democratic President Barack Obama and his running mate, Vice President Joe Biden, against Republican challenger and former Massachusetts Governor Mitt Romney and his running mate, Congressman Paul Ryan. This election continued Ohio's bellwether streak, as the state voted for the winner of the presidency in every election from 1964 to 2016.

<span class="mw-page-title-main">2012 United States presidential election in Oregon</span> Election in Oregon

The 2012 United States presidential election in Oregon took place on November 6, 2012, as part of the 2012 United States presidential election in which all 50 states plus the District of Columbia participated. Oregon voters chose seven electors to represent them in the Electoral College via a popular vote pitting incumbent Democratic President Barack Obama and his running mate, Vice President Joe Biden, against Republican challenger and former Massachusetts Governor Mitt Romney and his running mate, Representative Paul Ryan.

<span class="mw-page-title-main">2012 United States presidential election in Tennessee</span> Election in Tennessee

The 2012 United States presidential election in Tennessee took place on November 6, 2012, as part of the 2012 United States presidential election in which all 50 states plus the District of Columbia participated. Tennessee voters chose 11 electors to represent them in the Electoral College via a popular vote pitting incumbent Democratic President Barack Obama and his running mate, Vice President Joe Biden, against Republican challenger and former Massachusetts Governor Mitt Romney and his running mate, Congressman Paul Ryan.

<span class="mw-page-title-main">2012 United States presidential election in Utah</span> Election in Utah

The 2012 United States presidential election in Utah took place on November 6, 2012, as part of the 2012 United States presidential election in which all 50 states plus the District of Columbia participated. Utah voters chose six electors to represent them in the Electoral College via a popular vote pitting incumbent Democratic President Barack Obama and his running mate, Vice President Joe Biden, against Republican challenger and former Massachusetts Governor Mitt Romney and his running mate, Congressman Paul Ryan.

<span class="mw-page-title-main">2012 United States presidential election in Kansas</span> Election in Kansas

The 2012 United States presidential election in Kansas took place on November 6, 2012, as part of the 2012 United States presidential election in which all 50 states plus the District of Columbia participated. Kansas voters chose six electors to represent them in the Electoral College via a popular vote pitting incumbent Democratic President Barack Obama and his running mate, Vice President Joe Biden, against Republican challenger and former Massachusetts Governor Mitt Romney and his running mate, Congressman Paul Ryan. Romney and Ryan carried the state with 59.59 percent of the popular vote to Obama's and Biden's 38.00 percent, thus winning the state's six electoral votes.

<span class="mw-page-title-main">2012 United States presidential election in Wisconsin</span>

The 2012 United States presidential election in Wisconsin took place on November 6, 2012, as part of the 2012 United States presidential election in which all 50 states plus the District of Columbia participated. Wisconsin voters chose 10 electors to represent them in the Electoral College via a popular vote pitting incumbent Democratic President Barack Obama and his running mate, Vice President Joe Biden, against Republican challenger and former Massachusetts Governor Mitt Romney and his running mate, Congressman Paul Ryan.

<span class="mw-page-title-main">2012 United States presidential election in Alabama</span> Election in Alabama

The 2012 United States presidential election in Alabama took place on November 6, 2012, as part of the 2012 general election, in which all 50 states plus the District of Columbia participated. Alabama voters chose nine electors to represent them in the Electoral College via a popular vote pitting incumbent Democratic President Barack Obama and his running mate, Vice President Joe Biden, against Republican challenger and former Massachusetts Governor Mitt Romney and his running mate, Congressman Paul Ryan.

References

  1. "Turnout and Voter Registration Figures (1970-current)".
  2. "Texas". The New York Times. ISSN   0362-4331 . Retrieved December 2, 2020.
  3. See Dave Leip's Atlas of U.S. Presidential Elections; 2012 Presidential Election Statistics (and earlier years)
  4. "Fortune 500 2011: States: Texas Companies - FORTUNE on CNNMoney.com". money.cnn.com. Retrieved December 2, 2020.
  5. "2012 Democratic Party Primary Election, Texas Secretary of State" . Retrieved November 17, 2016.
  6. 1 2 Fernandez, Manny (March 2, 2012). "Texas: Primary Election Set for May 29". New York Times. Retrieved March 12, 2012.
  7. Perez, et al. v. Texas, no. 11-CV-360 (March 1, 2012 W.D. Texas), order, page 8
  8. 1 2 3 Weber, Paul J. (February 15, 2012). "Unsettled Texas primary may slip into May or later". Boston Globe. Associated Press. Retrieved February 22, 2012.[ permanent dead link ]
  9. "Primary and Caucus Printable Calendar". CNN. Retrieved January 12, 2012.
  10. "Presidential Primary Dates" (PDF). Federal Election Commission . Retrieved January 23, 2012.
  11. "Judge in Texas redistricting case tells Republican state officials to plan for May 29 primary". Washington Post. Associated Press. February 15, 2012. Archived from the original on February 16, 2012. Retrieved February 22, 2012.
  12. "2012 Republican Party Primary Election, Texas Secretary of State" . Retrieved November 17, 2016.
  13. "2012 General Election, Texas Secretary of State" . Retrieved November 18, 2016.
  14. "Daily Kos Elections' statewide election results by congressional and legislative districts". Daily Kos. Retrieved August 11, 2020.