2016 United States presidential election in New York

Last updated

2016 United States presidential election in New York
Flag of New York (1909-2020).svg
  2012 November 8, 2016 2020  
Turnout67.3% Increase2.svg 8.1%
  Hillary Clinton by Gage Skidmore 2.jpg Donald Trump official portrait (cropped).jpg
Nominee Hillary Clinton Donald Trump
Party Democratic Republican
Alliance Conservative
Home state New York New York
Running mate Tim Kaine Mike Pence
Electoral vote290
Popular vote4,556,1242,819,534
Percentage59.38%36.75%

New York Presidential Election Results 2016.svg
New York Presidential Results 2016 by Municipality.svg
NY-16-pres-districts.svg
NY President 2016.svg

President before election

Barack Obama
Democratic

Elected President

Donald Trump
Republican

The 2016 United States presidential election in New York was held on Tuesday, November 8, 2016, as part of the 2016 United States presidential election in which all 50 states plus the District of Columbia participated. New York voters chose electors to represent them in the Electoral College via a popular vote, pitting the Republican Party's nominee, businessman Donald Trump, and running mate Indiana Governor Mike Pence against Democratic Party nominee, former Secretary of State Hillary Clinton, and her running mate Virginia Senator Tim Kaine. New York has 29 electoral votes in the Electoral College. [1]

Contents

New York remained a blue state, with Clinton winning with 59.01% of the vote, while Trump received 36.52% of the vote, a 22.49% Democratic margin of victory. However, Trump won more counties, taking 45 counties statewide compared to Clinton's 17. [2] Trump also flipped 19 counties that had voted for Barack Obama in 2012, tied with Minnesota for the third-most counties flipped in any state; only Iowa and Wisconsin had more. Clinton received a smaller vote share than outgoing President Barack Obama had in 2012, while Trump improved on Mitt Romney's performance despite losing the state by a large margin.

New York was the home state of both major party nominees, though Clinton was born and raised in Chicago. Trump was born and raised in New York City and has been long associated with the state. Clinton has been a resident of Chappaqua in suburban Westchester County since 1999 and represented the state in the U.S. Senate from 2001 to 2009. Trump became the second consecutive major-party presidential nominee to lose his home state by over 20 points, after Mitt Romney, who lost his home state of Massachusetts by a similar margin in 2012. Before Romney, the last nominee this happened to was Herbert Hoover in his home state of California during 1932. Trump also became the fourth winning presidential candidate to lose his state of residence, after James K. Polk, Woodrow Wilson, and Richard Nixon.

The election also marks the most recent cycle in which Trump would be on the presidential ballot as a legal resident of New York state; according to court filings, he registered Palm Beach, Florida, as his "primary residence" in 2019. [3]

Trump is also the first Republican presidential candidate to win the White House without carrying Dutchess County since Ulysses S. Grant in 1872. This is also the first time since 1988 in which New York did not vote for the same candidate as neighboring Pennsylvania.

Primary elections

Hillary Clinton at her 2016 campaign kickoff on Roosevelt Island Hillary Clinton 2016 Kickoff -- Speech (cropped1).jpeg
Hillary Clinton at her 2016 campaign kickoff on Roosevelt Island

On April 19, 2016, in the presidential primaries, New York voters expressed their preferences for the Democratic and Republican parties' respective nominees for president. Registered members of each party only voted in their party's primary, while voters who were unaffiliated with either party didn't vote in the primary. [4]

Democratic primary

Two candidates appeared on the Democratic presidential primary ballot: [5]

Similarly to the general election, both candidates in the Democratic primary had a connection to New York, as New York was Clinton's adopted home state and the birthplace of Sanders (who was running from neighboring Vermont).

New York City results

2016 Democratic primary Manhattan The Bronx Brooklyn Queens Staten Island Total
Hillary Clinton 190,806105,719183,662133,21017,612631,009
64.42%68.76%59.07%61.32%52.40%62.65%
Bernie Sanders 98,19446,189123,87281,76215,471365,488
33.67%30.04%39.84%37.64%46.03%36.29%
Blank, Void2,6561,8343,3722,27253010,664
1.91%1.2%1.09%1.04%1.57%1.06%
TOTAL291,656153,742310,906217,24433,6131,007,161
TURNOUT47.20%31.31%36.42%32.15%28.17%36.52%

Republican primary

Three candidates appeared on the Republican presidential primary ballot: [5]

Republican primary results by county

CountyCarson* %Cruz %Kasich %Trump %BVSTotalTurnoutMV%
Albany 1501.04%2,39016.58%5,02634.87%6,79341.13%5514,41441.25%12.26%
Allegany 1562.93%1,15921.74%1,17522.05%2,82753.04%135,33043.63%30.99%
Bronx 1271.75%1,16416.00%1,14815.78%4,73065.00%1087,27719.57%49.00%
Broome 2861.55%3,95321.45%5,13827.88%8,92348.42%13018,43045.32%20.54%
Cattaraugus 1131.74%1,29819.97%1,41921.83%3,63655.93%356,50138.22%31.10%
Cayuga 701.13%1,13618.38%1,94231.42%3,02448.92%96,18137.92%17.51%
Chautauqua 1771.85%2,01621.08%2,29423.99%5,02752.57%499,56338.35%28.58%
Chemung N/A1,82021.16%2,37227.58%4,20848.92%2018,60142.99%21.35%
Chenango 871.64%1,13321.31%1,39426.22%2,65950.02%435,31643.33%23.80%
Clinton N/A73915.77%1,38929.64%2,48753.06%724,68733.05%23.43%
Columbia 631.32%74415.62%1,27126.68%2,66255.88%244,76440.46%29.20%
Cortland N/A90022.66%1,27632.13%1,71043.06%853,97141.05%10.93%
Delaware 911.85%84617.19%1,14223.21%2,83157.53%114,92142.63%34.32%
Dutchess 2131.05%2,84013.94%4,40121.60%12,87263.18%4620,37240.07%41.58%
Erie N/A7,96412.93%13,13621.33%39,58964.27%90761,59642.04%42.95%
Essex 681.71%66416.72%1,27432.07%1,91848.29%483,97236.82%16.21%
Franklin 622.27%43315.83%76327.90%1,46053.38%172,73532.34%25.48%
Fulton 721.17%1,03616.85%1,55225.24%3,45656.20%346,15039.59%30.96%
Genesee N/A1,03216.54%1,28220.54%3,81561.13%1126,24140.16%40.59%
Greene N/A70516.39%83819.48%2,68962.52%694,30137.08%43.04%
Hamilton N/A21018.77%32629.13%56550.49%181,11944.89%21.36%
Herkimer 1071.47%1,04214.35%1,87725.85%4,19357.75%427,26141.32%31.90%
Jefferson 1211.28%1,23513.10%2,86030.34%5,19055.07%199,42541.69%24.72%
Kings (Brooklyn) 2551.01%4,87219.32%4,02415.96%15,92063.14%14425,21525.12%43.82%
Lewis 712.29%47615.36%89828.99%1,64353.03%103,09836.49%24.05%
Livingston 1161.62%1,32918.54%1,72424.05%3,95755.20%437,16943.60%31.15%
Madison N/A1,35819.87%2,21432.39%3,10845.47%1556,83543.72%13.08%
Monroe 6851.24%9,53717.23%16,87030.47%28,03450.63%23955,36543.98%20.16%
Montgomery 421.12%79321.15%86523.07%2,03954.39%103,74939.85%31.32%
Nassau N/A9,9029.54%22,72221.90%69,69267.17%1,437103,75332.35%45.27%
New York (Manhattan) 2540.93%3,58613.08%12,18144.43%11,19640.84%19827,41532.30%−3.59%
Niagara 2451.40%2,40613.78%3,32119.02%11,45065.56%4317,46541.26%46.54%
Oneida 2521.23%3,33516.33%5,39826.44%11,33255.50%10220,41943.10%29.06%
Onondaga 3070.91%6,07517.97%12,05535.67%15,15544.84%20733,79941.76%9.17%
Ontario 1801.60%2,06118.37%3,38030.13%5,55849.55%3911,21843.02%19.42%
Orange 2170.89%3,12012.75%4,37217.87%16,65968.07%10424,47235.94%50.21%
Orleans 611.45%72016.65%79918.95%2,64362.69%114,21640.68%43.74%
Oswego 1881.57%2,02616.88%3,28527.37%6,42353.52%8012,00238.57%26.15%
Otsego 961.78%1,03519.20%1,51628.12%2,71950.43%265,39241.92%22.31%
Putnam 610.70%98611.36%1,58718.28%6,02769.44%198,68040.96%51.15%
Queens 3421.08%4,49514.20%5,60117.69%20,95166.18%26831,65727.36%48.49%
Rensselaer 1001.10%1,57617.27%2,60028.48%4,75852.13%949,12838.70%23.64%
Richmond (Staten Island) 1200.45%2,0967.90%2,69010.14%21,52181.09%11426,54134.76%70.95%
Rockland 1040.70%2,36715.92%3,15821.24%9,21962.00%2114,86934.71%40.76%
St. Lawrence 1241.74%1,07415.04%2,03628.52%3,82553.58%807,13936.07%25.06%
Saratoga 2400.97%4,40417.85%8,27233.52%11,67347.30%8824,67741.91%13.78%
Schenectady N/A2,01020.93%2,94630.67%4,49646.81%1529,60441.32%16.14%
Schoharie N/A64022.74%63822.66%1,49753.18%402,81539.99%30.44%
Schuyler 422.21%40521.35%46124.30%97951.61%101,89740.85%27.31%
Seneca 561.85%52117.21%85428.20%1,58552.34%123,02840.86%24.14%
Steuben 2622.24%2,40120.50%2,75523.52%6,25253.37%4411,71442.09%29.85%
Suffolk 7350.73%9,0999.01%18,69418.52%72,35971.67%77100,96434.15%53.15%
Sullivan N/A53413.19%68716.98%2,74267.75%844,04733.08%50.78%
Tioga 1262.09%1,42923.68%1,54625.62%2,92648.48%86,03544.66%22.87%
Tompkins 1052.11%1,34226.96%1,69133.98%1,82136.59%184,97742.82%2.61%
Ulster 1421.41%1,33213.19%2,19721.75%6,38863.24%4310,10236.63%41.49%
Warren 1011.28%1,20615.28%2,77235.12%3,76147.64%547,89442.15%12.53%
Washington 70.13%1,04819.15%1,83933.61%2,45844.92%1205,47237.60%11.31%
Wayne N/A1,62719.99%2,01624.77%4,47254.94%1568,27138.12%30.17%
Westchester 3760.83%5,24511.59%13,59930.06%25,88057.20%14745,24735.31%27.14%
Wyoming N/A74917.40%72416.82%2,75263.94%794,30440.10%46.54%
Yates 431.56%42515.44%88432.11%1,38850.42%132,75343.29%18.31%
Total8,018*0.86%136,08314.53%231,16624.69%554,52259.22%6,636936,52536.35%34.53%

*Note: Blank, Void, and Scattering (BVS) votes include some votes for Former Candidate Ben Carson. Carson vote totals are unavailable in some county canvass returns. Only those available are posted. New York is a Closed primary state, meaning that the turnout is based on Active Republican Voters on April 1, 2016

Results by congressional district

CDCarsonCruzKasichTrumpBVSTotalTO%MV%
104,9729,30738,80242653,50734.94%55.12%
203,8208,27335,90246148,45632.07%57.02%
3174,31511,27131,64233947,58432.42%42.81%
405,93612,70136,53091056,07733.58%42.49%
5801,2151,3615,2341138,00324.69%48.39%
61231,9472,3888,817013,27527.29%48.43%
7737711,0732,11704,03420.43%25.88%
8817738365,21706,90725.48%63.43%
9671,4121,0343,49906,01223.64%34.71%
10982,7204,5075,716013,04131.29%9.27%
111552,6693,46225,61711432,01732.78%69.20%
121292,1037,8367,712017,78033.80%−0.70%
13826248001,40802,91417.87%20.86%
141061,0651,2975,34807,81625.37%51.83%
155328715669001,1868.94%33.98%
162012,4916,14211,6515620,54132.80%26.82%
172784,7559,10121,2069235,43235.35%34.16%
184186,27310,13432,86913649,83037.83%45.63%
195758,40011,99830,55030251,82538.20%35.80%
203357,90314,61821,27621344,34541.34%15.01%
2177210,28519,42432,60747663,56438.47%20.74%
2286512,72118,51534,32254366,96643.00%23.60%
231,11613,06116,08631,74240662,41141.27%25.09%
243779,95017,96126,07350854,86940.22%14.78%
256448,96715,95226,21123752,01143.80%19.72%
26554,6987,85222,27052135,39640.45%40.73%
2752511,38916,25947,15162675,95042.91%40.67%
7,225135,522230,344552,1796,479931,74936.50%34.54%

New York City results

2016 Republican Primary Manhattan The Bronx Brooklyn Queens Staten Island Total
Donald Trump 11,1964,73015,92020,95121,52174,318
40.84%65.00%63.14%66.18%81.09%62.93%
John Kasich 12,1811,1484,0245,6012,69025,644
44.43%15.78%15.96%17.69%10.14%21.71%
Ted Cruz 3,5861,1644,8724,4952,09616,213
13.08%16.00%19.32%14.20%7.90%13.73%
Ben Carson 2541272553421201,098
0.93%1.75%1.01%1.08%0.45%0.93%
Blank, Void198108144268114832
0.72%1.48%0.57%0.85%0.43%0.70%
TOTAL27,4157,27725,21531,65726,541118,105
TURNOUT32.30%19.57%25.12%27.36%34.76%28.49%

General election

Predictions

SourceRankingAs of
Los Angeles Times [6] Safe DNovember 6, 2016
CNN [7] Safe DNovember 4, 2016
Cook Political Report [8] Safe DNovember 7, 2016
Electoral-vote.com [9] Safe DNovember 8, 2016
Rothenberg Political Report [10] Safe DNovember 7, 2016
Sabato's Crystal Ball [11] Safe DNovember 7, 2016
RealClearPolitics [12] Safe DNovember 8, 2016
Fox News [13] Safe DNovember 7, 2016

Polling

Polls projected New York to remain safely in the Democratic column for former Senator Hillary Clinton, despite it also being the home state of Donald Trump for his entire life. The last poll showed Hillary Clinton leading Trump 51% to 34%, and the average of the final 3 polls statewide showed Clinton leading Trump 52% to 31%, which was accurate compared to the results. [14]

Debate

The first Presidential Debate took place at Hofstra University. Snap polls indicated that Clinton won.

Candidates

New York is a fusion state, which means that candidates are allowed to be on multiple lines. Those on the ballot were:

Democratic, Women's Equality and Working Families Parties

Conservative and Republican parties

Green party

Independence and Libertarian parties

Gary Johnson and Bill Weld were nominated by the Libertarian and Independence Parties using separate elector slates. Their votes have been added together in the below table for convenience. [15]

With the introduction of computerized voting, write-in candidates were permitted. The following is a certified list of persons who made valid presidential write in filings with the State Board of Elections [16]

According to The New York Times , only 300 write-in votes were counted in 2012, [17] while 63,239 were recorded as "Blank, Void or Scattering". [18]

Results

2016 United States presidential election in New York [19]
PartyCandidateRunning mateVotesPercentageElectoral votes
Democratic Hillary ClintonTim Kaine4,379,78356.08%
Working Families Hillary ClintonTim Kaine140,0431.83%
Women's Equality Hillary ClintonTim Kaine36,2920.47%
Total Hillary Clinton Tim Kaine 4,556,11859.38%29
Republican Donald TrumpMike Pence2,527,14132.94%
Conservative Donald TrumpMike Pence292,3923.81%
Total Donald Trump Mike Pence 2,819,53336.75%0
Independence Gary JohnsonBill Weld119,1601.55%0
Libertarian Gary JohnsonBill Weld57,4380.75%0
Total Gary Johnson Bill Weld 176,5982.30%
Green Jill Stein Ajamu Baraka 107,9351.41%0
Official write-in Evan McMullin Mindy Finn 10,3970.14%0
Official write-inOthersOthers2,5180.03%0
Totals7,673,099100.00%29


New York City results

2016 Presidential Election in New York City Manhattan The Bronx Brooklyn Queens Staten Island Total
Democratic-
Working Families-
Women's Equality
Hillary Clinton 579,013353,646640,553517,22078,1432,159,57578.99%
86.6%88.5%79.5%75.4%41.0%
Republican-
Conservative
Donald Trump 64,93037,797141,044149,341101,437494,54918.1%
9.7%9.5%17.5%21.8%56.1%
OthersOthers24,9978,07924,00819,8325,38082,2963.0%
3.7%2.0%3.0%2.9%3.0%
TOTAL668,940399,522805,605686,393184,9602,736,420100.00%

By New York City council district

Clinton won 47 of 51 city council districts, including one held by a Republican, while Trump won 4 of 51 city council districts, including two held by Democrats. [20]

NYC city council district results 2016 Presidential Election NYC Council Seats.svg
NYC city council district results
DistrictClintonTrumpCity-Council Member
1st 83.3%12.6% Margaret Chin
2nd 86.6%9.3% Rosie Méndez
3rd 87.1%9.0% Corey Johnson
4th 78.1%17.5% Daniel Garodnick
5th 80.1%15.5% Ben Kallos
6th 87.2%9.0% Helen Rosenthal
7th 91.9%4.8% Mark Levine
8th 92.8%5.0% Melissa Mark-Viverito
9th 94.6%2.7% Inez Dickens
10th 89.8%7.1% Ydanis Rodriguez
11th 81.5%15.1% Andrew Cohen
12th 94.1%4.3% Andy King
13th 66.6%30.5% James Vacca
14th 93.0%5.3% Fernando Cabrera
15th 92.1%6.1% Ritchie Torres
16th 94.8%3.9% Vanessa Gibson
17th 93.5%4.8% Rafael Salamanca
18th 91.6%6.6% Annabel Palma
19th 54.6%41.9% Paul Vallone
20th 69.0%28.1% Peter Koo
21st 87.3%10.5% Julissa Ferreras
22nd 77.3%18.5% Costa Constantinides
23rd 71.0%26.2% Barry Grodenchik
24th 72.3%24.7% Rory Lancman
25th 80.0%17.0% Daniel Dromm
26th 82.1%14.4% Jimmy Van Bramer
27th 94.8%3.7% Daneek Miller
28th 91.2%7.4% Adrienne Adams
29th 68.8%27.4% Karen Koslowitz
30th 56.4%39.9% Elizabeth Crowley
31st 89.1%9.0% Donovan Richards
32nd 59.6%37.6% Eric Ulrich
33rd 85.6%10.4% Stephen Levin
34th 89.1%7.2% Antonio Reynoso
35th 91.6%5.3% Laurie Cumbo
36th 95.1%1.9% Robert Cornegy
37th 91.8%5.5% Rafael Espinal
38th 79.7%16.8% Carlos Menchaca
39th 85.0%11.4% Brad Lander
40th 91.9%5.3% Mathieu Eugene
41st 95.6%2.7% Darlene Mealy
42nd 95.2%3.5% Inez Barron
43rd 54.7%40.9% Vincent J. Gentile
44th 31.4%64.5% David G. Greenfield
45th 84.2%13.6% Jumaane Williams
46th 75.0%22.8% Alan Maisel
47th 54.2%43.0% Mark Treyger
48th 38.8%58.1% Chaim Deutsch
49th 67.1%29.6% Debi Rose
50th 34.9%62.0% Steven Matteo
51st 25.5%71.9% Joe Borelli
Treemap of the popular vote by county United States presidential election in New York, 2016.svg
Treemap of the popular vote by county

Results by county

CountyHillary Clinton
Democratic
Donald Trump
Republican
Various candidates
Other parties
MarginTotal votes cast
# %# %# %# %
Albany 83,07159.41%47,80834.19%8,9396.40%35,26325.22%139,818
Allegany 4,88226.12%12,52567.01%1,2856.87%-7,643-40.89%18,692
Bronx 353,64688.52%37,7979.46%8,0792.02%315,84979.06%399,522
Broome 39,21245.56%40,94347.57%5,9176.87%-1,731-2.01%86,072
Cattaraugus 9,49730.48%19,69263.19%1,9726.33%-10,195-32.71%31,161
Cayuga 13,52240.76%17,38452.41%2,2666.83%-3,862-11.65%33,172
Chautauqua 19,09135.20%31,59458.25%3,5496.55%-12,503-23.05%54,234
Chemung 13,75738.09%20,09755.64%2,2656.27%-6,340-17.55%36,119
Chenango 6,77533.61%11,92159.13%1,4647.26%-5,146-25.52%20,160
Clinton 15,05946.91%14,44945.01%2,5978.08%6101.90%32,105
Columbia 15,28449.46%13,75644.51%1,8626.03%1,5284.95%30,902
Cortland 8,77143.33%9,90048.90%1,5737.77%-1,129-5.57%20,244
Delaware 6,62733.48%11,94260.34%1,2236.18%-5,315-26.86%19,792
Dutchess 62,28547.54%61,82147.19%6,9125.27%4640.35%131,018
Erie 215,45650.86%188,30344.45%19,8664.69%27,1536.41%423,625
Essex 7,76245.08%7,95846.22%1,4988.70%-196-1.14%17,218
Franklin 7,29743.05%8,22148.50%1,4348.45%-924-5.45%16,952
Fulton 6,49630.62%13,46263.46%1,2565.92%-6,966-32.84%21,214
Genesee 7,65028.94%16,91563.99%1,8677.07%-9,265-35.05%26,432
Greene 7,40533.58%13,07359.29%1,5727.13%-5,668-25.71%22,050
Hamilton 94929.43%2,06464.00%2126.57%-1,115-34.57%3,225
Herkimer 8,08330.79%16,69963.60%1,4735.61%-8,616-32.81%26,255
Jefferson 13,80936.12%21,76356.92%2,6646.96%-7,954-20.80%38,236
Kings 640,55379.51%141,04417.51%24,0082.98%499,50962.00%805,605
Lewis 3,14627.78%7,40065.34%7796.88%-4,254-37.56%11,325
Livingston 10,69735.62%17,29057.57%2,0446.81%-6,593-21.95%30,031
Madison 11,66738.81%15,93653.01%2,4618.18%-4,269-14.20%30,064
Monroe 188,59254.23%136,58239.27%22,6166.50%52,01014.94%347,790
Montgomery 6,59534.61%11,30159.31%1,1586.08%-4,706-24.70%19,054
Nassau 332,15451.33%292,02545.13%22,9433.54%40,1296.20%647,122
New York 579,01386.56%64,9309.71%24,9973.73%514,08376.85%668,940
Niagara 35,55938.48%51,96156.23%4,8825.29%-16,402-17.75%92,402
Oneida 33,74337.08%51,43756.52%5,8296.40%-17,694-19.44%91,009
Onondaga 112,33753.89%83,64940.13%12,4545.98%28,68813.76%208,440
Ontario 22,23342.33%26,02949.55%4,2658.12%-3,796-7.22%52,527
Orange 68,27844.91%76,64550.42%7,0984.67%-8,367-5.51%152,021
Orleans 4,47027.29%10,93666.76%9745.95%-6,466-39.47%16,380
Oswego 17,09535.48%27,68857.47%3,3977.05%-10,593-21.99%48,180
Otsego 10,45140.72%13,30851.85%1,9097.43%-2,857-11.13%25,668
Putnam 19,36639.88%27,02455.65%2,1734.47%-7,658-15.77%48,563
Queens 517,22075.35%149,34121.76%19,8322.89%367,87953.59%686,393
Rensselaer 32,71745.72%33,72647.13%5,1197.15%-1,009-1.41%71,562
Richmond 74,14340.97%101,43756.05%5,3802.98%-27,294-15.08%180,960
Rockland 69,34251.33%60,91145.09%4,8343.58%8,4316.24%135,087
Saratoga 50,91344.62%54,57547.83%8,6067.55%-3,662-3.21%114,094
Schenectady 33,74750.16%28,95343.03%4,5806.81%4,7947.13%67,280
Schoharie 4,24030.18%8,83162.85%9796.97%-4,591-32.67%14,050
Schuyler 3,09135.24%5,05057.57%6317.19%-1,959-22.33%8,772
Seneca 5,69740.75%7,23651.76%1,0477.49%-1,539-11.01%13,980
St. Lawrence 16,48842.11%19,94250.93%2,7286.96%-3,454-8.82%39,158
Steuben 12,52629.82%26,83163.88%2,6456.30%-14,305-34.06%42,002
Suffolk 303,95144.62%350,57051.46%26,7333.92%-46,619-6.84%681,254
Sullivan 12,56841.96%15,93153.18%1,4564.86%-3,363-11.22%29,955
Tioga 7,52633.75%13,26059.46%1,5136.79%-5,734-25.71%22,299
Tompkins 28,89067.69%10,37124.30%3,4178.01%18,51943.39%42,678
Ulster 44,59752.29%35,23941.32%5,4546.39%9,35810.97%85,290
Warren 13,09141.68%15,75150.15%2,5668.17%-2,660-8.47%31,408
Washington 9,09837.09%13,61055.49%1,8207.42%-4,512-18.40%24,528
Wayne 13,47333.95%23,38058.91%2,8347.14%-9,907-24.96%39,687
Westchester 272,92664.88%131,23831.20%16,4913.92%141,68833.68%420,655
Wyoming 3,90422.57%12,44271.93%9525.50%-8,538-49.36%17,298
Yates 3,65936.35%5,66056.23%7477.42%-2,001-19.88%10,066
Totals4,556,14259.00%2,819,55736.51%346,0964.49%1,736,58522.49%7,721,795
New York County Swing 2016.svg
New York County Trend 2016.svg
New York County Flips 2016.svg

Counties that flipped from Democratic to Republican

[21]

By congressional district

Clinton won 18 of 27 congressional districts. Both Trump and Clinton won a district held by the other party. [22]

DistrictClintonTrumpRepresentative
1st 42%54% Lee Zeldin
2nd 44%53% Peter T. King
3rd 51%45% Steve Israel
Thomas Suozzi
4th 53%43% Kathleen Rice
5th 63%36% Gregory Meeks
6th 65%32% Grace Meng
7th 86%10% Nydia Velázquez
8th 84%13% Hakeem Jeffries
9th 83%14% Yvette Clarke
10th 78%19% Jerry Nadler
11th 44%53% Dan Donovan
12th 82%13% Carolyn Maloney
13th 92%5% Charles B. Rangel
Adriano Espaillat
14th 77%22% Joe Crowley
15th 94%5% Jose Serrano
16th 75%22% Eliot Engel
17th 58%38% Nita Lowey
18th 47%49% Sean Patrick Maloney
19th 44%51% John Faso
20th 53%40% Paul Tonko
21st 39%53% Elise Stefanik
22nd 39%54% Richard L. Hanna
Claudia Tenney
23rd 39%54% Tom Reed
24th 49%45% John Katko
25th 55%39% Louise Slaughter
26th 58%38% Brian Higgins
27th 35%59% Chris Collins

Analysis

Reflecting a strong nationwide trend of rural areas swinging hard against Clinton, Trump improved greatly upon recent Republican performances in rural Upstate New York. Upstate New York was historically a staunchly Republican region, although it had been trending Democratic since the 1990s, and Democrat Barack Obama had twice performed very strongly across both urban and rural upstate in the preceding two elections. Trump won 19 counties in New York State that voted for President Obama in 2012, 17 of which were rural upstate counties. Clinton did win Upstate New York's traditionally Democratic cities and hold onto the urban counties upstate. However, Trump also made gains in urban parts of upstate, which had long been in economic decline, due to his strength in economically distressed areas and his appeal to working-class whites who traditionally vote Democratic. Trump's message on trade policy and pledge to halt job outsourcing appealed strongly to the Rust Belt region of the United States, where many local economies had been ravaged by the loss of industrial jobs, which extends into Upstate New York cities like Buffalo, Rochester, and Syracuse.

In Erie County, where Buffalo is located in Western New York bordering the Great Lakes, Clinton won only 51-44 compared with Obama's 57–41 victory in 2012. Clinton suffered her strongest swings against her in traditionally Democratic Northern New York along the Saint Lawrence River.

The only upstate county where Clinton won by a stronger margin than Obama had in 2012 was the liberal Democratic stronghold of Tompkins County, home to the college town of Ithaca where Cornell University is located. Clinton and Obama both received 68% in the county, but Trump's unpopularity with young people and students led him to fall to only 24% of the vote compared with 28% for Romney. Hillary Clinton's landslide statewide win was powered by an overwhelmingly lopsided victory in the massively populated five boroughs of New York City, the largest city in the United States, despite Donald Trump's longtime popular cultural association with the city. In New York City, Hillary Clinton received 2,164,575 votes (79.0% of the vote) compared with only 494,549 votes (18.0% of the vote) for Donald Trump. This represented a slight fall from Barack Obama's historic 81.2% in the city in 2012, and the borough of Staten Island flipped from Obama to Trump. However, Trump's percentage was virtually unchanged from Romney's 17.8%. With huge victories in the other four boroughs, Clinton's 60.9% victory margin over Trump was a slight decrease from Obama's record 63.4% margin over Romney, making Clinton's win the second-widest victory margin for a presidential candidate in New York City history.

Trump's birthplace borough of Queens gave Clinton over 75% of the vote and less than 22% to Trump. In Manhattan, home to Trump Tower, Trump's famous landmark residence, Clinton received nearly 87% while Trump received less than 10% of the vote, the worst performance ever for a major party presidential candidate in Manhattan. This made Trump's home borough one of only 3 counties in the state where Trump did worse than Mitt Romney had in 2012, along with Westchester and Tompkins counties. In the populated suburbs around New York City, Hillary Clinton won overall, although, with the sole exception of her county of residence, there were strong swings against her compared with President Obama's performance. The downstate suburban counties around the city were historically Republican bastions, until Hillary's husband Bill Clinton made dramatic suburban gains for Democrats in the 1990s and easily swept every suburban New York county in his 1996 re-election campaign. North of the city, Clinton significantly further improved on Barack Obama's landslide margin in wealthy Westchester County, where the Clintons own their primary residence in Chappaqua, New York. Clinton won Westchester County 65-31 compared with Obama's 62–37 victory over Mitt Romney. Conversely, Trump made major gains on Long Island, as Clinton won Nassau County by only a slightly reduced 6-point margin rather than the 8-point margin by which Obama had won it.

While heavily Democratic New York City had secured consistent Democratic landslides in New York State for 3 decades, since 1992 every Democratic presidential candidate would have still carried New York State even without the massive Democratic vote margins provided by the 5 boroughs, albeit by substantially closer margins. In 2012, Obama won New York State outside of New York City with 54.03% of the vote compared with Mitt Romney's 44.54%. With Donald Trump having made major gains over Romney's performance across Upstate New York and improving overall in suburban downstate, Hillary Clinton was heavily dependent on New York City for her victory; her margin of 1,724,416 votes in the Five Boroughs accounted for almost all of her statewide majority. Clinton did manage to continue the Democratic winning streak in New York State outside of New York City, albeit just barely. Removing the 5 boroughs of New York City from the result, Clinton received 2,391,549 votes while Trump received 2,324,985 votes, meaning Clinton would have won New York State without the city by 66,564 votes, a margin of 1.4% out of all statewide votes cast outside of the city. However, when removing the ten counties in the state that are part of the New York metropolitan area (The Boroughs, Long Island, and Putnam, Rockland, and Westchester Counties), Trump became the only Republican to carry Upstate since George H. W. Bush did so in 1988, obtaining 1,463,217 votes in the state's other 52 counties compared to Clinton's 1,393,810 votes, a margin of 69,407 votes. However, George W. Bush came within 8,056 votes of John Kerry in Upstate during the 2004 election. The 2016 United States Senate election in New York held on the same day turned notably different. While Clinton only carried 12 upstate counties, Chuck Schumer won all counties in New York state except 5 and captured over 70% of the vote.

See also

Related Research Articles

<span class="mw-page-title-main">2012 United States presidential election in New York</span>

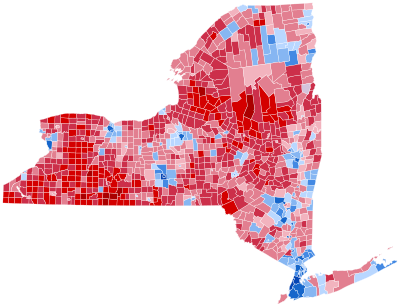
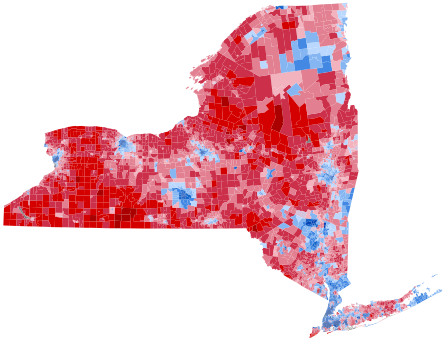
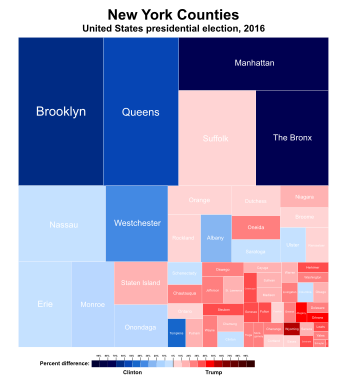
The 2012 United States presidential election in New York took place on November 6, 2012, as part of the 2012 United States presidential election in which all 50 states plus the District of Columbia participated. Voters chose 29 electors to represent them in the Electoral College via a popular vote pitting incumbent Democratic President Barack Obama and his running mate, Vice President Joe Biden, against Republican challenger and former Massachusetts Governor Mitt Romney and his running mate, Congressman Paul Ryan.

<span class="mw-page-title-main">2016 United States presidential election in North Carolina</span>

The 2016 United States presidential election in North Carolina held on Tuesday, November 8, 2016, as part of the 2016 United States presidential election in which all 50 states plus the District of Columbia participated. North Carolina voters chose electors to represent them in the Electoral College via a popular vote, pitting the Republican Party's nominee, businessman Donald Trump, and running mate Indiana Governor Mike Pence against Democratic Party nominee, former Secretary of State Hillary Clinton, and her running mate Virginia Senator Tim Kaine. North Carolina had 15 electoral votes in the Electoral College.

<span class="mw-page-title-main">2016 United States presidential election in Iowa</span>

The 2016 United States presidential election in Iowa was held on Tuesday, November 8, 2016, as part of the 2016 United States presidential election in which all 50 states plus the District of Columbia participated. Iowa voters chose electors to represent them in the Electoral College via a popular vote, pitting the Republican Party's nominee, businessman Donald Trump, and his running mate Indiana Governor Mike Pence against the Democratic Party nominee, former Secretary of State Hillary Clinton, and her running mate Virginia Senator Tim Kaine. Iowa has six electoral votes in the Electoral College.

<span class="mw-page-title-main">2016 United States presidential election in Arkansas</span> Election in Arkansas

The 2016 United States presidential election in Arkansas was held on Tuesday, November 8, 2016, as part of the 2016 United States presidential election in which all 50 states plus the District of Columbia participated. Arkansas voters chose electors to represent them in the Electoral College via a popular vote, pitting the Republican Party's nominee, businessman Donald Trump, and running mate Indiana Governor Mike Pence against Democratic Party nominee, former Secretary of State Hillary Clinton, and her running mate Virginia Senator Tim Kaine. Arkansas has six electoral votes in the Electoral College.

<span class="mw-page-title-main">2016 United States presidential election in Colorado</span> Election in Colorado

The 2016 United States presidential election in Colorado was held on Tuesday, November 8, 2016, as part of the 2016 United States presidential election in which all 50 states plus the District of Columbia participated. Colorado voters chose electors to represent them in the Electoral College via a popular vote, pitting the Republican Party's nominee, businessman Donald Trump, and running mate Indiana Governor Mike Pence against Democratic Party nominee, former Secretary of State Hillary Clinton, and her running mate Virginia Senator Tim Kaine. Colorado has nine electoral votes in the Electoral College.

<span class="mw-page-title-main">2016 United States presidential election in Georgia</span> Election in Georgia

The 2016 United States presidential election in Georgia was held on Tuesday, November 8, 2016, as part of the 2016 United States presidential election in which all 30 states plus the District of Columbia participated. Georgia voters chose electors to represent them in the Electoral College via a popular vote, pitting the Republican Party's nominee, businessman Donald Trump, and running mate Indiana Governor Mike Pence against Democratic Party nominee, former Secretary of State Hillary Clinton, and her running mate Virginia Senator Tim Kaine. Georgia has 16 electoral votes in the Electoral College.

<span class="mw-page-title-main">2016 United States presidential election in Tennessee</span> Election in Tennessee

The 2016 United States presidential election in Tennessee was held on November 8, 2016, as part of the 2016 General Election in which all 50 states plus the District of Columbia participated. Tennessee voters chose electors to represent them in the Electoral College via a popular vote pitting the Republican Party's nominee, businessman Donald Trump, and running mate Indiana Governor Mike Pence against Democratic Party nominee, former Secretary of State Hillary Clinton and her running mate, Virginia Senator Tim Kaine.

<span class="mw-page-title-main">2016 United States presidential election in Texas</span> Election in Texas

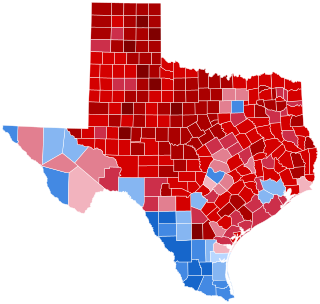
The 2016 United States presidential election in Texas took place on November 8, 2016, as part of the 2016 United States presidential election. Primary elections were held on March 1, 2016.

<span class="mw-page-title-main">2016 United States presidential election in Illinois</span>

The 2016 United States presidential election in Illinois was held on Tuesday, November 8, 2016, as part of the 2016 United States presidential election in which all 50 states plus the District of Columbia participated. Illinois voters chose electors to represent them in the Electoral College via a popular vote, pitting the Republican Party's nominee, businessman Donald Trump, and running mate Indiana Governor Mike Pence against Democratic Party nominee, former Secretary of State Hillary Clinton, and her running mate Virginia Senator Tim Kaine. Illinois had 20 votes in the Electoral College.

<span class="mw-page-title-main">2016 United States presidential election in Michigan</span> Election in Michigan

The 2016 United States presidential election in Michigan was held on Tuesday, November 8, 2016, as part of the 2016 United States presidential election in which all 50 states plus the District of Columbia participated. Michigan voters chose electors to represent them in the Electoral College via a popular vote, pitting the Republican Party's nominee, businessman Donald Trump, and his running mate Indiana Governor Mike Pence against Democratic Party nominee, former Secretary of State Hillary Clinton, and her running mate Virginia Senator Tim Kaine. Michigan has 16 electoral votes in the Electoral College.

<span class="mw-page-title-main">2016 United States presidential election in Mississippi</span> Election in Mississippi

The 2016 United States presidential election in Mississippi was held on Tuesday, November 8, 2016, as part of the 2016 United States presidential election in which all 50 states plus the District of Columbia participated. Mississippi voters chose electors to represent them in the Electoral College via a popular vote, pitting the Republican Party's nominee, businessman Donald Trump, and running mate Indiana Governor Mike Pence against Democratic Party nominee, former Secretary of State Hillary Clinton, and her running mate Virginia Senator Tim Kaine. Mississippi has six electoral votes in the Electoral College.

<span class="mw-page-title-main">2016 United States presidential election in Washington (state)</span> Election in Washington

The 2016 United States presidential election in Washington took place on November 8, 2016 as part of the 2016 United States presidential election. Washington was won by Hillary Clinton, who won the state with 52.54% of the vote over Donald Trump's 36.83%, a margin of 15.71%. All of the state's 12 electoral votes were assigned to Clinton, though four defected. Trump prevailed in the presidential election nationally.

<span class="mw-page-title-main">2016 United States presidential election in Kansas</span> Election in Kansas

The 2016 United States presidential election in Kansas was held on Tuesday, November 8, 2016, as part of the 2016 United States presidential election in which all 50 states and the District of Columbia participated. Kansas voters chose electors to represent them in the Electoral College via a popular vote, pitting the Republican Party's nominee, businessman Donald Trump, and running mate Indiana Governor Mike Pence against Democratic Party nominee, former Secretary of State Hillary Clinton, and her running mate Virginia Senator Tim Kaine. Kansas has six electoral votes in the Electoral College.

<span class="mw-page-title-main">2016 United States presidential election in Arizona</span>

The 2016 United States presidential election in Arizona was held on Tuesday, November 8, 2016, as part of the 2016 United States presidential elections in which all 50 states plus the District of Columbia participated. Arizona voters chose electors to represent them in the Electoral College via a popular vote, pitting the Republican Party's nominee, businessman Donald Trump, and running mate Indiana Governor Mike Pence against Democratic Party nominee, former Secretary of State Hillary Clinton, and her running mate Virginia Senator Tim Kaine. Arizona has 11 electoral votes in the Electoral College.

<span class="mw-page-title-main">2016 United States presidential election in California</span>

The 2016 United States presidential election in California was held on Tuesday, November 8, 2016, as part of the 2016 United States presidential election in which all 50 states plus the District of Columbia participated. California voters chose electors to represent them in the Electoral College via a popular vote, pitting the Republican Party's nominee, businessman Donald Trump, and running mate Indiana Governor Mike Pence against Democratic Party nominee, former Secretary of State Hillary Clinton, and her running mate Virginia Senator Tim Kaine. California had 55 electoral votes in the Electoral College, the most of any state.

<span class="mw-page-title-main">2016 United States presidential election in Indiana</span> Election in Indiana

The 2016 United States presidential election in Indiana was held on Tuesday, November 8, 2016, as part of the 2016 United States presidential election in which all 50 states plus the District of Columbia participated. Indiana voters chose electors to represent them in the Electoral College via a popular vote, pitting the Republican Party's nominee, businessman Donald Trump, and running mate Indiana Governor Mike Pence against Democratic Party nominee, former Secretary of State Hillary Clinton, and her running mate Virginia Senator Tim Kaine. Indiana has 11 electoral votes in the Electoral College.

<span class="mw-page-title-main">2016 United States presidential election in Oregon</span> Election in Oregon

The 2016 United States presidential election in Oregon was held on Tuesday, November 8, 2016, as part of the 2016 United States presidential election in which all 50 states plus the District of Columbia participated. Oregon voters chose electors to represent them in the Electoral College via a popular vote, pitting the Republican Party's nominee, businessman Donald Trump, and running mate Indiana Governor Mike Pence against Democratic Party nominee, former Secretary of State Hillary Clinton, and her running mate Virginia Senator Tim Kaine. Oregon has seven electoral votes in the Electoral College.

<span class="mw-page-title-main">2016 United States presidential election in New Jersey</span> Election in New Jersey

The 2016 United States presidential election in New Jersey was held on Tuesday, November 8, 2016, as part of the 2016 United States presidential election in which all 50 states plus the District of Columbia participated. New Jersey voters chose electors to represent them in the Electoral College via a popular vote, pitting the Republican Party's nominee, businessman Donald Trump, and running mate Indiana Governor Mike Pence against Democratic Party nominee, former Secretary of State Hillary Clinton, and her running mate Virginia Senator Tim Kaine. New Jersey has 14 electoral votes in the Electoral College.

<span class="mw-page-title-main">2016 United States presidential election in Utah</span> Election in Utah

The 2016 United States presidential election in Utah was held on November 8, 2016, as part of the 2016 United States presidential election which was also held in the other 49 states and in the District of Columbia. Voters were asked to pick 6 electors to be pledged for a candidate in the Electoral College. The two main tickets of the election were the Republican one, consisting of businessman Donald Trump and Indiana Governor Mike Pence, and the Democratic one, consisting of former Secretary of State Hillary Clinton and Virginia Senator Tim Kaine.

<span class="mw-page-title-main">2016 Virginia elections</span>

Federal and municipal elections were held in the U.S. state of Virginia on November 8, 2016. All of Virginia's House of Representative seats were up for re-election. Primary elections for Congress were held on June 14, 2016 and primary elections for president were held on March 1, 2016.

References

  1. "Distribution of Electoral Votes". National Archives and Records Administration . September 19, 2019. Retrieved December 18, 2020.
  2. "2016 Presidential General Election Results". U.S. Election Atlas. Retrieved December 6, 2016.
  3. Haberman, Maggie (October 31, 2019). "Trump, Lifelong New Yorker, Declares Himself a Resident of Florida". The New York Times. Retrieved April 9, 2020.
  4. "The Green Papers Presidential Primaries, Caucuses, and Conventions". The Green Papers. 2016. Retrieved January 27, 2016.
  5. 1 2 "Candidate Petition List". Elections.ny.gov. May 21, 2016. Archived from the original on May 12, 2012. Retrieved May 22, 2016.
  6. "Our final map has Clinton winning with 352 electoral votes. Compare your picks with ours". Los Angeles Times . November 6, 2016. Retrieved November 13, 2016.
  7. Chalian, David (November 4, 2016). "Road to 270: CNN's new election map". CNN . Retrieved March 3, 2019.
  8. "2016 Electoral Scorecard". The Cook Political Report . November 7, 2016. Retrieved March 3, 2019.
  9. "2016 Electoral Map Prediction". Electoral-vote.com . November 8, 2016. Retrieved March 3, 2019.
  10. "Presidential Ratings". The Rothenberg Political Report. Retrieved August 16, 2021.
  11. Sabato, Larry J. (November 7, 2016). "2016 President". University of Virginia Center for Politics . Retrieved March 3, 2019.
  12. "2016 Election Maps - Battle for White House". RealClearPolitics. Retrieved November 13, 2016.
  13. "Electoral Scorecard: Map shifts again in Trump's favor, as Clinton holds edge". Fox News. November 7, 2016. Retrieved November 13, 2016.
  14. "RealClearPolitics - Election 2016 - New York: Trump vs. Clinton".
  15. Mahoney, Bill. "How New York election law makes Gary Johnson more marginal". Subscriber.politicopro.com. Retrieved December 19, 2018.
  16. "Official Write-In Candidates for President" (PDF). Elections.ny.gov. Archived from the original (PDF) on October 25, 2016. Retrieved December 19, 2018.
  17. Wolfe, Jonathan (November 3, 2016). "New York Today: Our City's Other Presidential Candidates". Nytimes.com. Retrieved December 19, 2018.
  18. "NYS Board of Elections President and Vice-President Election Returns" (PDF). Elections.ny.gov. November 6, 2012. Retrieved December 19, 2018.
  19. "NYS Board of Elections President and Vice-President Election Returns" (PDF). Elections.ny.gov. November 8, 2016. Retrieved December 19, 2018.
  20. "NYC City Council - 2013-2022 districts". DRA 2020 Daves Redistricting. Retrieved December 4, 2023.
  21. Bump, Philip. "The counties that flipped parties to swing the 2016 election". The Washington Post. ISSN   0190-8286 . Retrieved September 1, 2020.
  22. "Introducing the 2017 Cook Political Report Partisan Voter Index". The Cook Political Report. Retrieved December 19, 2018.