2008 United States presidential election in Wisconsin

Last updated

2008 United States presidential election in Wisconsin
Flag of Wisconsin.svg
  2004 November 4, 2008 2012  
Turnout69.2% (Decrease2.svg 3.7%) [1]
  Obama portrait crop.jpg John McCain 2009 Official.jpg
Nominee Barack Obama John McCain
Party Democratic Republican
Home state Illinois Arizona
Running mate Joe Biden Sarah Palin
Electoral vote100
Popular vote1,677,2111,262,393
Percentage56.22%42.31%

Wisconsin Presidential Election Results 2008.svg
2008 US Presidential election in Wisconsin by congressional district.svg
2008 Presidential Election in Wisconsin by Precinct.svg

President before election

George W. Bush
Republican

Elected President

Barack Obama
Democratic

The 2008 United States presidential election in Wisconsin took place on November 4, 2008, as part of the 2008 United States presidential election in which all 50 states plus the District of Columbia participated. State voters chose 10 electors to represent them in the Electoral College via a popular vote pitting Democratic U.S. Senator from Illinois Barack Obama, and his running mate U.S. Senator from Delaware Joe Biden, against Republican challenger and U.S. Senator from Arizona John McCain and his running mate, Alaska Governor Sarah Palin.

Contents

Also on the ballot were four third parties: activist and former presidential candidate Ralph Nader ran as an Independent with his running mate, President of the San Francisco Board of Supervisors Matt Gonzalez. The Libertarian Party nominated former Representative from Georgia Bob Barr for president and conservative author Wayne Allyn Root for vice president. Pastor Chuck Baldwin and attorney Darrell Castle were nominated by the right-wing Constitution Party, and the left-wing Green Party nominated former Representative from Georgia Cynthia McKinney and community organizer Rosa Clemente. [2]

Wisconsin was won by Democratic nominee Barack Obama by a 13.91% margin of victory. Prior to the election, all 17 news organizations considered this a state Obama would win, or otherwise considered as a safe blue state, despite the extremely close margins of victory in the previous two presidential elections. Polling throughout the state began to show a sizable and widening lead for Democrat Barack Obama of neighboring Illinois over Republican John McCain of Arizona. Obama carried Wisconsin with over 56% of the vote, significantly improving upon John Kerry's very narrow margin of victory in 2004. Obama is the only candidate since 1988 to win the state with the majority of the vote, and the only candidate since 1996 to win by a margin of more than 1%, both of which he would go on to do again in 2012.

Whether measured by raw vote margin, percentage of total votes, or two-party percentage, Obama's victory remains the strongest performance for any candidate in the state since the landslide re-election of Democrat Lyndon B. Johnson in 1964. In fact, Obama carried two of three counties that voted for Barry Goldwater in that election and became the first Democrat since Franklin D. Roosevelt in 1936 to carry Waupaca County, and only the second Democratic nominee to carry that county since the Civil War. This remains the most recent election where Wisconsin voted to the left of Minnesota as well as the only election where Wisconsin was decided by a margin of over 10.0% in the 21st century. As of 2020, Obama's 1,677,211 votes are the most received by a presidential candidate in the state's history.

Primaries

Campaign

Predictions

There were 16 news organizations who made state-by-state predictions of the election. Here are their last predictions before election day:

SourceRanking
D.C. Political Report [3] Likely D
Cook Political Report [4] Solid D
The Takeaway [5] Solid D
Electoral-vote.com [6] Solid D
Washington Post [7] Solid D
Politico [8] Solid D
RealClearPolitics [9] Solid D
FiveThirtyEight [7] Solid D
CQ Politics [10] Solid D
The New York Times [11] Lean D
CNN [12] Lean D
NPR [7] Solid D
MSNBC [7] Solid D
Fox News [13] Likely D
Associated Press [14] Likely D
Rasmussen Reports [15] Safe D

Polling

Pre-election polling early on showed a tight race. However, after May 18, Obama swept every single poll. Since September 21, Obama won every poll with at least 49% of the vote. The final 3 polls averaged Obama leading 53% to 40%. [16]

Fundraising

John McCain raised a total of $1,728,185 in the state. Barack Obama raised $4,862,486. [17]

Advertising and visits

Obama and his interest groups spent $13,586,634. McCain and his interest groups spent $9,240,899. [18] Each ticket visited the state 7 times. [19]

Analysis

Having voted for the Democratic presidential nominees by comfortable margins in 1988, 1992, and 1996, but extremely narrow margins in 2000 and 2004, Wisconsin was originally considered to be a swing state in 2008. [20] However, Obama took a wide lead in the polls in Wisconsin in the final weeks before the election and many pundits and news organizations labeled the state as a safe blue state. [21]

Obama won Wisconsin by a comfortable 13.91% margin of victory. Obama carried the heavily Democratic cities of Milwaukee and Madison by large margins, winning above two-thirds of the vote, along with some traditionally Republican cities like Green Bay and Appleton. [22] In Dane County, he won almost 73% of the vote, and carried 67.3% in Milwaukee County. This was consistent with Obama's pattern of strong performances in the states bordering Illinois. Obama's best performance, at 86.81%, was in the small county of Menominee, which is 87% Native American. [23] The state's Republican base essentially melted; John McCain only carried 13 of the state's 72 counties, a devastating defeat. McCain did best in the Milwaukee suburbs like Waukesha and Ozaukee counties, with his best performance in Washington County where he received 64.14% of the vote. He only won five counties in the Northern part of the state, all of which by rather narrow margins. Wisconsin would not vote for a Republican candidate for president until it voted for Donald Trump in 2016, though it would flip back to the Democratic column in 2020 with Joe Biden back on the ballot.

As of the 2020 presidential election , this is the last election in which the counties of Barron, Brown, Burnett, Calumet, Chippewa, Clark, Iron, Jefferson, Kewaunee, Langlade, Manitowoc, Marathon, Marinette, Monroe, Oconto, Oneida, Outagamie, Pierce, Rusk, Shawano, Washburn, Waupaca, Waushara, and Wood voted for the Democratic presidential nominee.

Results

2008 United States presidential election in Wisconsin [2]
PartyCandidateRunning mateVotesPercentageElectoral votes
Democratic Barack Obama Joe Biden 1,677,21156.22%10
Republican John McCain Sarah Palin 1,262,39342.31%0
Independent Ralph Nader Matt Gonzalez 17,6050.59%0
Libertarian Bob Barr Wayne Allyn Root 8,8580.30%0
Write-insWrite-ins6,5210.22%0
Independent [lower-alpha 1] Chuck Baldwin Darrell Castle5,0720.17%0
Green Cynthia McKinney Rosa Clemente 4,2160.14%0
Independent [lower-alpha 2] Jeffrey Wamboldt 7640.03%0
Independent [lower-alpha 3] Brian Moore Stewart Alexander 5400.02%0
Independent [lower-alpha 4] Gloria La Riva 2370.01%0
Totals2,983,417100.00%10
Voter turnout (Voting age population)70.8%

By county

CountyBarack Obama
Democratic
John McCain
Republican
Various candidates
Other parties
MarginTotal votes cast
# %# %# %# %
Adams 5,80658.14%3,97439.80%2062.06%1,83218.34%9,986
Ashland 5,81867.86%2,63430.72%1221.42%3,18437.14%8,574
Barron 12,07852.77%10,45745.69%3511.54%1,6217.08%22,886
Bayfield 5,97263.08%3,36535.54%1311.38%2,60727.54%9,468
Brown 67,26953.92%55,85444.77%1,6311.31%11,4159.15%124,754
Buffalo 3,94956.41%2,92341.76%1281.83%1,02614.65%7,000
Burnett 4,33749.92%4,20048.34%1511.74%1371.58%8,688
Calumet 13,29550.22%12,72248.05%4571.73%5732.17%26,474
Chippewa 16,23953.72%13,49244.63%5001.65%2,7479.09%30,231
Clark 7,45452.54%6,38344.99%3502.47%1,0717.55%14,187
Columbia 16,66156.92%12,19341.65%4181.43%4,46815.27%29,272
Crawford 4,98762.49%2,83035.46%1642.05%2,15727.03%7,981
Dane 205,98472.80%73,06525.82%3,8901.37%132,91946.98%282,939
Dodge 19,18344.80%23,01553.74%6251.46%-3,832-8.94%42,823
Door 10,14258.02%7,11240.68%2271.30%3,03017.34%17,481
Douglas 15,83065.78%7,83532.56%4011.66%7,99533.22%24,066
Dunn 13,00256.56%9,56641.61%4211.83%3,43614.95%22,989
Eau Claire 33,14660.25%20,95938.10%9051.65%12,18722.15%55,010
Florence 1,13442.23%1,51256.31%391.46%-378-14.08%2,685
Fond du Lac 23,46344.84%28,16453.83%6961.33%-4,701-8.99%52,323
Forest 2,67357.08%1,96341.92%471.00%71015.16%4,683
Grant 14,87561.16%9,06837.29%3771.55%5,80723.87%24,320
Green 11,50262.06%6,73036.31%3021.63%4,77225.75%18,534
Green Lake 4,00041.95%5,39356.55%1431.50%-1,393-14.60%9,536
Iowa 7,98766.73%3,82931.99%1531.28%4,15834.74%11,969
Iron 1,91455.77%1,46442.66%541.57%45013.11%3,432
Jackson 5,57260.23%3,55238.40%1271.37%2,02021.83%9,251
Jefferson 21,44849.69%21,09648.87%6221.44%3520.82%43,166
Juneau 6,18653.65%5,14844.65%1961.70%1,0389.00%11,530
Kenosha 45,83658.18%31,60940.12%1,3441.70%14,22718.06%78,789
Kewaunee 5,90254.71%4,71143.67%1741.62%1,19111.04%10,787
La Crosse 38,52460.94%23,70137.49%9931.57%14,82323.45%63,218
Lafayette 4,73260.43%2,98438.10%1151.47%1,74822.33%7,831
Langlade 5,18249.82%5,08148.85%1391.33%1010.97%10,402
Lincoln 8,42455.17%6,51942.70%3252.13%1,90512.47%15,268
Manitowoc 22,42852.88%19,23445.35%7521.77%3,1947.53%42,414
Marathon 36,36753.53%30,34544.66%1,2281.81%6,0228.87%67,940
Marinette 11,19552.67%9,72645.76%3341.57%1,4696.91%21,255
Marquette 4,06851.85%3,65446.57%1241.58%4145.28%7,846
Menominee 1,25786.81%18512.78%60.41%1,07274.03%1,448
Milwaukee 319,81967.30%149,44531.45%5,9281.25%170,37435.85%475,192
Monroe 10,19853.25%8,66645.25%2881.50%1,5328.00%19,152
Oconto 9,92752.34%8,75546.16%2861.50%1,1726.18%18,968
Oneida 11,90754.30%9,63043.92%3901.78%2,27710.38%21,927
Outagamie 50,29454.93%39,67743.33%1,5921.74%10,61711.60%91,563
Ozaukee 20,57938.56%32,17260.29%6141.15%-11,593-21.73%53,365
Pepin 2,10255.74%1,61642.85%531.41%48612.89%3,771
Pierce 11,80353.39%9,81244.38%4922.23%1,9919.01%22,107
Polk 10,87648.03%11,28249.83%4852.14%-406-1.80%22,643
Portage 24,81762.95%13,81035.03%7952.02%11,00727.92%39,422
Price 4,55955.64%3,46142.24%1742.12%1,09813.40%8,194
Racine 53,40853.07%45,95445.66%1,2801.27%7,4547.41%100,642
Richland 5,04159.66%3,29839.03%1111.31%1,74320.63%8,450
Rock 50,52963.82%27,36434.56%1,2761.62%23,16529.26%79,169
Rusk 3,85553.01%3,25344.73%1642.26%6028.28%7,272
St. Croix 21,17747.25%22,83750.95%8071.80%-1,660-3.70%44,821
Sauk 18,61760.79%11,56237.75%4471.46%7,05523.04%30,626
Sawyer 4,76552.45%4,19946.22%1211.33%5666.23%9,085
Shawano 10,25951.07%9,53847.48%2921.45%7213.59%20,089
Sheboygan 30,39548.94%30,80149.59%9111.47%-406-0.65%62,107
Taylor 4,56348.82%4,58649.07%1972.11%-23-0.25%9,346
Trempealeau 8,32162.50%4,80836.11%1851.39%3,51326.39%13,314
Vernon 8,46360.13%5,36738.13%2451.74%3,09622.00%14,075
Vilas 6,49147.21%7,05551.31%2041.48%-564-4.10%13,750
Walworth 24,17747.95%25,48550.54%7601.51%-1,308-2.59%50,422
Washburn 4,69351.50%4,30347.22%1161.28%3904.28%9,112
Washington 25,71934.56%47,72964.14%9631.30%-22,010-29.58%74,411
Waukesha 85,33936.64%145,15262.32%2,4061.04%-59,813-25.68%232,897
Waupaca 12,95250.77%12,23247.95%3271.28%7202.82%25,511
Waushara 5,86849.52%5,77048.70%2111.78%980.82%11,849
Winnebago 48,16754.94%37,94643.28%1,5641.78%10,22111.66%87,677
Wood 21,71055.59%16,58142.46%7611.95%5,12913.13%39,052
Totals1,677,21156.22%1,262,39342.31%43,8131.47%414,81813.91%2,983,417
County Flips:
Democratic
Hold
Gain from Republican
Republican
Hold Wisconsin County Flips 2008.svg
County Flips:

Counties that flipped from Republican to Democratic

Barack Obama flipped 32 counties that voted for George W. Bush in 2004. [24] [25]

By congressional district

Barack Obama swept the state, carrying seven of the state's eight congressional districts, including two districts held by Republicans. Three of these districts – the 1st (then represented by future vice presidential nominee and Speaker of the House Paul Ryan), 6th, and 8th – Obama flipped from the 2004 election. [26] McCain only won the 5th district, a portion of the Milwaukee suburbs.

DistrictMcCainObamaRepresentative
1st 47.45%51.40% Paul Ryan
2nd 29.78%69.00% Tammy Baldwin
3rd 40.80%57.76% Ron Kind
4th 23.61%75.39% Gwen Moore
5th 57.73%41.28% Jim Sensenbrenner
6th 48.72%49.91% Tom Petri
7th 42.52%55.91% David Obey
8th 45.12%53.59% Steve Kagen

Electors

Technically the voters of Wisconsin cast their ballots for electors: representatives to the Electoral College. Wisconsin is allocated 10 electors because it has 8 congressional districts and 2 senators. All candidates who appear on the ballot or qualify to receive write-in votes must submit a list of 10 electors, who pledge to vote for their candidate and his or her running mate. Whoever wins the majority of votes in the state is awarded all 10 electoral votes. Their chosen electors then vote for president and vice president. Although electors are pledged to their candidate and running mate, they are not obligated to vote for them. [27] An elector who votes for someone other than his or her candidate is known as a faithless elector.

The electors of each state and the District of Columbia met on December 15, 2008, to cast their votes for president and vice president. The Electoral College itself never meets as one body. Instead the electors from each state and the District of Columbia met in their respective capitols.

The following were the members of the Electoral College from the state. All 10 were pledged to Barack Obama and Joe Biden: [28]

  1. Ray Rivera
  2. Fred Risser
  3. Rollie Hick
  4. Polly Williams
  5. Dean Palmer
  6. Gordon Hintz
  7. Christine Bremer-Muggli
  8. Donsia Strong Hill
  9. Jim Doyle
  10. Joe Wineke

See also

Notes

  1. Ran as the national Constitution Party nominee, listed as an Independent on the ballot
  2. Ran as a national nominee of the We the People Foundation, listed as an Independent on the ballot
  3. Ran as the national Socialist Party USA nominee, listed as an Independent on the ballot
  4. Ran as the national Party for Socialism and Liberation nominee, listed as an Independent on the ballot

Related Research Articles

<span class="mw-page-title-main">2008 United States presidential election in Indiana</span> Election in Indiana

The 2008 United States presidential election in Indiana took place on November 4, 2008, and was part of the 2008 United States presidential election. Voters chose 11 representatives, or electors to the Electoral College, who voted for president and vice president.

<span class="mw-page-title-main">2008 United States presidential election in Colorado</span> Election in Colorado

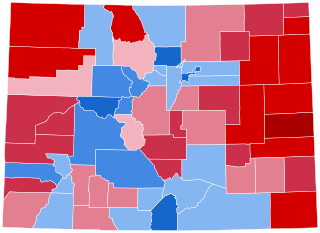
The 2008 United States presidential election in Colorado took place on November 4, 2008, as a part of the 2008 United States presidential election throughout all 50 states and the District of Columbia. Voters chose nine representatives, or electors to the Electoral College, who voted for president and vice president.

<span class="mw-page-title-main">2008 United States presidential election in Utah</span> Election in Utah

The 2008 United States presidential election in Utah took place on November 4, 2008. It was part of the 2008 United States presidential election. Voters chose five representatives, or electors to the Electoral College, who voted for president and vice president.

<span class="mw-page-title-main">2008 United States presidential election in Wyoming</span> Election in Wyoming

The 2008 United States presidential election in Wyoming took place on November 4, 2008, and was part of the 2008 United States presidential election. Voters chose three representatives, or electors to the Electoral College, who voted for president and vice president.

<span class="mw-page-title-main">2008 United States presidential election in North Dakota</span> Election in North Dakota

The 2008 United States presidential election in North Dakota took place on November 4, 2008, and was part of the 2008 United States presidential election. Voters chose three representatives, or electors to the Electoral College, who voted for president and vice president.

<span class="mw-page-title-main">2008 United States presidential election in North Carolina</span>

The 2008 United States presidential election in North Carolina was part of the national event on November 4, 2008, throughout all 50 states and D.C. In North Carolina, voters chose 15 representatives, or electors, to the Electoral College, who voted for president and vice president.

<span class="mw-page-title-main">2008 United States presidential election in Montana</span> Election in Montana

The 2008 United States presidential election in Montana took place on November 4, 2008, and was part of the 2008 United States presidential election. Voters chose three representatives, or electors to the Electoral College, who voted for president and vice president.

<span class="mw-page-title-main">2008 United States presidential election in Ohio</span> Election in Ohio

The 2008 United States presidential election in Ohio took place on November 4, 2008, which was part of the 2008 United States presidential election. Voters chose 20 representatives, or electors to the Electoral College, who voted for president and vice president.

<span class="mw-page-title-main">2008 United States presidential election in Illinois</span>

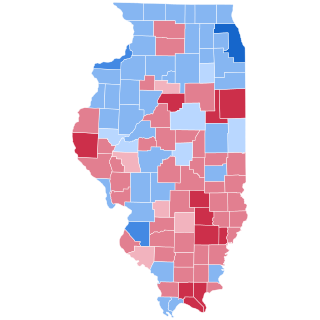
The 2008 United States presidential election in Illinois took place on November 4, 2008, and was part of the 2008 United States presidential election. Voters chose 21 representatives, or electors to the Electoral College, who voted for president and vice president.

<span class="mw-page-title-main">2008 United States presidential election in Virginia</span> Election in Virginia

The 2008 United States presidential election in Virginia took place on November 4, 2008, which was part of the 2008 United States presidential election. Voters chose 13 representatives, or electors to the Electoral College, who voted for president and vice president.

<span class="mw-page-title-main">2008 United States presidential election in New Mexico</span> Election in New Mexico

The 2008 United States presidential election in New Mexico took place on November 4, 2008. Voters chose five representatives, or electors to the Electoral College, who voted for president and vice president.

<span class="mw-page-title-main">2008 United States presidential election in Texas</span> Election in Texas

The 2008 United States presidential election in Texas took place on November 4, 2008, and was part of the 2008 United States presidential election. Voters chose 34 representatives, or electors to the Electoral College, who voted for president and vice president.

<span class="mw-page-title-main">2008 United States presidential election in Minnesota</span>

The 2008 United States presidential election in Minnesota took place on November 4, 2008, and was part of the 2008 United States presidential election. Voters chose ten representatives, or electors to the Electoral College, who voted for president and vice president.

<span class="mw-page-title-main">2008 United States presidential election in Georgia</span> Election in Georgia

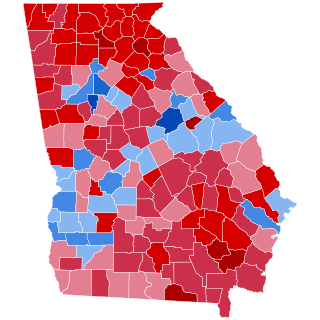
The 2008 United States presidential election in Georgia took place on November 4, 2008. Voters chose 15 representatives, or electors to the Electoral College, who voted for president and vice president.

<span class="mw-page-title-main">2008 United States presidential election in Kansas</span> Election in Kansas

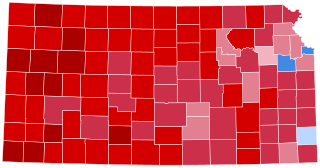
The 2008 United States presidential election in Kansas took place on November 4, 2008, and was part of the 2008 United States presidential election. Voters chose six representatives, or electors to the Electoral College, who voted for president and vice president.

<span class="mw-page-title-main">2008 United States presidential election in Kentucky</span> Election in Kentucky

The 2008 United States presidential election in Kentucky took place on November 4, 2008, and was part of the 2008 United States presidential election. Voters chose eight representatives, or electors to the Electoral College, who voted for president and vice president.

<span class="mw-page-title-main">2008 United States presidential election in South Dakota</span> Election in South Dakota

The 2008 United States presidential election in South Dakota took place on November 4, 2008, and was part of the 2008 United States presidential election. Voters chose three representatives, or electors to the Electoral College, who voted for president and vice president.

<span class="mw-page-title-main">2008 United States presidential election in Maryland</span> U.S. presidential election in Maryland

The 2008 United States presidential election in Maryland took place on November 4, 2008, and was part of the 2008 United States presidential election. Voters chose 10 representatives, or electors to the Electoral College, who voted for president and vice president.

<span class="mw-page-title-main">2008 United States presidential election in Michigan</span> Election in Michigan

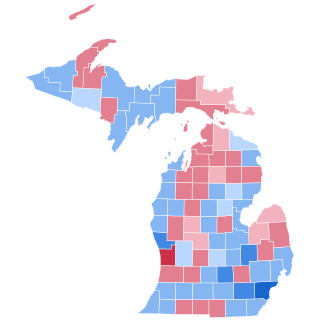
The 2008 United States presidential election in Michigan took place on November 4, 2008. It was part of the 2008 United States presidential election which happened throughout all 50 states and D.C. Voters chose 17 representatives, or electors to the Electoral College, who voted for president and vice president.

<span class="mw-page-title-main">2008 United States presidential election in Tennessee</span> Election in Tennessee

The 2008 United States presidential election in Tennessee was held on November 4, 2008, and was part of the 2008 United States presidential election. Voters chose 11 representatives, or electors, to the Electoral College, who voted for president and vice president.

References

  1. "Wisconsin Voter Turnout Statistics". Wisconsin Election Commission. Retrieved September 25, 2020.
  2. 1 2 "OFFICIAL GENERAL ELECTION RESULTS FOR UNITED STATES PRESIDENT - NOVEMBER 4, 2008" (pdf). Federal Election Commission. Archived (pdf) from the original on November 3, 2023. Retrieved December 30, 2023.
  3. "D.C.'s Political Report: The complete source for campaign summaries". January 1, 2009. Archived from the original on January 1, 2009. Retrieved August 23, 2021.
  4. "Presidential". May 5, 2015. Archived from the original on May 5, 2015. Retrieved August 23, 2021.
  5. "Vote 2008 - The Takeaway - Track the Electoral College vote predictions". April 22, 2009. Archived from the original on April 22, 2009. Retrieved August 23, 2021.
  6. "Electoral-vote.com: President, Senate, House Updated Daily". electoral-vote.com. Retrieved August 23, 2021.
  7. 1 2 3 4 Based on Takeaway
  8. "POLITICO's 2008 Swing State Map - POLITICO.com". www.politico.com. Retrieved September 22, 2016.
  9. "RealClearPolitics - Electoral Map". Archived from the original on June 5, 2008.
  10. "CQ Presidential Election Maps, 2008". CQ Politics. Archived from the original on June 14, 2009. Retrieved December 20, 2009.
  11. Nagourney, Adam; Zeleny, Jeff; Carter, Shan (November 4, 2008). "The Electoral Map: Key States". The New York Times. Retrieved May 26, 2010.
  12. "October 2008 CNN Political Ticker - CNN.com Blogs". CNN. October 31, 2008. Archived from the original on June 19, 2010. Retrieved May 26, 2010.
  13. "Winning The Electoral College". Fox News. April 27, 2010.
  14. "roadto270". hosted.ap.org. Retrieved September 22, 2016.
  15. "Election 2008: Electoral College Update - Rasmussen Reports". www.rasmussenreports.com. Retrieved September 22, 2016.
  16. "Election 2008 Polls - Dave Leip's Atlas of U.S. Presidential Elections" . Retrieved December 19, 2022.
  17. "Presidential Campaign Finance". Archived from the original on March 24, 2009. Retrieved August 18, 2009.
  18. "Map: Campaign Ad Spending - Election Center 2008 from CNN.com". CNN. Retrieved May 26, 2010.
  19. "Map: Campaign Candidate Visits - Election Center 2008 from CNN.com". CNN. Retrieved May 26, 2010.
  20. "Reality Check: Wisconsin Still Considered A Swing State". Archived from the original on September 16, 2008. Retrieved November 12, 2008.
  21. "RealClearPolitics: Wisconsin Head-to-Head Polls" . Retrieved November 12, 2008.
  22. "Local and National Election Results". CNN. Retrieved November 12, 2008.
  23. "U.S. Census Bureau QuickFacts: Menominee County, Wisconsin; Wisconsin". www.census.gov. Retrieved November 18, 2020.
  24. "Wisconsin - Election Results 2008 - The New York Times". www.nytimes.com. Retrieved November 18, 2020.
  25. "Wisconsin". The New York Times. ISSN   0362-4331 . Retrieved November 18, 2020.
  26. "Presidential Results by Congressional District, 2000-2008 – Swing State Project" . Retrieved November 18, 2020.
  27. "Electoral College". California Secretary of State. Archived from the original on October 30, 2008. Retrieved November 1, 2008.
  28. "The Electoral College". May 20, 2019.