California's 19th congressional district

Last updated

California's 19th congressional district
California's 19th congressional district (since 2023).svg
California's 19th congressional district
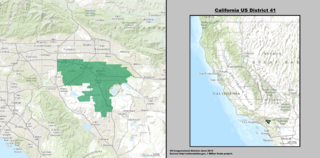
Interactive map of district boundaries since 2023 (Used in the 2022 elections)
Representative
  Jimmy Panetta
DCarmel Valley
Population (2022)745,616
Median household
income
$118,453 [1]
Ethnicity
Cook PVI D+18 [2]

California's 19th congressional district is a congressional district in the U.S. state of California, currently represented by Democrat Jimmy Panetta.

Contents

Following redistricting in 2021, the district includes most of Santa Cruz County and parts of Santa Clara County, Monterey County and San Luis Obispo County. The new 19th district includes the south side of San Jose and the entire cities of Santa Cruz, Monterey, Seaside, Paso Robles, and Atascadero. [3] Most of the area was previously part of the 20th district, which moved to the Central Valley.

For much of the 20th century prior to the early 1990s, the district had encompassed areas to the south and much of Los Angeles County, California. Gradually it was redefined to take in central and northern counties instead.

Recent election results from statewide races

YearOfficeResults
1992 U.S. President GHW Bush 43.5 – 38.1%
U.S. Senator Herschensohn 59.1 – 33.6%
U.S. Senator Seymour 51.5 – 41.7%
1994 Governor [ data missing ]
U.S. Senator [ data missing ]
1996 U.S. President [ data missing ]
1998 Governor [ data missing ]
U.S. Senator [ data missing ]
2000 U.S. President [4] GW Bush 57.6 – 38.2%
U.S. Senator [5] Feinstein 47.9 – 45.1%
2002 Governor [6] Simon 56.6 – 35.7%
2003 Recall [7] [8] Yes 67.9 – 32.1%
Schwarzenegger 52.8 – 23.1%
2004 U.S. President [9] GW Bush 61.6 – 37.9%
U.S. Senator [10] Jones 54.9 – 42.1%
2006 Governor [11] Schwarzenegger 69.3 – 26.6%
U.S. Senator [12] Mountjoy 48.6 – 46.8%
2008 U.S. President [13] McCain 52.1 – 46.0%
2010 Governor Whitman 54.8 – 39.6%
U.S. Senator Fiorina 59.4 – 34.5%
2012 U.S. President Obama 71.2 – 26.5%
U.S. Senator Feinstein 73.5 – 26.5%
2014 Governor Brown 73.4 – 26.6%
2016 U.S. President H. Clinton 72.9 – 21.5%
U.S. Senator Harris 59.1 – 40.1%
2018 Governor Newsom 70.3 – 29.7%
U.S. Senator Feinstein 58.4 – 41.6%
2020 U.S. President Biden 70.0 – 27.9%
2021 Recall [14] No 71.7 – 28.3%
2022 Governor [15] Newsom 65.3 - 34.7%
Senator Padilla 67.2 - 32.8%

Composition

#CountySeatPopulation
53 Monterey Salinas 437,325
79 San Luis Obispo San Luis Obispo 283,159
85 Santa Clara San Jose 1,885,508
87 Santa Cruz Santa Cruz 270,861

As of the 2020 redistricting, California's 19th congressional district is located on the Central Coast. It encompasses most of Santa Cruz County, the interior of Santa Clara County, the north of San Luis Obispo County, and the coast of Monterey County.

Santa Clara County is split between this county, the 16th district, and the 18th district. The 19th and 16th are partitioned by Old Santa Cruz Highway, Aldercroft Hts Rd, Weaver Rd, Soda Springs Rd, Love Harris Rd, Pheasant Creek, Guadalupe Creek, Guadalupe Mines Rd, Oak Canyon Dr, Coleman Rd, Meridian Ave, Highway G8, Guadalupe River, W Capitol Expressway, Senter Rd, Sylvandale Ave, Yerba Buena Rd, Silver Creek Rd, and E Capitol Expressway. The 19th and 18th are partitioned by Pajaro River, Highway 129, W Beach St, Lee Rd, Highway 1, Harkins Slough Rd, Harkins Slough, Old Adobe Rd, Corralitos Creek, Varin Rd, Pioneer Rd, Green Valley Rd, Casserly Rd, Mt Madonna Rd. The 19th district takes in the south west section of the city of San Jose.

Monterey County is split between this district and the 18th district. They are partitioned by Union Pacific, Highway G12, Elkhorn Rd, Echo Valley Rd, Maher Rd, Maher Ct, La Encina Dr, Crazy Horse Canyon Rd, San Juan Grade Rd, Highway 101, Espinosa Rd, Castroville Blvd, Highway 156, Highway 1, Tembladero Slough, Highway 183, Cooper Rd, Blanco Rd, Salinas River, Davis Rd, Hitchcock Rd, Highway 68, E Blanco Rd, Nutting St, Abbott St, Highway G17, Limekiln Creek, Likekiln Rd, Rana Creek, Tularcitos Creek, Highway G16, Tassajara Rd, Camp Creek, Lost Valley Creek, Lost Valley Conn, N Coast Rdg, 2 Central Coa, Cone Peak Rd, Nacimiento Fergusson Rd, Los Bueyes Creek, and the Monterey County Southern border. The 19th district takes in the cities of Monterey, Seaside, Pacific Grove, and Marina, as well as most of the census-designated place Prunedale.

San Luis Obispo County is split between this district and the 24th district. They are partitioned by Highway 1, Cayucos Creek Rd, Thunder Canyon Rd, Old Creek Rd, Santa Rita Rd, Tara Creek, Fuentes Rd, Highway 41, San Miguel Rd, Palo Verde Rd, Old Morro Rd, Los Osos Rd, San Rafael Rd, Atascadero Ave, San Antonio Rd, N Santa Margarita Rd, Santa Clara Rd, Rocky Canyon Truck Trail, Highway 229, Lion Ridge Rd, O'Donovan Rd, Highway 58, Calf Canyon Highway, La Panza Rd, Upton Canyon Rd, Camatta Creek Rd, San Juan Creek, and Bitterwater Rd. The 19th district takes in the cities of Atascadero and Paso Robles.

Cities & CDP with 10,000 or more people

List of members representing the district

MemberPartyDatesCong
ress
Electoral historyCounties
District created March 4, 1933
Sam L. Collins (California Congressman).jpg
Sam L. Collins
(Fullerton)
Republican March 4, 1933 –
January 3, 1937
73rd
74th
Elected in 1932.
Re-elected in 1934.
Lost re-election.
1933–1943
Orange, Riverside, San Bernardino
HarryRSheppard.jpg
Harry R. Sheppard
(Yucaipa)
Democratic January 3, 1937 –
January 3, 1943
75th
76th
77th
Elected in 1936.
Re-elected in 1938.
Re-elected in 1940.
Redistricted to the 21st district .
Chet Holifield, 1967.jpg
Chester E. Holifield
(Montebello)
Democratic January 3, 1943 –
December 31, 1974
78th
79th
80th
81st
82nd
83rd
84th
85th
86th
87th
88th
89th
90th
91st
92nd
93rd
Elected in 1942.
Re-elected in 1944.
Re-elected in 1946.
Re-elected in 1948.
Re-elected in 1950.
Re-elected in 1952.
Re-elected in 1954.
Re-elected in 1956.
Re-elected in 1958.
Re-elected in 1960.
Re-elected in 1962.
Re-elected in 1964.
Re-elected in 1966.
Re-elected in 1968.
Re-elected in 1970.
Re-elected in 1972.
Retired and resigned early.
1943–1975
Los Angeles
VacantDecember 31, 1974 –
January 3, 1975
93rd
Robert J. Lagomarsino 2.jpg
Robert J. Lagomarsino
(Ventura)
Republican January 3, 1975 –
January 3, 1993
94th
95th
96th
97th
98th
99th
100th
101st
102nd
Redistricted from the 13th district and re-elected in 1974.
Re-elected in 1976.
Re-elected in 1978.
Re-elected in 1980.
Re-elected in 1982.
Re-elected in 1984.
Re-elected in 1986.
Re-elected in 1988.
Re-elected in 1990.
Redistricted to the 22nd district and lost re-election.
1975–1983
Southern San Luis Obispo, Santa Barbara, western Ventura
1983–1993
Santa Barbara, Ventura
Richard H Lehman.png
Richard H. Lehman
(North Fork)
Democratic January 3, 1993 –
January 3, 1995
103rd Redistricted from the 18th district and re-elected in 1992.
Lost re-election.
1993–2003
Eastern Fresno, Madera, Mariposa, northern Tulare
George Radanovich.jpg
George Radanovich
(Mariposa)
Republican January 3, 1995 –
January 3, 2011
104th
105th
106th
107th
108th
109th
110th
111th
Elected in 1994.
Re-elected in 1996.
Re-elected in 1998.
Re-elected in 2000.
Re-elected in 2002.
Re-elected in 2004.
Re-elected in 2006.
Re-elected in 2008.
Retired.
2003–2013
CA-19th.png
Northern Fresno, Mariposa, Madera, eastern Stanislaus, Tuolumne
Jeff Denham 113th Congress.jpg
Jeff Denham
(Turlock)
Republican January 3, 2011 –
January 3, 2013
112th Elected in 2010.
Redistricted to the 10th district .
Zoe Lofgren 111th pictorial.jpg
Zoe Lofgren
(San Jose)
Democratic January 3, 2013 –
January 3, 2023
113th
114th
115th
116th
117th
Redistricted from the 16th district and re-elected in 2012.
Re-elected in 2014.
Re-elected in 2016.
Re-elected in 2018.
Re-elected in 2020.
Redistricted to the 18th district .
2013–2023
California US Congressional District 19 (since 2013).tif
Santa Clara
Jimmy Pannetta 116th Congress.jpg
Jimmy Panetta
(Carmel Valley)
Democratic January 3, 2023 –
present
118th Redistricted from the 20th district and re-elected in 2022.2023–present
California's 19th congressional district (since 2023) (new version).svg
Monterey and San Benito counties, most of Santa Cruz County, and portions of Santa Clara County

Election results

1932193419361938194019421944194619481950195219541956195819601962196419661968197019721974197619781980198219841986198819901992199419961998200020022004200620082010201220142016201820202022

1932

1932 United States House of Representatives elections [16]
PartyCandidateVotes%
Republican Sam L. Collins 56,889 51.0
Democratic B. Z. McKinney51,79646.4
Liberty Horatio S. Hoard2,8732.6
Total votes111,558 100.0
Turnout  
Republican win (new seat)

1934

1934 United States House of Representatives elections [17]
PartyCandidateVotes%
Republican Sam L. Collins (Incumbent) 97,119 88.8
No partyA. B. Hillabold (write-in)12,30111.2
Total votes109,420 100.0
Turnout  
Republican hold

1936

1936 United States House of Representatives elections [18]
PartyCandidateVotes%
Democratic Harry R. Sheppard 70,339 53.8
Republican Sam L. Collins (Incumbent)59,07145.2
Communist Charles McLauchlan1,3361.0
Total votes130,746 100.0
Turnout  
Democratic gain from Republican

1938

1938 United States House of Representatives elections [19]
PartyCandidateVotes%
Democratic Harry R. Sheppard (Incumbent) 75,819 53.3
Republican C. T. Johnson66,40246.7
Total votes142,221 100.0
Turnout  
Democratic hold

1940

1940 United States House of Representatives elections [20]
PartyCandidateVotes%
Democratic Harry R. Sheppard (Incumbent) 84,931 52.9
Republican Lotus H. Loudon75,49547.1
Total votes160,426 100.0
Turnout  
Democratic hold

1942

1942 United States House of Representatives elections [21]
PartyCandidateVotes%
Democratic Chet Holifield 34,918 63.1
Republican Carlton H. Casjens20,44636.9
Total votes55,374 100.0
Turnout  
Democratic win (new seat)

1944

1944 United States House of Representatives elections [22]
PartyCandidateVotes%
Democratic Chet Holifield (Incumbent) 65,758 71.8
Republican Carlton H. Casjens25,85228.2
Total votes91,610 100.0
Turnout  
Democratic hold

1946

1946 United States House of Representatives elections [23]
PartyCandidateVotes%
Democratic Chet Holifield (Incumbent) 50,666 97.6
Independent Marshall J. Morrill (write-in)1,2482.4
Total votes51,914 100.0
Turnout  
Democratic hold

1948

1948 United States House of Representatives elections [24]
PartyCandidateVotes%
Democratic Chet Holifield (Incumbent) 72,900 69.7
Republican Joseph Francis Quigley28,69827.5
Progressive Jacob Berman1,9151.8
Independent Myra Tanner Weiss1,0131.0
Total votes104,526 100.0
Turnout  
Democratic hold

1950

1950 United States House of Representatives elections [25]
PartyCandidateVotes%
Democratic Chet Holifield (Incumbent) 73,317 90.9
Independent Myra Tanner Weiss7,3299.1
Total votes80,646 100.0
Turnout  
Democratic hold

1952

1952 United States House of Representatives elections [26]
PartyCandidateVotes%
Democratic Chet Holifield (Incumbent) 126,606 87.1
Progressive Ida Alvarez13,7249.4
Independent Milton Snipper4,9593.5
Total votes145,289 100.0
Turnout
Democratic hold

1954

1954 United States House of Representatives elections [27]
PartyCandidateVotes%
Democratic Chet Holifield (Incumbent) 90,269 74.8
Republican Raymond R. Pritchard30,40425.2
Total votes120,673 100.0
Turnout  
Democratic hold

1956

1956 United States House of Representatives elections [28]
PartyCandidateVotes%
Democratic Chet Holifield (Incumbent) 116,287 73.8
Republican Roy E. Reynolds41,26926.2
Total votes157,556 100.0
Turnout  
Democratic hold

1958

1958 United States House of Representatives elections [29]
PartyCandidateVotes%
Democratic Chet Holifield (Incumbent) 131,421 75.3
Republican Roy E. Reynolds26,09224.7
Total votes157,513 100.0
Turnout  
Democratic hold

1960

1960 United States House of Representatives elections [30]
PartyCandidateVotes%
Democratic Chet Holifield (Incumbent) 145,479 78.2
Republican Gordon S. McWilliams40,49121.8
Total votes185,970 100.0
Turnout  
Democratic hold

1962

1962 United States House of Representatives elections [31]
PartyCandidateVotes%
Democratic Chet Holifield (Incumbent) 78,436 61.6
Republican Robert T. Ramsay48,97638.4
Total votes127,412 100.0
Turnout  
Democratic hold

1964

1964 United States House of Representatives elections [32]
PartyCandidateVotes%
Democratic Chet Holifield (Incumbent) 97,934 65.4
Republican C. Everett Hunt51,74734.6
Total votes149,681 100.0
Turnout  
Democratic hold

1966

1966 United States House of Representatives elections [33]
PartyCandidateVotes%
Democratic Chet Holifield (Incumbent) 82,592 62.3
Republican William R. Sutton50,06837.7
Total votes132,660 100.0
Turnout  
Democratic hold

1968

1968 United States House of Representatives elections [34]
PartyCandidateVotes%
Democratic Chet Holifield (Incumbent) 96,857 63.2
Republican Bill Jones 52,28434.1
American Independent Wayne L. Cook3,9962.6
Total votes153,137 100.0
Turnout  
Democratic hold

1970

1970 United States House of Representatives elections [35]
PartyCandidateVotes%
Democratic Chet Holifield (Incumbent) 98,578 70.4
Republican Bill Jones 41,46229.6
Total votes140,040 100.0
Turnout  
Democratic hold

1972

1972 United States House of Representatives elections [36]
PartyCandidateVotes%
Democratic Chet Holifield (Incumbent) 103,823 67.2
Republican Kenneth M. Fisher43,03427.9
Peace and Freedom Joe Harris7,5884.9
Total votes154,445 100.0
Turnout  
Democratic hold

1974

1974 United States House of Representatives elections [37]
PartyCandidateVotes%
Republican Robert J. Lagomarsino (Incumbent) 84,849 56.3
Democratic James D. Loebl65,33443.7
Total votes150,183 100.0
Turnout  
Republican hold

1976

1976 United States House of Representatives elections [38]
PartyCandidateVotes%
Republican Robert J. Lagomarsino (Incumbent) 124,201 64.4
Democratic Dan Sisson68,72235.6
Total votes192,923 100.0
Turnout  
Republican hold

1978

1978 United States House of Representatives elections [39]
PartyCandidateVotes%
Republican Robert J. Lagomarsino (Incumbent) 123,192 71.7
Democratic Jerry Zamos41,67224.3
Peace and Freedom Milton Shiro Takei6,8874.0
Total votes171,751 100.0
Turnout  
Republican hold

1980

1980 United States House of Representatives elections [40]
PartyCandidateVotes%
Republican Robert J. Lagomarsino (Incumbent) 162,849 77.7
Democratic Carmen Lodise36,99017.6
Libertarian Jim Trotter9,7644.7
Total votes209,603 100.0
Turnout  
Republican hold

1982

1982 United States House of Representatives elections [41]
PartyCandidateVotes%
Republican Robert J. Lagomarsino (Incumbent) 112,486 61.1
Democratic Frank Frost66,04235.8
Libertarian R. C. Gordon-McCutchan4,1982.3
Peace and Freedom Charles J. Zekan1,5200.8
Total votes184,246 100.0
Turnout  
Republican hold

1984

1984 United States House of Representatives elections [42]
PartyCandidateVotes%
Republican Robert J. Lagomarsino (Incumbent) 153,187 67.3
Democratic James C. Carey Jr.70,27830.9
Peace and Freedom Charles J. Zekan4,1611.8
Total votes227,626 100.0
Turnout  
Republican hold

1986

1986 United States House of Representatives elections [43]
PartyCandidateVotes%
Republican Robert J. Lagomarsino (Incumbent) 122,578 71.9
Democratic Wayne B. Norris45,61926.8
Libertarian George Hasara2,3411.4
Total votes170,538 100.0
Turnout  
Republican hold

1988

1988 United States House of Representatives elections [44]
PartyCandidateVotes%
Republican Robert J. Lagomarsino (Incumbent) 116,026 50.2
Democratic Gary K. Hart112,03348.5
Libertarian Robert Donaldson2,8651.2
Total votes230,924 100.0
Turnout  
Republican hold

1990

1990 United States House of Representatives elections [45]
PartyCandidateVotes%
Republican Robert J. Lagomarsino (Incumbent) 94,599 54.6
Democratic Anita Perez Ferguson 76,99144.4
No partyLorenz (write-in)1,6551.0
Total votes173,235 100.0
Turnout  
Republican hold

1992

1992 United States House of Representatives elections [46]
PartyCandidateVotes%
Democratic Richard H. Lehman (Incumbent) 101,619 46.9
Republican Tal L. Cloud100,59046.4
Peace and Freedom Dorothy L. Wells13,3346.2
No partyWilliams (write-in)1,0970.5
Total votes216,640 100.0
Turnout  
Democratic hold

1994

1994 United States House of Representatives elections [47]
PartyCandidateVotes%
Republican George Radanovich 104,435 56.78
Democratic Richard Lehman (Incumbent)72,91239.64
Libertarian Dolores Comstock6,5793.58
Total votes183,926 100.0
Turnout  
Republican gain from Democratic

1996

1996 United States House of Representatives elections [48]
PartyCandidateVotes%
Republican George Radanovich (Incumbent) 137,402 66.6
Democratic Paul Barile58,45228.4
Libertarian Pamela Pescosolido6,0832.9
Natural Law David Adalian4,4422.1
Total votes206,379 100.0
Turnout  
Republican hold

1998

1998 United States House of Representatives elections [49]
PartyCandidateVotes%
Republican George Radanovich (Incumbent) 131,105 79.39
Democratic Paul Barile34,04420.61
Total votes165,149 100.0
Turnout  
Republican hold

2000

2000 United States House of Representatives elections [50]
PartyCandidateVotes%
Republican George Radanovich (Incumbent) 144,517 65.0
Democratic Dan Rosenberg70,57831.8
Libertarian Elizabeth Taylor4,2641.9
Natural Law Bob Miller1,9900.8
American Independent Edmon V. Kaiser1,2660.5
Total votes222,615 100.0
Turnout  
Republican hold

2002

2002 United States House of Representatives elections [51]
PartyCandidateVotes%
Republican George Radanovich (Incumbent) 106,209 67.4
Democratic John Veen47,40330.0
Libertarian Patrick Lee McHargue4,1902.6
Total votes157,802 100.0
Turnout  
Republican hold

2004

2004 United States House of Representatives elections [52]
PartyCandidateVotes%
Republican George Radanovich (Incumbent) 155,354 66.1
Democratic James Lex Bufford79,97027.2
Green Larry R. Mullen15,8636.7
Total votes251,187 100.0
Turnout  
Republican hold

2006

2006 United States House of Representatives elections [53]
PartyCandidateVotes%
Republican George Radanovich (Incumbent) 110,246 60.6
Democratic T.J. Cox 71,74839.4
Total votes181,994 100.0
Turnout  
Republican hold

2008

2008 United States House of Representatives elections [54]
PartyCandidateVotes%
Republican George Radanovich (Incumbent) 179,245 98.43
Democratic Peter Leinau (write-in)2,4901.37
Independent Phil Rockey (write-in)3660.20
Total votes182,101 100.00
Turnout  51.19
Republican hold

2010

This election was the final election before 19th district was redrawn. Jeff Denham won his 2012 re-election as a representative of the 10th district.

2010 United States House of Representatives elections [55]
PartyCandidateVotes%
Republican Jeff Denham 128,394 64.6
Democratic Loraine Goodwin69,91235.2
Democratic Les Marsden (write-in)5960.2
Total votes198,902 100.0
Republican hold

2012

2012 United States House of Representatives elections [56]
PartyCandidateVotes%
Democratic Zoe Lofgren (Incumbent) 162,300 73%
Republican Robert Murray59,31327%
Total votes221,613 100%
Democratic hold

2014

2014 United States House of Representatives elections [57]
PartyCandidateVotes%
Democratic Zoe Lofgren (Incumbent) 85,888 67%
Republican Robert Murray41,90033%
Total votes127,788 100%
Democratic hold

2016

2016 United States House of Representatives elections
PartyCandidateVotes%
Democratic Zoe Lofgren (Incumbent) 181,802 74%
Republican G. Burt Lancaster64,06126%
Total votes245,863 100%
Democratic hold

2018

2018 United States House of Representatives elections
PartyCandidateVotes%
Democratic Zoe Lofgren (Incumbent) 162,496 74%
Republican Justin James Aguilera57,82326%
Total votes220,319 100%
Democratic hold

2020

2020 United States House of Representatives elections in California
PartyCandidateVotes%
Democratic Zoe Lofgren (incumbent) 224,385 71.7
Republican Justin Aguilera88,64228.3
Total votes313,027 100.0
Democratic hold

2022

2022 United States House of Representatives elections in California
PartyCandidateVotes%
Democratic Jimmy Panetta (incumbent) 194,494 68.7
Republican Jeff Gorman88,81631.3
Total votes283,310 100.0
Democratic hold

See also

Related Research Articles

California's 48th congressional district is a congressional district in the U.S. state of California based in San Diego County in Southern California. It is currently represented by Republican Darrell Issa.

California's 9th congressional district is a congressional district in the U.S. state of California. Josh Harder, a Democrat, has represented the district since January 2023.

<span class="mw-page-title-main">California's 38th congressional district</span> U.S. House district for California

California's 38th congressional district is a congressional district in the U.S. state of California based in suburban eastern Los Angeles County and Orange County, California. The district is currently represented by Democrat Linda Sánchez.

California's 50th congressional district is a congressional district in the U.S. state of California, and encompasses parts of the Mid-Coast and northeastern parts of San Diego County. Scott Peters is currently the U.S. representative for California's 50th congressional district.

California's 51st congressional district is a congressional district in the U.S. state of California. The district is currently represented by Democrat Sara Jacobs. The district currently includes central and eastern portions of San Diego, as well as eastern suburbs such as El Cajon, La Mesa, Spring Valley, and Lemon Grove.

California's 18th congressional district is a congressional district located in the U.S. state of California. The district is currently represented by Democrat Zoe Lofgren. Since the 2022 election, the district is landlocked and includes all of San Benito County and parts of Santa Clara and Monterey counties, including Salinas, Hollister, Watsonville, Gilroy, Soledad, and downtown and eastern San Jose.

<span class="mw-page-title-main">California's 41st congressional district</span> U.S. House district for California

California's 41st congressional district is a congressional district in Riverside County, in the U.S. state of California. The district is currently represented by Republican Ken Calvert.

California's 3rd congressional district is a U.S. congressional district in California. It includes the northern Sierra Nevada and northeastern suburbs of Sacramento, stretching south to Death Valley. It encompasses Alpine, Inyo, Mono, Nevada, Placer, Plumas, and Sierra counties, as well as parts of El Dorado, Sacramento, and Yuba counties. It includes the Sacramento suburbs of Roseville, Folsom, Orangevale, Rocklin, and Lincoln, and the mountain towns of Quincy, South Lake Tahoe, Truckee, Mammoth Lakes, and Bishop. The district is represented by Republican Kevin Kiley.

California's 16th congressional district is a congressional district in the U.S. state of California. It includes portions of Santa Clara, San Mateo, and Santa Cruz counties, extending from the southwestern San Francisco Bay Area through the Santa Cruz Mountains to the Pacific coast. The district is currently represented by Democrat Anna Eshoo.

California's 17th congressional district is a congressional district in the U.S. state of California that is currently represented by Ro Khanna. It is located in the South Bay and East Bay regions of the San Francisco Bay Area.

California's 23rd congressional district is a congressional district in the U.S. state of California. The district is represented in the 118th United States Congress by Jay Obernolte.

California's 24th congressional district is a congressional district in the U.S. state of California. The district is currently represented by Salud Carbajal. It contains all of Santa Barbara County, most of San Luis Obispo County, and part of Ventura County. Cities in the district include Santa Barbara, Ventura, San Luis Obispo, Santa Maria, and Ojai.

<span class="mw-page-title-main">California's 28th congressional district</span> U.S. House district for California

California's 28th congressional district is a congressional district in the U.S. state of California, in Los Angeles County. The district is regarded as a Democratic stronghold and has been held by the Democratic Party since 2003 and is currently represented by Democrat Judy Chu.

<span class="mw-page-title-main">California's 29th congressional district</span> U.S. House district for California

California's 29th congressional district is a congressional district in the U.S. state of California based in the north central San Fernando Valley. The district is represented by Democrat Tony Cárdenas.

<span class="mw-page-title-main">California's 30th congressional district</span> U.S. House district for California

California's 30th congressional district is a congressional district in the U.S. state of California. The 30th district takes in all of Burbank and Glendale, the Linda Vista neighborhood of Pasadena, and the Los Angeles communities of Tujunga, Hollywood, West Hollywood, Edendale, Park La Brea, Hancock Park, and westside Echo Park. The district is currently represented by Democrat Adam Schiff.

California's 31st congressional district is a congressional district in Los Angeles County, in the U.S. state of California. The district is located in the San Gabriel Valley.

<span class="mw-page-title-main">California's 35th congressional district</span> U.S. House district for California

California's 35th congressional district is a U.S. congressional district in California. The district is currently represented by Democrat Norma Torres.

<span class="mw-page-title-main">California's 36th congressional district</span> U.S. House district for California

California's 36th congressional district is a U.S. congressional district in California. The 36th district is located primarily in the South Bay and Westside regions of Los Angeles. It takes in the cities of Beverly Hills, Santa Monica, the west side of Culver City, Hermosa Beach, Rancho Palos Verdes, Redondo Beach, Palos Verdes Estates, Rolling Hills Estates, El Segundo, Lomita, Manhattan Beach, and the west side of Torrance, as well as the Los Angeles neighborhoods of Venice, Playa del Rey, Palms, Cheviot Hills, Westwood Village, West Los Angeles, Mar Vista, Westchester, Marina Peninsula, and west side Harbor City.

California's 40th congressional district is a congressional district in the U.S. state of California, encompassing Orange, San Bernardino, and Riverside counties. The district is currently represented by Republican Young Kim. It was one of 18 districts that would have voted for Joe Biden in the 2020 presidential election had they existed in their current configuration while being won or held by a Republican in 2022.

<span class="mw-page-title-main">California's 42nd congressional district</span> U.S. House district for California

California's 42nd congressional district is a U.S. congressional district in California. The district is currently represented by Democrat Robert Garcia.

References

  1. "My Congressional District".
  2. "2022 Cook PVI: District Map and List". Cook Political Report. Retrieved January 10, 2023.
  3. "CA 2022 Congressional". Dave's Redistricting. January 4, 2022. Retrieved November 11, 2022.
  4. "Statement of Vote (2000 President)" (PDF). Archived from the original (PDF) on May 20, 2011. Retrieved September 17, 2008.
  5. "Statement of Vote (2000 Senator)" (PDF). Archived from the original (PDF) on May 20, 2011. Retrieved September 17, 2008.
  6. Statement of Vote (2002 Governor) Archived November 11, 2010, at the Wayback Machine
  7. "Statement of Vote (2003 Recall Question)" (PDF). Archived from the original (PDF) on May 20, 2011. Retrieved October 8, 2007.
  8. "Statement of Vote (2003 Governor)" (PDF). Archived from the original (PDF) on May 20, 2011. Retrieved October 8, 2007.
  9. "Statement of Vote (2004 President)" (PDF). Archived from the original (PDF) on May 20, 2011. Retrieved August 8, 2007.
  10. Statement of Vote (2004 Senator) Archived August 10, 2011, at the Wayback Machine
  11. Statement of Vote (2006 Governor) Archived August 10, 2011, at the Wayback Machine
  12. Statement of Vote (2006 Senator) Archived August 10, 2011, at the Wayback Machine
  13. "(2008 President)". Archived from the original on February 11, 2009. Retrieved March 5, 2009.
  14. "Counties by Congressional District for Recall Question" (PDF). sos.ca.gov. September 14, 2021. Retrieved May 2, 2022.
  15. "Counties by Congressional Districts for Governor" (PDF). sos.ca.gov. November 8, 2022. Retrieved May 4, 2023.
  16. 1932 election results
  17. 1934 election results
  18. 1936 election results
  19. 1938 election results
  20. 1940 election results
  21. 1942 election results
  22. 1944 election results
  23. 1946 election results
  24. 1948 election results
  25. 1950 election results
  26. 1952 election results
  27. 1954 election results
  28. 1956 election results
  29. 1958 election results
  30. 1960 election results
  31. 1962 election results
  32. 1964 election results
  33. 1966 election results
  34. 1968 election results
  35. 1970 election results
  36. 1972 election results
  37. 1974 election results
  38. 1976 election results
  39. 1978 election results
  40. 1980 election results
  41. 1982 election results
  42. 1984 election results
  43. 1986 election results
  44. 1988 election results
  45. 1990 election results
  46. 1992 election results
  47. 1994 election results
  48. 1996 election results
  49. 1998 election results
  50. 2000 election results
  51. 2002 general election results Archived February 3, 2009, at the Wayback Machine
  52. 2004 general election results Archived August 21, 2008, at the Wayback Machine
  53. 2006 general election results Archived November 27, 2008, at the Wayback Machine
  54. 2008 general election results Archived December 21, 2008, at the Wayback Machine
  55. "2010 general election results" (PDF). Archived from the original (PDF) on May 20, 2011. Retrieved December 25, 2010.
  56. 2012 general election results Archived October 19, 2013, at the Wayback Machine
  57. "U.S. House of Representatives District 19 - Districtwide Results". Archived from the original on December 21, 2014. Retrieved December 21, 2014.

37°36′N120°00′W / 37.6°N 120°W / 37.6; -120