Religion in Punjab
2001 and 2011 census
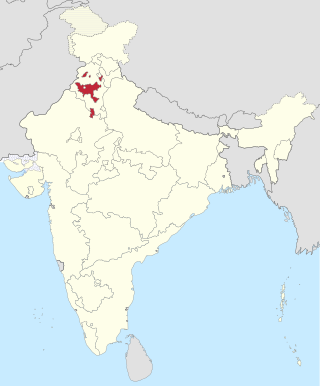
Sikhism is the most practiced faith in Punjab, practiced by 16 million people representing 57.69% of the population of Punjab population, making it the only Sikh-majority state in India. Around 38.49% of the population i.e. 10.67 million practice Hinduism, while Islam is followed by 5.35 lakhs comprising 1.93% of the state population. [44] Other faiths include Buddhism, Christianity and Jainism. [45]
| Religion | 2001 [46] | 2011 [47] |
|---|---|---|
| Sikhism | 14,592,387 | 16,004,754 |
| Hinduism | 8,997,942 | 10,678,138 |
| Islam | 382,045 | 535,489 |
| Christianity | 292,800 | 348,230 |
| Jainism | 39,276 | 45,040 |
| Buddhism | 41,487 | 33,237 |
| Other | 8,594 | 10,886 |
| Not stated | n/a | 87,564 |
| Total | 24,358,999 | 27,743,338 |
| Religion | 2001 [46] | 2011 [46] |
|---|---|---|
| Sikhism | 59.90 | 57.69 |
| Hinduism | 36.94 | 38.49 |
| Islam | 1.57 | 1.93 |
| Christianity | 1.20 | 1.26 |
| Jainism | 0.16 | 0.16 |
| Buddhism | 0.17 | 0.12 |
| Other | 0.03 | 0.04 |
| Not stated | n/a | 0.31 |
Urban and rural areas
The table given below shows the religion in the urban areas of Punjab, according to 2011 census. [48]
| Religion | Percentage % | Urban population |
|---|---|---|
| Hindu | 60.41% | 6,282,072 |
| Sikh | 35.16% | 3,656,299 |
| Muslim | 2.47% | 256,664 |
| Christian | 1.01% | 105,253 |
| Jain | 0.39% | 40,674 |
| Buddhist | 0.09% | 9,660 |
| Other religions and persuasions | 0.04% | 4,240 |
| Religion not stated | 0.43% | 44,284 |
| Total | 10,399,146 |
The table given below shows the religion in the rural areas of Punjab, according to 2011 census. [48]
| Religion | Percentage % | Rural population |
|---|---|---|
| Sikh | 71.20% | 12,348,455 |
| Hindu | 25.35% | 4,396,066 |
| Muslim | 1.61% | 278,825 |
| Christian | 1.40% | 242,977 |
| Buddhist | 0.14% | 23,577 |
| Jain | 0.03% | 4,366 |
| Other religions and persuasions | 0.04% | 6,646 |
| Religion not stated | 0.25% | 43,280 |
| Total | 17,344,192 |
The table below shows the population of different religions in absolute numbers in the urban and rural areas of Punjab.
| Religion | Urban (2011) | Rural (2011) | Urban (2001) | Rural (2001) | Urban (1991) | Rural (1991) |
|---|---|---|---|---|---|---|
| Hindu | 62,82,072 | 43,96,066 | 49,33,743 | 40,64,199 | 29,81,804 | 32,18,391 |
| Sikh | 36,56,299 | 1,23,48,455 | 30,24,950 | 1,15,67,437 | 15,42,623 | 86,56,518 |
| Christian | 1,05,253 | 2,42,977 | 81,642 | 2,11,160 | 33,503 | 1,51,431 |
| Muslim | 2,56,664 | 2,78,825 | 1,66,529 | 2,15,518 | 60,395 | 1,07,699 |
| Other religions | 98,858 | 77,869 | 55,649 | 38,176 | 29,432 | 7,119 |
1941 census
East Punjab region
Religions in East Punjab, India region (1941) [50] : 42 [lower-alpha 6]
Prior to partition, the eastern portion of Punjab that was ultimately awarded to India following the demarcation of the Radcliffe Line was made into a new province – East Punjab. The area includes the contemporary states of Punjab, Haryana, and Himachal Pradesh. Below is the religious demographics of this region broken down by district and princely state with an overall total as per the 1941 Indian census.
| District/ Princely State | Hinduism | Islam | Sikhism | Christianity | Jainism | Others [lower-alpha 8] | Total | |||||||
|---|---|---|---|---|---|---|---|---|---|---|---|---|---|---|
| Pop. | % | Pop. | % | Pop. | % | Pop. | % | Pop. | % | Pop. | % | Pop. | % | |
| Patiala State | 597,488 | 30.86% | 436,539 | 22.55% | 896,021 | 46.28% | 1,592 | 0.08% | 3,101 | 0.16% | 1,518 | 0.08% | 1,936,259 | 100% |
| Firozpur District | 287,733 | 20.22% | 641,448 | 45.07% | 479,486 | 33.69% | 12,607 | 0.89% | 1,674 | 0.12% | 128 | 0.01% | 1,423,076 | 100% |
| Amritsar District | 217,431 | 15.38% | 657,695 | 46.52% | 510,845 | 36.13% | 25,973 | 1.84% | 1,911 | 0.14% | 21 | 0% | 1,413,876 | 100% |
| Hoshiarpur District | 584,080 | 49.91% | 380,759 | 32.53% | 198,194 | 16.93% | 6,165 | 0.53% | 1,125 | 0.1% | 0 | 0% | 1,170,323 | 100% |
| Jalandhar District | 311,010 | 27.59% | 509,804 | 45.23% | 298,741 | 26.5% | 6,233 | 0.55% | 1,395 | 0.12% | 7 | 0% | 1,127,190 | 100% |
| Hisar District | 652,842 | 64.85% | 285,208 | 28.33% | 60,731 | 6.03% | 1,292 | 0.13% | 6,126 | 0.61% | 510 | 0.05% | 1,006,709 | 100% |
| Karnal District | 666,301 | 66.99% | 304,346 | 30.6% | 19,887 | 2% | 1,249 | 0.13% | 2,789 | 0.28% | 3 | 0% | 994,575 | 100% |
| Rohtak District | 780,474 | 81.61% | 166,569 | 17.42% | 1,466 | 0.15% | 1,043 | 0.11% | 6,847 | 0.72% | 0 | 0% | 956,399 | 100% |
| Kangra District | 846,531 | 94.12% | 43,249 | 4.81% | 4,809 | 0.53% | 788 | 0.09% | 101 | 0.01% | 3,899 | 0.43% | 899,377 | 100% |
| Gurdaspur District [lower-alpha 9] | 174,221 | 20.21% | 440,323 | 51.08% | 200,688 | 23.28% | 46,743 | 5.42% | 25 | 0% | 6 | 0% | 862,006 | 100% |
| Gurgaon District | 560,537 | 65.83% | 285,992 | 33.59% | 637 | 0.07% | 1,673 | 0.2% | 2,613 | 0.31% | 6 | 0% | 851,458 | 100% |
| Ambala District | 412,658 | 48.68% | 268,999 | 31.73% | 156,543 | 18.47% | 6,065 | 0.72% | 3,065 | 0.36% | 415 | 0.05% | 847,745 | 100% |
| Ludhiana District | 171,715 | 20.98% | 302,482 | 36.95% | 341,175 | 41.68% | 1,913 | 0.23% | 1,279 | 0.16% | 51 | 0.01% | 818,615 | 100% |
| Kapurthala State | 61,546 | 16.27% | 213,754 | 56.49% | 88,350 | 23.35% | 1,667 | 0.44% | 380 | 0.1% | 12,683 | 3.35% | 378,380 | 100% |
| Jind State | 268,355 | 74.17% | 50,972 | 14.09% | 40,981 | 11.33% | 161 | 0.04% | 1,294 | 0.36% | 49 | 0.01% | 361,812 | 100% |
| Simla Hill States | 345,716 | 96.16% | 10,812 | 3.01% | 2,693 | 0.75% | 161 | 0.04% | 126 | 0.04% | 12 | 0% | 359,520 | 100% |
| Nabha State | 146,518 | 42.59% | 70,373 | 20.45% | 122,451 | 35.59% | 221 | 0.06% | 480 | 0.14% | 1 | 0% | 344,044 | 100% |
| Mandi State | 227,463 | 97.79% | 4,328 | 1.86% | 583 | 0.25% | 11 | 0% | 0 | 0% | 208 | 0.09% | 232,593 | 100% |
| Faridkot State | 21,814 | 10.95% | 61,352 | 30.79% | 115,070 | 57.74% | 247 | 0.12% | 800 | 0.4% | 0 | 0% | 199,283 | 100% |
| Chamba State | 155,910 | 92.3% | 12,318 | 7.29% | 107 | 0.06% | 190 | 0.11% | 0 | 0% | 383 | 0.23% | 168,908 | 100% |
| Sirmoor State | 146,199 | 93.7% | 7,374 | 4.73% | 2,334 | 1.5% | 38 | 0.02% | 81 | 0.05% | 0 | 0% | 156,026 | 100% |
| Bilaspur State | 108,375 | 98.22% | 1,498 | 1.36% | 453 | 0.41% | 7 | 0.01% | 3 | 0% | 0 | 0% | 110,336 | 100% |
| Malerkotla State | 23,482 | 26.65% | 33,881 | 38.45% | 30,320 | 34.41% | 116 | 0.13% | 310 | 0.35% | 0 | 0% | 88,109 | 100% |
| Suket State | 69,974 | 98.43% | 884 | 1.24% | 234 | 0.33% | 0 | 0% | 0 | 0% | 0 | 0% | 71,092 | 100% |
| Kalsia State | 29,866 | 44.32% | 25,049 | 37.17% | 12,235 | 18.15% | 55 | 0.08% | 188 | 0.28% | 0 | 0% | 67,393 | 100% |
| Simla District | 29,466 | 76.38% | 7,022 | 18.2% | 1,032 | 2.68% | 934 | 2.42% | 114 | 0.3% | 8 | 0.02% | 38,576 | 100% |
| Dujana State | 23,727 | 77.37% | 6,939 | 22.63% | 0 | 0% | 0 | 0% | 0 | 0% | 0 | 0% | 30,666 | 100% |
| Loharu State | 23,923 | 85.77% | 3,960 | 14.2% | 7 | 0.03% | 2 | 0.01% | 0 | 0% | 0 | 0% | 27,892 | 100% |
| Pataudi State | 17,728 | 82.38% | 3,655 | 16.98% | 0 | 0% | 9 | 0.04% | 128 | 0.59% | 0 | 0% | 21,520 | 100% |
| Total | 7,963,083 | 46.95% | 5,237,584 | 30.88% | 3,586,073 | 21.14% | 117,155 | 0.69% | 35,955 | 0.21% | 19,908 | 0.12% | 16,959,758 | 100% |
| Territory comprises the contemporary subdivisions of Punjab, India, Chandigarh, Haryana, and Himachal Pradesh. | ||||||||||||||
Contemporary Punjab state
Religions in contemporary Punjab State, India region (1941) [50] : 42 [lower-alpha 5]
The religious demography according to the 1941 census for the region that comprises the contemporary state of Punjab, India is also shown below, broken down by district and princely state with an overall total.
| District/ Princely State | Islam | Sikhism | Hinduism | Christianity | Jainism | Others [lower-alpha 8] | Total | |||||||
|---|---|---|---|---|---|---|---|---|---|---|---|---|---|---|
| Pop. | % | Pop. | % | Pop. | % | Pop. | % | Pop. | % | Pop. | % | Pop. | % | |
| Patiala State | 436,539 | 22.55% | 896,021 | 46.28% | 597,488 | 30.86% | 1,592 | 0.08% | 3,101 | 0.16% | 1,518 | 0.08% | 1,936,259 | 100% |
| Firozpur District | 641,448 | 45.07% | 479,486 | 33.69% | 287,733 | 20.22% | 12,607 | 0.89% | 1,674 | 0.12% | 128 | 0.01% | 1,423,076 | 100% |
| Amritsar District | 657,695 | 46.52% | 510,845 | 36.13% | 217,431 | 15.38% | 25,973 | 1.84% | 1,911 | 0.14% | 21 | 0% | 1,413,876 | 100% |
| Hoshiarpur District | 380,759 | 32.53% | 198,194 | 16.93% | 584,080 | 49.91% | 6,165 | 0.53% | 1,125 | 0.1% | 0 | 0% | 1,170,323 | 100% |
| Jalandhar District | 509,804 | 45.23% | 298,741 | 26.5% | 311,010 | 27.59% | 6,233 | 0.55% | 1,395 | 0.12% | 7 | 0% | 1,127,190 | 100% |
| Gurdaspur District [lower-alpha 9] | 440,323 | 51.08% | 200,688 | 24.44% | 174,221 | 20.21% | 46,743 | 5.42% | 25 | 0% | 6 | 0% | 862,006 | 100% |
| Ludhiana District | 302,482 | 36.95% | 341,175 | 41.68% | 171,715 | 20.98% | 1,913 | 0.23% | 1,279 | 0.16% | 51 | 0.01% | 818,615 | 100% |
| Kapurthala State | 213,754 | 56.49% | 88,350 | 23.35% | 61,546 | 16.27% | 1,667 | 0.44% | 380 | 0.1% | 12,683 | 3.35% | 378,380 | 100% |
| Nabha State | 70,373 | 20.45% | 122,451 | 35.59% | 146,518 | 42.59% | 221 | 0.06% | 480 | 0.14% | 1 | 0% | 344,044 | 100% |
| Faridkot State | 61,352 | 30.79% | 115,070 | 57.74% | 21,814 | 10.95% | 247 | 0.12% | 800 | 0.4% | 0 | 0% | 199,283 | 100% |
| Malerkotla State | 33,881 | 38.45% | 30,320 | 34.41% | 23,482 | 26.65% | 116 | 0.13% | 310 | 0.35% | 0 | 0% | 88,109 | 100% |
| Total | 3,748,410 | 38.42% | 3,281,341 | 33.63% | 2,597,038 | 26.62% | 103,477 | 1.06% | 12,480 | 0.13% | 14,415 | 0.15% | 9,757,161 | 100% |
| Territory comprises the contemporary state of Punjab, India. | ||||||||||||||
1931 census
East Punjab region
Religions in East Punjab, India region (1931) [51] : 277 [lower-alpha 10]
Prior to partition, the eastern portion of Punjab that was ultimately awarded to India following the demarcation of the Radcliffe Line was made into a new province – East Punjab. The area includes the contemporary states of Punjab, Haryana, and Himachal Pradesh. Below is the religious demographics of this region broken down by district and princely state with an overall total as per the 1931 Indian census.
| District/ Princely State | Hinduism | Islam | Sikhism | Christianity | Jainism | Others [lower-alpha 8] | Total | |||||||
|---|---|---|---|---|---|---|---|---|---|---|---|---|---|---|
| Pop. | % | Pop. | % | Pop. | % | Pop. | % | Pop. | % | Pop. | % | Pop. | % | |
| Patiala State | 623,597 | 38.36% | 363,920 | 22.39% | 632,972 | 38.94% | 1,449 | 0.09% | 3,578 | 0.22% | 4 | 0% | 1,625,520 | 100% |
| Firozpur District | 244,688 | 21.15% | 515,430 | 44.56% | 388,108 | 33.55% | 7,070 | 0.61% | 1,411 | 0.12% | 25 | 0% | 1,156,732 | 100% |
| Amritsar District | 174,556 | 15.63% | 524,676 | 46.97% | 399,951 | 35.8% | 16,619 | 1.49% | 1,272 | 0.11% | 46 | 0% | 1,117,120 | 100% |
| Hoshiarpur District | 526,182 | 50.98% | 328,078 | 31.78% | 173,147 | 16.77% | 3,764 | 0.36% | 1,016 | 0.1% | 0 | 0% | 1,032,187 | 100% |
| Jalandhar District | 268,822 | 28.49% | 419,556 | 44.46% | 249,571 | 26.45% | 4,323 | 0.46% | 1,379 | 0.15% | 70 | 0.01% | 943,721 | 100% |
| Hisar District | 583,429 | 64.86% | 253,784 | 28.21% | 55,169 | 6.13% | 1,107 | 0.12% | 5,988 | 0.67% | 2 | 0% | 899,479 | 100% |
| Karnal District | 570,297 | 66.89% | 259,730 | 30.46% | 16,928 | 1.99% | 1,469 | 0.17% | 4,190 | 0.49% | 0 | 0% | 852,614 | 100% |
| Rohtak District | 655,963 | 81.42% | 137,880 | 17.11% | 596 | 0.07% | 4,807 | 0.6% | 6,375 | 0.79% | 0 | 0% | 805,621 | 100% |
| Kangra District | 752,098 | 93.86% | 40,483 | 5.05% | 2,396 | 0.3% | 576 | 0.07% | 94 | 0.01% | 5,665 | 0.71% | 801,312 | 100% |
| Ambala District | 346,809 | 46.68% | 230,837 | 31.07% | 155,555 | 20.94% | 7,141 | 0.96% | 2,550 | 0.34% | 10 | 0% | 742,902 | 100% |
| Gurgaon District | 493,174 | 66.63% | 242,357 | 32.74% | 500 | 0.07% | 1,463 | 0.2% | 2,665 | 0.36% | 4 | 0% | 740,163 | 100% |
| Gurdaspur District [lower-alpha 9] | 154,631 | 21.37% | 367,388 | 50.78% | 162,741 | 22.49% | 38,756 | 5.36% | 15 | 0% | 4 | 0% | 723,535 | 100% |
| Ludhiana District | 120,161 | 17.87% | 235,598 | 35.03% | 312,829 | 46.52% | 2,477 | 0.37% | 1,419 | 0.21% | 10 | 0% | 672,494 | 100% |
| Simla Hill States | 317,390 | 95.93% | 10,017 | 3.03% | 1,817 | 0.55% | 176 | 0.05% | 141 | 0.04% | 1,309 | 0.4% | 330,850 | 100% |
| Jind State | 243,561 | 75.02% | 46,002 | 14.17% | 33,290 | 10.25% | 210 | 0.06% | 1,613 | 0.5% | 0 | 0% | 324,676 | 100% |
| Kapurthala State | 64,319 | 20.31% | 179,251 | 56.59% | 72,177 | 22.79% | 983 | 0.31% | 27 | 0.01% | 0 | 0% | 316,757 | 100% |
| Nabha State | 132,354 | 46.02% | 57,393 | 19.96% | 97,452 | 33.89% | 66 | 0.02% | 309 | 0.11% | 0 | 0% | 287,574 | 100% |
| Mandi State | 199,935 | 96.37% | 6,351 | 3.06% | 899 | 0.43% | 141 | 0.07% | 0 | 0% | 139 | 0.07% | 207,465 | 100% |
| Faridkot State | 20,855 | 12.69% | 49,912 | 30.37% | 92,880 | 56.51% | 167 | 0.1% | 550 | 0.33% | 0 | 0% | 164,364 | 100% |
| Sirmoor State | 139,031 | 93.58% | 7,020 | 4.73% | 2,413 | 1.62% | 52 | 0.04% | 52 | 0.04% | 0 | 0% | 148,568 | 100% |
| Chamba State | 135,254 | 92.09% | 10,839 | 7.38% | 112 | 0.08% | 94 | 0.06% | 3 | 0% | 568 | 0.39% | 146,870 | 100% |
| Bilaspur State | 99,023 | 98.05% | 1,458 | 1.44% | 507 | 0.5% | 6 | 0.01% | 0 | 0% | 0 | 0% | 100,994 | 100% |
| Malerkotla State | 21,252 | 25.58% | 31,417 | 37.82% | 28,982 | 34.89% | 135 | 0.16% | 1,286 | 1.55% | 0 | 0% | 83,072 | 100% |
| Kalsia State | 28,832 | 48.18% | 21,797 | 36.42% | 9,035 | 15.1% | 22 | 0.04% | 162 | 0.27% | 0 | 0% | 59,848 | 100% |
| Suket State | 57,616 | 98.64% | 733 | 1.25% | 44 | 0.08% | 1 | 0% | 0 | 0% | 14 | 0.02% | 58,408 | 100% |
| Simla District | 28,661 | 77.91% | 5,810 | 15.79% | 760 | 2.07% | 1,540 | 4.19% | 1 | 0% | 14 | 0.04% | 36,786 | 100% |
| Dujana State | 22,347 | 79.2% | 5,863 | 20.78% | 1 | 0% | 5 | 0.02% | 0 | 0% | 0 | 0% | 28,216 | 100% |
| Loharu State | 20,198 | 86.55% | 3,119 | 13.36% | 2 | 0.01% | 1 | 0% | 18 | 0.08% | 0 | 0% | 23,338 | 100% |
| Pataudi State | 15,596 | 82.64% | 3,168 | 16.79% | 1 | 0.01% | 3 | 0.02% | 105 | 0.56% | 0 | 0% | 18,873 | 100% |
| Total | 7,060,631 | 48.86% | 4,359,867 | 30.17% | 2,890,835 | 20.01% | 94,623 | 0.65% | 36,219 | 0.25% | 7,884 | 0.05% | 14,450,059 | 100% |
| Territory comprises the contemporary subdivisions of Punjab, India, Chandigarh, Haryana, and Himachal Pradesh. | ||||||||||||||
Contemporary Punjab state
Religions in contemporary Punjab State, India region (1931) [51] : 277 [lower-alpha 4]
The religious demography according to the 1931 census for the region that comprises the contemporary state of Punjab, India is also shown below, broken down by district and princely state with an overall total.
| District/ Princely State | Islam | Sikhism | Hinduism | Christianity | Jainism | Others [lower-alpha 8] | Total | |||||||
|---|---|---|---|---|---|---|---|---|---|---|---|---|---|---|
| Pop. | % | Pop. | % | Pop. | % | Pop. | % | Pop. | % | Pop. | % | Pop. | % | |
| Patiala State | 363,920 | 22.39% | 632,972 | 38.94% | 623,597 | 38.36% | 1,449 | 0.09% | 3,578 | 0.22% | 4 | 0% | 1,625,520 | 100% |
| Firozpur District | 515,430 | 44.56% | 388,108 | 33.55% | 244,688 | 21.15% | 7,070 | 0.61% | 1,411 | 0.12% | 25 | 0% | 1,156,732 | 100% |
| Amritsar District | 524,676 | 46.97% | 399,951 | 35.8% | 174,556 | 15.63% | 16,619 | 1.49% | 1,272 | 0.11% | 46 | 0% | 1,117,120 | 100% |
| Hoshiarpur District | 328,078 | 31.78% | 173,147 | 16.77% | 526,182 | 50.98% | 3,764 | 0.36% | 1,016 | 0.1% | 0 | 0% | 1,032,187 | 100% |
| Jalandhar District | 419,556 | 44.46% | 249,571 | 26.45% | 268,822 | 28.49% | 4,323 | 0.46% | 1,379 | 0.15% | 70 | 0.01% | 943,721 | 100% |
| Gurdaspur District [lower-alpha 9] | 367,388 | 50.78% | 162,741 | 22.49% | 154,631 | 21.37% | 38,756 | 5.36% | 15 | 0% | 4 | 0% | 723,535 | 100% |
| Ludhiana District | 235,598 | 35.03% | 312,829 | 46.52% | 120,161 | 17.87% | 2,477 | 0.37% | 1,419 | 0.21% | 10 | 0% | 672,494 | 100% |
| Kapurthala State | 179,251 | 56.59% | 72,177 | 22.79% | 64,319 | 20.31% | 983 | 0.31% | 27 | 0.01% | 0 | 0% | 316,757 | 100% |
| Nabha State | 57,393 | 19.96% | 97,452 | 33.89% | 132,354 | 46.02% | 66 | 0.02% | 309 | 0.11% | 0 | 0% | 287,574 | 100% |
| Faridkot State | 49,912 | 30.37% | 92,880 | 56.51% | 20,855 | 12.69% | 167 | 0.1% | 550 | 0.33% | 0 | 0% | 164,364 | 100% |
| Malerkotla State | 31,417 | 37.82% | 28,982 | 34.89% | 21,252 | 25.58% | 135 | 0.16% | 1,286 | 1.55% | 0 | 0% | 83,072 | 100% |
| Total | 3,072,619 | 37.83% | 2,610,810 | 32.14% | 2,351,417 | 28.95% | 75,809 | 0.93% | 12,262 | 0.15% | 159 | 0.002% | 8,123,076 | 100% |
| Territory comprises the contemporary state of Punjab, India. | ||||||||||||||
1921 census
East Punjab region
Religions in East Punjab, India region (1921) [52] : 29 [lower-alpha 11]
Prior to partition, the eastern portion of Punjab that was ultimately awarded to India following the demarcation of the Radcliffe Line was made into a new province – East Punjab. The area includes the contemporary states of Punjab, Haryana, and Himachal Pradesh. Below is the religious demographics of this region broken down by district and princely state with an overall total as per the 1921 Indian census.
| District/ Princely State | Hinduism | Islam | Sikhism | Christianity | Jainism | Others [lower-alpha 8] | Total | |||||||
|---|---|---|---|---|---|---|---|---|---|---|---|---|---|---|
| Pop. | % | Pop. | % | Pop. | % | Pop. | % | Pop. | % | Pop. | % | Pop. | % | |
| Patiala State | 642,055 | 42.81% | 330,341 | 22.03% | 522,675 | 34.85% | 1,395 | 0.09% | 3,249 | 0.22% | 24 | 0% | 1,499,739 | 100% |
| Firozpur District | 306,350 | 27.89% | 482,540 | 43.94% | 302,761 | 27.57% | 5,365 | 0.49% | 1,211 | 0.11% | 21 | 0% | 1,098,248 | 100% |
| Amritsar District | 204,435 | 22% | 423,724 | 45.59% | 287,004 | 30.88% | 12,773 | 1.37% | 1,375 | 0.15% | 63 | 0.01% | 929,374 | 100% |
| Hoshiarpur District | 500,339 | 53.95% | 289,298 | 31.19% | 132,958 | 14.34% | 3,745 | 0.4% | 1,079 | 0.12% | 0 | 0% | 927,419 | 100% |
| Karnal District | 573,224 | 69.17% | 235,618 | 28.43% | 12,280 | 1.48% | 3,382 | 0.41% | 4,222 | 0.51% | 0 | 0% | 828,726 | 100% |
| Jalandhar District | 244,995 | 29.79% | 366,586 | 44.57% | 206,130 | 25.06% | 4,088 | 0.5% | 736 | 0.09% | 9 | 0% | 822,544 | 100% |
| Hisar District | 548,351 | 67.13% | 215,943 | 26.44% | 45,615 | 5.58% | 1,024 | 0.13% | 5,874 | 0.72% | 3 | 0% | 816,810 | 100% |
| Rohtak District | 629,592 | 81.52% | 125,035 | 16.19% | 602 | 0.08% | 10,033 | 1.3% | 7,010 | 0.91% | 0 | 0% | 772,272 | 100% |
| Kangra District | 722,277 | 94.28% | 38,263 | 4.99% | 2,083 | 0.27% | 363 | 0.05% | 56 | 0.01% | 3,023 | 0.39% | 766,065 | 100% |
| Gurgaon District | 460,134 | 67.47% | 216,860 | 31.8% | 924 | 0.14% | 1,316 | 0.19% | 2,762 | 0.4% | 7 | 0% | 682,003 | 100% |
| Ambala District | 370,125 | 54.31% | 205,750 | 30.19% | 97,614 | 14.32% | 5,679 | 0.83% | 2,272 | 0.33% | 37 | 0.01% | 681,477 | 100% |
| Gurdaspur District [lower-alpha 9] | 168,178 | 26.3% | 316,709 | 49.54% | 125,322 | 19.6% | 29,099 | 4.55% | 20 | 0% | 15 | 0% | 639,343 | 100% |
| Ludhiana District | 135,512 | 23.87% | 192,961 | 33.99% | 235,721 | 41.53% | 1,613 | 0.28% | 1,796 | 0.32% | 19 | 0% | 567,622 | 100% |
| Jind State | 234,721 | 76.16% | 43,251 | 14.03% | 28,026 | 9.09% | 637 | 0.21% | 1,548 | 0.5% | 0 | 0% | 308,183 | 100% |
| Simla Hill States | 292,768 | 95.45% | 9,551 | 3.11% | 2,040 | 0.67% | 164 | 0.05% | 142 | 0.05% | 2,053 | 0.67% | 306,718 | 100% |
| Kapurthala State | 58,412 | 20.55% | 160,457 | 56.44% | 64,074 | 22.54% | 1,100 | 0.39% | 228 | 0.08% | 4 | 0% | 284,275 | 100% |
| Nabha State | 133,870 | 50.84% | 50,756 | 19.27% | 78,389 | 29.77% | 41 | 0.02% | 278 | 0.11% | 0 | 0% | 263,334 | 100% |
| Mandi State | 181,358 | 98.01% | 3,462 | 1.87% | 142 | 0.08% | 10 | 0.01% | 0 | 0% | 76 | 0.04% | 185,048 | 100% |
| Faridkot State | 38,610 | 25.63% | 44,813 | 29.74% | 66,658 | 44.24% | 107 | 0.07% | 473 | 0.31% | 0 | 0% | 150,661 | 100% |
| Chamba State | 130,489 | 91.98% | 10,529 | 7.42% | 242 | 0.17% | 63 | 0.04% | 3 | 0% | 541 | 0.38% | 141,867 | 100% |
| Nahan State | 132,431 | 94.29% | 6,449 | 4.59% | 1,449 | 1.03% | 44 | 0.03% | 65 | 0.05% | 10 | 0.01% | 140,448 | 100% |
| Bilaspur State | 96,000 | 97.96% | 1,559 | 1.59% | 437 | 0.45% | 4 | 0% | 0 | 0% | 0 | 0% | 98,000 | 100% |
| Malerkotla State | 29,459 | 36.68% | 28,413 | 35.37% | 21,828 | 27.18% | 37 | 0.05% | 585 | 0.73% | 0 | 0% | 80,322 | 100% |
| Kalsia State | 28,769 | 50.15% | 20,394 | 35.55% | 8,014 | 13.97% | 4 | 0.01% | 190 | 0.33% | 0 | 0% | 57,371 | 100% |
| Suket State | 53,625 | 98.71% | 659 | 1.21% | 44 | 0.08% | 0 | 0% | 0 | 0% | 0 | 0% | 54,328 | 100% |
| Simla District | 33,228 | 73.31% | 6,953 | 15.34% | 1,173 | 2.59% | 3,823 | 8.43% | 90 | 0.2% | 60 | 0.13% | 45,327 | 100% |
| Dujana State | 20,135 | 77.94% | 5,698 | 22.06% | 0 | 0% | 0 | 0% | 0 | 0% | 0 | 0% | 25,833 | 100% |
| Loharu State | 17,978 | 87.18% | 2,625 | 12.73% | 0 | 0% | 0 | 0% | 18 | 0.09% | 0 | 0% | 20,621 | 100% |
| Pataudi State | 15,090 | 83.38% | 2,898 | 16.01% | 0 | 0% | 0 | 0% | 109 | 0.6% | 0 | 0% | 18,097 | 100% |
| Total | 7,002,510 | 53% | 3,838,095 | 29.05% | 2,244,205 | 16.99% | 85,909 | 0.65% | 35,391 | 0.27% | 5,965 | 0.05% | 13,212,075 | 100% |
| Territory comprises the contemporary subdivisions of Punjab, India, Chandigarh, Haryana, and Himachal Pradesh. | ||||||||||||||
Contemporary Punjab state
Religions in contemporary Punjab State, India region (1921) [52] : 29 [lower-alpha 3]
The religious demography according to the 1921 census for the region that comprises the contemporary state of Punjab, India is also shown below, broken down by district and princely state with an overall total.
| District/ Princely State | Islam | Hinduism | Sikhism | Christianity | Jainism | Others [lower-alpha 8] | Total | |||||||
|---|---|---|---|---|---|---|---|---|---|---|---|---|---|---|
| Pop. | % | Pop. | % | Pop. | % | Pop. | % | Pop. | % | Pop. | % | Pop. | % | |
| Patiala State | 330,341 | 22.03% | 642,055 | 42.81% | 522,675 | 34.85% | 1,395 | 0.09% | 3,249 | 0.22% | 24 | 0% | 1,499,739 | 100% |
| Firozpur District | 482,540 | 43.94% | 306,350 | 27.89% | 302,761 | 27.57% | 5,365 | 0.49% | 1,211 | 0.11% | 21 | 0% | 1,098,248 | 100% |
| Amritsar District | 423,724 | 45.59% | 204,435 | 22% | 287,004 | 30.88% | 12,773 | 1.37% | 1,375 | 0.15% | 63 | 0.01% | 929,374 | 100% |
| Hoshiarpur District | 289,298 | 31.19% | 500,339 | 53.95% | 132,958 | 14.34% | 3,745 | 0.4% | 1,079 | 0.12% | 0 | 0% | 927,419 | 100% |
| Jalandhar District | 366,586 | 44.57% | 244,995 | 29.79% | 206,130 | 25.06% | 4,088 | 0.5% | 736 | 0.09% | 9 | 0% | 822,544 | 100% |
| Gurdaspur District [lower-alpha 9] | 316,709 | 49.54% | 168,178 | 26.3% | 125,322 | 19.6% | 29,099 | 4.55% | 20 | 0% | 15 | 0% | 639,343 | 100% |
| Ludhiana District | 192,961 | 33.99% | 135,512 | 23.87% | 235,721 | 41.53% | 1,613 | 0.28% | 1,796 | 0.32% | 19 | 0% | 567,622 | 100% |
| Kapurthala State | 160,457 | 56.44% | 58,412 | 20.55% | 64,074 | 22.54% | 1,100 | 0.39% | 228 | 0.08% | 4 | 0% | 284,275 | 100% |
| Nabha State | 50,756 | 19.27% | 133,870 | 50.84% | 78,389 | 29.77% | 41 | 0.02% | 278 | 0.11% | 0 | 0% | 263,334 | 100% |
| Faridkot State | 44,813 | 29.74% | 38,610 | 25.63% | 66,658 | 44.24% | 107 | 0.07% | 473 | 0.31% | 0 | 0% | 150,661 | 100% |
| Malerkotla State | 28,413 | 35.37% | 29,459 | 36.68% | 21,828 | 27.18% | 37 | 0.05% | 585 | 0.73% | 0 | 0% | 80,322 | 100% |
| Total | 2,686,598 | 36.99% | 2,462,215 | 33.9% | 2,043,520 | 28.14% | 59,363 | 0.82% | 11,030 | 0.15% | 155 | 0.002% | 7,262,881 | 100% |
| Territory comprises the contemporary state of Punjab, India. | ||||||||||||||
1911 census
East Punjab region
Religions in East Punjab, India region (1911) [53] : 27 [54] : 27 [lower-alpha 12]
Prior to partition, the eastern portion of Punjab that was ultimately awarded to India following the demarcation of the Radcliffe Line was made into a new province – East Punjab. The area includes the contemporary states of Punjab, Haryana, and Himachal Pradesh. Below is the religious demographics of this region broken down by district and princely state with an overall total as per the 1911 Indian census.
| District/ Princely State | Hinduism | Islam | Sikhism | Christianity | Jainism | Others [lower-alpha 8] | Total | |||||||
|---|---|---|---|---|---|---|---|---|---|---|---|---|---|---|
| Pop. | % | Pop. | % | Pop. | % | Pop. | % | Pop. | % | Pop. | % | Pop. | % | |
| Patiala State | 563,940 | 40.06% | 307,384 | 21.84% | 532,292 | 37.81% | 739 | 0.05% | 3,282 | 0.23% | 22 | 0% | 1,407,659 | 100% |
| Firozpur District | 273,832 | 28.53% | 418,553 | 43.61% | 262,511 | 27.35% | 3,342 | 0.35% | 1,401 | 0.15% | 18 | 0% | 959,657 | 100% |
| Hoshiarpur District | 498,642 | 54.28% | 281,805 | 30.68% | 134,146 | 14.6% | 2,978 | 0.32% | 998 | 0.11% | 0 | 0% | 918,569 | 100% |
| Amritsar District | 211,708 | 24.04% | 408,882 | 46.43% | 253,941 | 28.83% | 4,763 | 0.54% | 1,386 | 0.16% | 48 | 0.01% | 880,728 | 100% |
| Hisar District | 541,720 | 67.3% | 218,600 | 27.16% | 38,508 | 4.78% | 273 | 0.03% | 5,767 | 0.72% | 21 | 0% | 804,889 | 100% |
| Jalandhar District | 265,378 | 33.09% | 357,051 | 44.52% | 176,227 | 21.98% | 2,404 | 0.3% | 842 | 0.1% | 18 | 0% | 801,920 | 100% |
| Karnal District | 556,203 | 69.54% | 224,920 | 28.12% | 13,531 | 1.69% | 920 | 0.12% | 4,213 | 0.53% | 0 | 0% | 799,787 | 100% |
| Kangra District | 725,156 | 94.13% | 38,859 | 5.04% | 1,910 | 0.25% | 386 | 0.05% | 81 | 0.01% | 3,994 | 0.52% | 770,386 | 100% |
| Rohtak District | 450,549 | 83.21% | 86,076 | 15.9% | 161 | 0.03% | 334 | 0.06% | 4,369 | 0.81% | 0 | 0% | 541,489 | 100% |
| Ambala District | 380,592 | 55.16% | 205,203 | 29.74% | 94,471 | 13.69% | 7,483 | 1.08% | 2,187 | 0.32% | 34 | 0% | 689,970 | 100% |
| Delhi District | 469,561 | 71.4% | 171,745 | 26.12% | 2,985 | 0.45% | 5,693 | 0.87% | 7,539 | 1.15% | 81 | 0.01% | 657,604 | 100% |
| Gurgaon District | 421,885 | 65.59% | 217,237 | 33.78% | 342 | 0.05% | 782 | 0.12% | 2,921 | 0.45% | 10 | 0% | 643,177 | 100% |
| Gurdaspur District [lower-alpha 9] | 190,965 | 30.49% | 304,860 | 48.67% | 110,525 | 17.65% | 19,879 | 3.17% | 73 | 0.01% | 22 | 0% | 626,324 | 100% |
| Ludhiana District | 131,370 | 25.4% | 176,043 | 34.04% | 207,042 | 40.03% | 888 | 0.17% | 1,849 | 0.36% | 0 | 0% | 517,192 | 100% |
| Simla Hill States | 386,953 | 95.7% | 11,374 | 2.81% | 2,911 | 0.72% | 224 | 0.06% | 172 | 0.04% | 2,709 | 0.67% | 404,343 | 100% |
| Jind State | 210,222 | 77.36% | 37,520 | 13.81% | 22,566 | 8.3% | 187 | 0.07% | 1,233 | 0.45% | 0 | 0% | 271,728 | 100% |
| Kapurthala State | 61,426 | 22.91% | 152,117 | 56.73% | 54,275 | 20.24% | 107 | 0.04% | 205 | 0.08% | 3 | 0% | 268,133 | 100% |
| Nabha State | 126,414 | 50.79% | 46,032 | 18.5% | 76,198 | 30.62% | 5 | 0% | 238 | 0.1% | 0 | 0% | 248,887 | 100% |
| Mandi State | 178,115 | 98.35% | 2,799 | 1.55% | 26 | 0.01% | 4 | 0% | 2 | 0% | 164 | 0.09% | 181,110 | 100% |
| Nahan State | 130,276 | 94.05% | 6,016 | 4.34% | 2,142 | 1.55% | 37 | 0.03% | 49 | 0.04% | 0 | 0% | 138,520 | 100% |
| Chamba State | 126,269 | 92.93% | 8,750 | 6.44% | 141 | 0.1% | 81 | 0.06% | 5 | 0% | 627 | 0.46% | 135,873 | 100% |
| Faridkot State | 37,377 | 28.69% | 37,105 | 28.48% | 55,397 | 42.52% | 6 | 0% | 409 | 0.31% | 0 | 0% | 130,294 | 100% |
| Malerkotla State | 22,902 | 32.19% | 25,942 | 36.46% | 21,018 | 29.54% | 14 | 0.02% | 1,268 | 1.78% | 0 | 0% | 71,144 | 100% |
| Kalsia State | 30,640 | 54.8% | 18,820 | 33.66% | 6,258 | 11.19% | 31 | 0.06% | 160 | 0.29% | 0 | 0% | 55,909 | 100% |
| Suket State | 54,268 | 98.8% | 587 | 1.07% | 71 | 0.13% | 2 | 0% | 0 | 0% | 0 | 0% | 54,928 | 100% |
| Simla District | 29,047 | 73.87% | 5,820 | 14.8% | 693 | 1.76% | 3,666 | 9.32% | 49 | 0.12% | 45 | 0.11% | 39,320 | 100% |
| Dujana State | 20,161 | 79.11% | 5,324 | 20.89% | 0 | 0% | 0 | 0% | 0 | 0% | 0 | 0% | 25,485 | 100% |
| Pataudi State | 16,114 | 82.45% | 3,338 | 17.08% | 0 | 0% | 9 | 0.05% | 82 | 0.42% | 0 | 0% | 19,543 | 100% |
| Loharu State | 16,178 | 86.99% | 2,401 | 12.91% | 0 | 0% | 0 | 0% | 18 | 0.1% | 0 | 0% | 18,597 | 100% |
| Total | 7,127,863 | 54.48% | 3,781,163 | 28.9% | 2,070,288 | 15.82% | 55,237 | 0.42% | 40,798 | 0.31% | 7,816 | 0.06% | 13,083,165 | 100% |
| Territory comprises the contemporary subdivisions of Punjab, India, Chandigarh, Haryana, and Himachal Pradesh. | ||||||||||||||
Contemporary Punjab state
Religions in contemporary Punjab State, India region (1911) [53] : 27 [54] : 27 [lower-alpha 2]
The religious demography according to the 1911 census for the region that comprises the contemporary state of Punjab, India is also shown below, broken down by district and princely state with an overall total.
| District/ Princely State | Islam | Hinduism | Sikhism | Christianity | Jainism | Others [lower-alpha 8] | Total | |||||||
|---|---|---|---|---|---|---|---|---|---|---|---|---|---|---|
| Pop. | % | Pop. | % | Pop. | % | Pop. | % | Pop. | % | Pop. | % | Pop. | % | |
| Patiala State | 307,384 | 21.84% | 563,940 | 40.06% | 532,292 | 37.81% | 739 | 0.05% | 3,282 | 0.23% | 22 | 0% | 1,407,659 | 100% |
| Firozpur District | 418,553 | 43.61% | 273,832 | 28.53% | 262,511 | 27.35% | 3,342 | 0.35% | 1,401 | 0.15% | 18 | 0% | 959,657 | 100% |
| Hoshiarpur District | 281,805 | 30.68% | 498,642 | 54.28% | 134,146 | 14.6% | 2,978 | 0.32% | 998 | 0.11% | 0 | 0% | 918,569 | 100% |
| Amritsar District | 408,882 | 46.43% | 211,708 | 24.04% | 253,941 | 28.83% | 4,763 | 0.54% | 1,386 | 0.16% | 48 | 0.01% | 880,728 | 100% |
| Jalandhar District | 357,051 | 44.52% | 265,378 | 33.09% | 176,227 | 21.98% | 2,404 | 0.3% | 842 | 0.1% | 18 | 0% | 801,920 | 100% |
| Gurdaspur District [lower-alpha 9] | 304,860 | 48.67% | 190,965 | 30.49% | 110,525 | 17.65% | 19,879 | 3.17% | 73 | 0.01% | 22 | 0% | 626,324 | 100% |
| Ludhiana District | 176,043 | 34.04% | 131,370 | 25.4% | 207,042 | 40.03% | 888 | 0.17% | 1,849 | 0.36% | 0 | 0% | 517,192 | 100% |
| Kapurthala State | 152,117 | 56.73% | 61,426 | 22.91% | 54,275 | 20.24% | 107 | 0.04% | 205 | 0.08% | 3 | 0% | 268,133 | 100% |
| Nabha State | 46,032 | 18.5% | 126,414 | 50.79% | 76,198 | 30.62% | 5 | 0% | 238 | 0.1% | 0 | 0% | 248,887 | 100% |
| Faridkot State | 37,105 | 28.48% | 37,377 | 28.69% | 55,397 | 42.52% | 6 | 0% | 409 | 0.31% | 0 | 0% | 130,294 | 100% |
| Malerkotla State | 25,942 | 36.46% | 22,902 | 32.19% | 21,018 | 29.54% | 14 | 0.02% | 1,268 | 1.78% | 0 | 0% | 71,144 | 100% |
| Total | 2,515,774 | 36.83% | 2,383,954 | 34.9% | 1,883,572 | 27.58% | 35,125 | 0.51% | 11,951 | 0.17% | 131 | 0.002% | 6,830,507 | 100% |
| Territory comprises the contemporary state of Punjab, India. | ||||||||||||||
1901 census
East Punjab region
Religions in East Punjab, India region (1901) [55] : 34 [56] : 62 [lower-alpha 13]
Prior to partition, the eastern portion of Punjab that was ultimately awarded to India following the demarcation of the Radcliffe Line was made into a new province – East Punjab. The area includes the contemporary states of Punjab, Haryana, and Himachal Pradesh. Below is the religious demographics of this region broken down by district and princely state with an overall total as per the 1901 Indian census.
| District/ Princely State | Hinduism | Islam | Sikhism | Jainism | Christianity | Others [lower-alpha 8] | Total | |||||||
|---|---|---|---|---|---|---|---|---|---|---|---|---|---|---|
| Pop. | % | Pop. | % | Pop. | % | Pop. | % | Pop. | % | Pop. | % | Pop. | % | |
| Patiala State | 880,490 | 55.14% | 357,334 | 22.38% | 355,649 | 22.27% | 2,877 | 0.18% | 316 | 0.02% | 26 | 0% | 1,596,692 | 100% |
| Amritsar District | 280,985 | 27.44% | 474,976 | 46.39% | 264,329 | 25.82% | 1,439 | 0.14% | 2,078 | 0.2% | 21 | 0% | 1,023,828 | 100% |
| Hoshiarpur District | 603,710 | 60.99% | 312,958 | 31.62% | 71,126 | 7.19% | 1,173 | 0.12% | 813 | 0.08% | 2 | 0% | 989,782 | 100% |
| Firozpur District | 279,099 | 29.13% | 447,615 | 46.72% | 228,355 | 23.83% | 1,090 | 0.11% | 1,908 | 0.2% | 5 | 0% | 958,072 | 100% |
| Jalandhar District | 368,051 | 40.11% | 421,011 | 45.88% | 125,817 | 13.71% | 969 | 0.11% | 1,713 | 0.19% | 26 | 0% | 917,587 | 100% |
| Karnal District | 623,597 | 70.6% | 241,412 | 27.33% | 12,294 | 1.39% | 4,739 | 0.54% | 1,179 | 0.13% | 4 | 0% | 883,225 | 100% |
| Ambala District | 510,105 | 62.52% | 240,710 | 29.5% | 58,073 | 7.12% | 2,614 | 0.32% | 4,362 | 0.53% | 16 | 0% | 815,880 | 100% |
| Hisar District | 544,799 | 69.69% | 202,009 | 25.84% | 28,642 | 3.66% | 6,003 | 0.77% | 253 | 0.03% | 11 | 0% | 781,717 | 100% |
| Kangra District | 722,554 | 94.07% | 39,672 | 5.16% | 1,220 | 0.16% | 113 | 0.01% | 385 | 0.05% | 4,180 | 0.54% | 768,124 | 100% |
| Gurgaon District | 499,373 | 66.92% | 242,548 | 32.5% | 99 | 0.01% | 3,909 | 0.52% | 278 | 0.04% | 1 | 0% | 746,208 | 100% |
| Gurdaspur District [lower-alpha 9] | 268,817 | 38.08% | 348,182 | 49.33% | 85,199 | 12.07% | 72 | 0.01% | 3,571 | 0.51% | 28 | 0% | 705,869 | 100% |
| Delhi District | 510,532 | 74.09% | 167,290 | 24.28% | 294 | 0.04% | 7,726 | 1.12% | 3,158 | 0.46% | 39 | 0.01% | 689,039 | 100% |
| Ludhiana District | 269,076 | 39.98% | 235,937 | 35.05% | 164,919 | 24.5% | 2,217 | 0.33% | 947 | 0.14% | 1 | 0% | 673,097 | 100% |
| Rohtak District | 533,723 | 84.63% | 91,687 | 14.54% | 94 | 0.01% | 5,087 | 0.81% | 80 | 0.01% | 1 | 0% | 630,672 | 100% |
| Simla Hill States | 373,886 | 96.03% | 11,535 | 2.96% | 1,318 | 0.34% | 274 | 0.07% | 113 | 0.03% | 2,223 | 0.57% | 389,349 | 100% |
| Kapurthala State | 93,652 | 29.79% | 178,326 | 56.73% | 42,101 | 13.39% | 226 | 0.07% | 39 | 0.01% | 7 | 0% | 314,351 | 100% |
| Nabha State | 160,553 | 53.89% | 58,550 | 19.65% | 78,361 | 26.3% | 476 | 0.16% | 7 | 0% | 2 | 0% | 297,949 | 100% |
| Jind State | 211,963 | 75.16% | 38,717 | 13.73% | 29,975 | 10.63% | 1,258 | 0.45% | 80 | 0.03% | 10 | 0% | 282,003 | 100% |
| Mandi State | 170,304 | 97.85% | 3,187 | 1.83% | 41 | 0.02% | 0 | 0% | 3 | 0% | 510 | 0.29% | 174,045 | 100% |
| Nahan State | 128,478 | 94.69% | 6,414 | 4.73% | 688 | 0.51% | 61 | 0.04% | 46 | 0.03% | 0 | 0% | 135,687 | 100% |
| Chamba State | 119,327 | 93.35% | 8,332 | 6.52% | 80 | 0.06% | 3 | 0% | 70 | 0.05% | 22 | 0.02% | 127,834 | 100% |
| Faridkot State | 35,778 | 28.64% | 35,996 | 28.82% | 52,721 | 42.21% | 406 | 0.33% | 11 | 0.01% | 0 | 0% | 124,912 | 100% |
| Malerkotla State | 38,409 | 49.56% | 27,229 | 35.13% | 10,495 | 13.54% | 1,361 | 1.76% | 12 | 0.02% | 0 | 0% | 77,506 | 100% |
| Kalsia State | 38,626 | 57.5% | 21,921 | 32.63% | 6,453 | 9.61% | 181 | 0.27% | 0 | 0% | 0 | 0% | 67,181 | 100% |
| Suket State | 54,005 | 98.77% | 665 | 1.22% | 6 | 0.01% | 0 | 0% | 0 | 0% | 0 | 0% | 54,676 | 100% |
| Simla District | 30,299 | 75.09% | 6,675 | 16.54% | 544 | 1.35% | 32 | 0.08% | 2,798 | 6.93% | 3 | 0.01% | 40,351 | 100% |
| Dujana State | 18,380 | 76.03% | 5,790 | 23.95% | 4 | 0.02% | 0 | 0% | 0 | 0% | 0 | 0% | 24,174 | 100% |
| Pataudi State | 18,281 | 83.35% | 3,549 | 16.18% | 0 | 0% | 103 | 0.47% | 0 | 0% | 0 | 0% | 21,933 | 100% |
| Loharu State | 13,254 | 87.03% | 1,963 | 12.89% | 0 | 0% | 12 | 0.08% | 0 | 0% | 0 | 0% | 15,229 | 100% |
| Total | 8,400,106 | 58.63% | 4,232,190 | 29.54% | 1,618,897 | 11.3% | 44,421 | 0.31% | 24,220 | 0.17% | 7,138 | 0.05% | 14,326,972 | 100% |
| Territory comprises the contemporary subdivisions of Punjab, India, Chandigarh, Haryana, and Himachal Pradesh. | ||||||||||||||
Contemporary Punjab state
Religions in contemporary Punjab State, India region (1901) [55] : 34 [56] : 62 [lower-alpha 1]
The religious demography according to the 1901 census for the region that comprises the contemporary state of Punjab, India is also shown below, broken down by district and princely state with an overall total.
| District/ Princely State | Islam | Hinduism | Sikhism | Jainism | Christianity | Others [lower-alpha 8] | Total | |||||||
|---|---|---|---|---|---|---|---|---|---|---|---|---|---|---|
| Pop. | % | Pop. | % | Pop. | % | Pop. | % | Pop. | % | Pop. | % | Pop. | % | |
| Patiala State | 880,490 | 55.14% | 357,334 | 22.38% | 355,649 | 22.27% | 2,877 | 0.18% | 316 | 0.02% | 26 | 0% | 1,596,692 | 100% |
| Amritsar District | 280,985 | 27.44% | 474,976 | 46.39% | 264,329 | 25.82% | 1,439 | 0.14% | 2,078 | 0.2% | 21 | 0% | 1,023,828 | 100% |
| Hoshiarpur District | 603,710 | 60.99% | 312,958 | 31.62% | 71,126 | 7.19% | 1,173 | 0.12% | 813 | 0.08% | 2 | 0% | 989,782 | 100% |
| Firozpur District | 279,099 | 29.13% | 447,615 | 46.72% | 228,355 | 23.83% | 1,090 | 0.11% | 1,908 | 0.2% | 5 | 0% | 958,072 | 100% |
| Jalandhar District | 368,051 | 40.11% | 421,011 | 45.88% | 125,817 | 13.71% | 969 | 0.11% | 1,713 | 0.19% | 26 | 0% | 917,587 | 100% |
| Gurdaspur District [lower-alpha 9] | 268,817 | 38.08% | 348,182 | 49.33% | 85,199 | 12.07% | 72 | 0.01% | 3,571 | 0.51% | 28 | 0% | 705,869 | 100% |
| Ludhiana District | 269,076 | 39.98% | 235,937 | 35.05% | 164,919 | 24.5% | 2,217 | 0.33% | 947 | 0.14% | 1 | 0% | 673,097 | 100% |
| Kapurthala State | 93,652 | 29.79% | 178,326 | 56.73% | 42,101 | 13.39% | 226 | 0.07% | 39 | 0.01% | 7 | 0% | 314,351 | 100% |
| Nabha State | 160,553 | 53.89% | 58,550 | 19.65% | 78,361 | 26.3% | 476 | 0.16% | 7 | 0% | 2 | 0% | 297,949 | 100% |
| Faridkot State | 35,778 | 28.64% | 35,996 | 28.82% | 52,721 | 42.21% | 406 | 0.33% | 11 | 0.01% | 0 | 0% | 124,912 | 100% |
| Malerkotla State | 38,409 | 49.56% | 27,229 | 35.13% | 10,495 | 13.54% | 1,361 | 1.76% | 12 | 0.02% | 0 | 0% | 77,506 | 100% |
| Total | 3,278,620 | 42.69% | 2,898,114 | 37.74% | 1,479,072 | 19.26% | 12,306 | 0.16% | 11,415 | 0.15% | 118 | 0.002% | 7,679,645 | 100% |
| Territory comprises the contemporary state of Punjab, India. | ||||||||||||||