Constituencies
Conservative Labour Independent
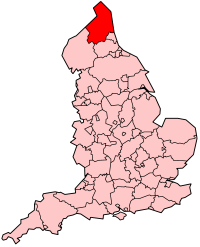
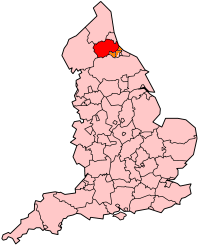
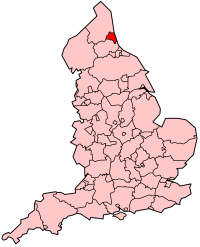
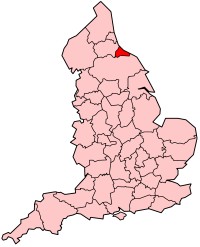
The region [1] of North East England is divided into 29 parliamentary constituencies which is made up of 19 borough constituencies and 10 county constituencies. Since the 2019 general election, [2] 17 are represented by Labour MPs and 11 by Conservative MPs. One is an independent.
Conservative Labour Independent
See 2023 Periodic Review of Westminster constituencies for further details.
Following the abandonment of the Sixth Periodic Review (the 2018 review), the Boundary Commission for England formally launched the 2023 Review on 5 January 2021. The Commission calculated that the number of seats to be allocated to the North East region will decrease by two, from 29 to 27. [5] Initial proposals were published on 8 June 2021 and, following two periods of public consultation, revised proposals were published on 8 November 2022. The final proposals were published on 28 June 2023.
Under the revised proposals, the following constituencies for the region would come into effect at the 2024 general election: [6]
| Constituency | Electorate | Ceremonial county | Local authority |
|---|---|---|---|
| Bishop Auckland CC | 70,879 | Durham | County Durham |
| Blaydon and Consett CC | 70,163 | Durham / Tyne and Wear | County Durham / Gateshead |
| Blyth and Ashington CC | 75,452 | Northumberland | Northumberland |
| City of Durham CC | 72,878 | Durham | County Durham |
| Cramlington and Killingworth CC | 73,295 | Northumberland / Tyne and Wear | Newcastle upon Tyne / North Tyneside / Northumberland |
| Darlington CC | 70,446 | Durham | Darlington |
| Easington CC | 70,043 | Durham | County Durham |
| Gateshead Central and Whickham BC | 70,994 | Tyne and Wear | Gateshead |
| Hartlepool CC | 71,228 | Durham | Hartlepool |
| Hexham CC | 72,738 | Northumberland / Tyne and Wear | Newcastle upon Tyne / Northumberland |
| Houghton and Sunderland South BC | 76,883 | Tyne and Wear | Sunderland |
| Jarrow and Gateshead East BC | 71,106 | Tyne and Wear | Gateshead / South Tyneside |
| Middlesbrough and Thornaby East BC | 71,742 | North Yorkshire | Middlesbrough / Stockton-on-Tees |
| Middlesbrough South and East Cleveland CC | 69,967 | North Yorkshire | Middlesbrough / Redcar and Cleveland |
| Newcastle upon Tyne Central and West BC | 76,460 | Tyne and Wear | Newcastle upon Tyne |
| Newcastle upon Tyne East and Wallsend BC | 76,875 | Tyne and Wear | Newcastle upon Tyne / North Tyneside |
| Newcastle upon Tyne North BC | 76,503 | Tyne and Wear | Newcastle upon Tyne / North Tyneside |
| Newton Aycliffe and Spennymoor CC | 71,299 | Durham | County Durham |
| North Durham CC | 73,079 | Durham | County Durham |
| North Northumberland CC | 72,541 | Northumberland | Northumberland |
| Redcar BC | 71,331 | North Yorkshire | Redcar and Cleveland |
| South Shields BC | 69,725 | Tyne and Wear | South Tyneside |
| Stockton North CC | 69,779 | Durham | Stockton-on-Tees |
| Stockton West CC | 70.108 | Durham / North Yorkshire | Darlington / Stockton-on-Tees |
| Sunderland Central BC | 72,688 | Tyne and Wear | Sunderland |
| Tynemouth BC | 73,022 | Tyne and Wear | North Tyneside |
| Washington and Gateshead South BC | 71,775 | Tyne and Wear | Gateshead / Sunderland |
Primary data source: House of Commons research briefing - General election results from 1918 to 2019 [7]
The number of votes cast for each political party who fielded candidates in constituencies comprising the North East region in the 2019 general election were as follows:
| Party | Votes | % | Change from 2017 | Seats | Change from 2017 |
|---|---|---|---|---|---|
| Labour | 532,122 | 42.6% | 19 | ||
| Conservative | 478,208 | 38.3% | 10 | ||
| Brexit | 98,958 | 7.9% | new | 0 | 0 |
| Liberal Democrats | 85,243 | 6.8% | 0 | 0 | |
| Greens | 29,732 | 2.4% | 0 | 0 | |
| Others | 23,872 | 2.0% | 0 | 0 | |
| Total | 1,248,135 | 100.0 | 29 |

Key:
CON - Conservative Party, including National Liberal Party up to 1966
LAB - Labour Party
LIB - Liberal Party up to 1979; SDP-Liberal Alliance 1983 & 1987; Liberal Democrats from 1992
UKIP/Br - UK Independence Party 2010 to 2017 (included in Other up to 2005 and in 2019); Brexit Party in 2019
Green - Green Party of England and Wales (included in Other up to 2005)

Key:
CON - Conservative Party, including National Liberal Party up to 1966
LAB - Labour Party
LIB - Liberal Party up to 1979; SDP-Liberal Alliance 1983 & 1987; Liberal Democrats from 1992
OTH - 1974 (Feb) - Independent Labour (Eddie Milne)
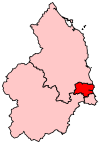
The ceremonial county of Shropshire, England, is divided into 5 parliamentary constituencies – 1 borough constituency and 4 county constituencies. As with all constituencies for the House of Commons in the modern age, each constituency elects one Member of Parliament by the first-past-the-post system.
The region of South West England has, since the 2010 general election, 55 parliamentary constituencies which is made up of 15 borough constituencies and 40 county constituencies. At that election the Conservative Party held the largest number of constituencies, with 36. The Liberal Democrats had 15 and Labour had 4. At the 2015 general election the Liberal Democrats lost all of their seats, while the Conservatives gained one seat from Labour, leaving the Conservatives with 51 and Labour with 4. In the 2017 general election, the Conservatives remained, by far, the largest party with 47 seats, though losing three to Labour, who won 7, and one to the Liberal Democrats, who won 1. In the 2019 general election, the Conservatives increased their number of seats to 48 by regaining Stroud from Labour, who held their other six seats, while the Liberal Democrats retained their sole seat in Bath.
The region of East Midlands is divided into 46 parliamentary constituencies which is made up of 12 borough constituencies and 34 county constituencies. Since the 2019 United Kingdom general election, 35 are represented by Conservative MPs, 8 by Labour MPs, 2 by independent MPs, and 1 by a Reform UK MP.
The region of Yorkshire and the Humber is divided into 54 parliamentary constituencies which is made up of 25 borough constituencies and 29 county constituencies. Since the general election of December 2019, 24 are represented by Conservative MPs and 30 by Labour MPs.
The region of the East of England is divided into 58 parliamentary constituencies which is made up of 16 borough constituencies and 42 county constituencies. Since the general election of December 2019, 49 are represented by Conservative MPs, seven by Labour MPs, one by a Liberal Democrat MP, and one by an independent MP.
The region of West Midlands is divided into 59 parliamentary constituencies which is made up of 35 borough constituencies and 24 county constituencies. Since the general election of December 2019, 42 are represented by Conservative MPs, 16 by Labour MPs, and 1 by a Liberal Democrat MP.
The region of North West England is divided into 75 parliamentary constituencies, of which 39 are borough constituencies and 36 are county constituencies. Since the general election of December 2019, 30 are represented by Conservative MPs, 41 by Labour MPs, 1 by a Liberal Democrat MP, 1 by the Speaker, and 1 by a Workers MP.
The region of South East England is divided into 84 parliamentary constituencies, which are made up of 23 borough constituencies and 61 county constituencies. Since the general election of December 2019, 72 are represented by Conservative MPs, 9 by Labour MPs, 2 by Liberal Democrat MPs, and 1 by a Green MP.