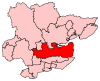
Constituencies
† Conservative ‡ Labour ¤ Liberal Democrat # Independent
The region [1] of the East of England is divided into 58 parliamentary constituencies which is made up of 16 borough constituencies and 42 county constituencies. Since the general election of December 2019, [2] 49 are represented by Conservative MPs, seven by Labour MPs, one by a Liberal Democrat MP, and one by an independent MP.
† Conservative ‡ Labour ¤ Liberal Democrat # Independent
See 2023 Periodic Review of Westminster constituencies for further details.
Following the abandonment of the Sixth Periodic Review (the 2018 review), the Boundary Commission for England formally launched the 2023 Review on 5 January 2021. The Commission calculated that the number of seats to be allocated to the Eastern region will increase by 3, from 58 to 61. [7] Initial proposals were published on 8 June 2021 and, following two periods of public consultation, revised proposals were published on 8 November 2022. The final proposals were published on 28 June 2023.
Under the final proposals, the following constituencies for the region will come into effect at the next general election: [8]
| Constituency | Electorate | Ceremonial county | Local authority |
|---|---|---|---|
| Basildon and Billericay BC | 76,993 | Essex | Basildon |
| Bedford BC | 70,068 | Bedfordshire | Bedford |
| Braintree CC | 75,662 | Essex | Braintree / Uttlesford |
| Brentwood and Ongar CC | 74,937 | Essex | Brentwood / Epping Forest |
| Broadland and Fakenham CC | 72,907 | Norfolk | Breckland / Broadland |
| Broxbourne BC | 75,454 | Hertfordshire | Broxbourne / East Hertfordshire |
| Bury St Edmunds and Stowmarket CC | 75,655 | Suffolk | Mid Suffolk / West Suffolk |
| Cambridge BC | 72,560 | Cambridgeshire | Cambridge |
| Castle Point BC | 70,923 | Essex | Castle Point / Basildon |
| Central Suffolk and North Ipswich CC | 71,020 | Suffolk | East Suffolk / Ipswich / Mid Suffolk |
| Chelmsford BC | 76,454 | Essex | Chelmsford |
| Clacton CC | 75,959 | Essex | Tendring |
| Colchester BC | 76,843 | Essex | Colchester |
| Dunstable and Leighton Buzzard CC | 74,069 | Bedfordshire | Central Bedfordshire |
| Ely and East Cambridgeshire CC | 76,279 | Cambridgeshire | East Cambridgeshire / South Cambridgeshire |
| Epping Forest CC | 74,553 | Essex | Epping Forest |
| Great Yarmouth CC | 70,077 | Norfolk | Great Yarmouth |
| Harlow CC | 73,479 | Essex | Epping Forest / Harlow / Uttlesford |
| Harpenden and Berkhamsted CC | 71,635 | Hertfordshire | Dacorum / St Albans |
| Harwich and North Essex CC | 74,838 | Essex | Colchester / Tendring |
| Hemel Hempstead CC | 70,496 | Hertfordshire | Dacorum |
| Hertford and Stortford CC | 75,396 | Hertfordshire | East Hertfordshire |
| Hertsmere CC | 73,256 | Hertfordshire | Hertsmere / Welwyn Hatfield |
| Hitchin CC | 72,112 | Bedfordshire / Hertfordshire | Central Bedfordshire / North Hertfordshire |
| Huntingdon CC | 75,590 | Cambridgeshire | Huntingdonshire |
| Ipswich BC | 75,117 | Suffolk | Ipswich |
| Lowestoft CC | 73,967 | Suffolk | East Suffolk |
| Luton North BC | 73,266 | Bedfordshire | Luton |
| Luton South and South Bedfordshire CC | 70,197 | Bedfordshire | Central Bedfordshire / Luton |
| Maldon CC | 76,794 | Essex | Chelmsford / Maldon |
| Mid Bedfordshire CC | 71,748 | Bedfordshire | Bedford / Central Bedfordshire |
| Mid Norfolk CC | 71,060 | Norfolk | Breckland / South Norfolk |
| North Bedfordshire CC | 76,319 | Bedfordshire | Bedford / Central Bedfordshire |
| North East Cambridgeshire CC | 70,806 | Cambridgeshire | Fenland |
| North East Hertfordshire CC | 76,849 | Hertfordshire | East Hertfordshire / North Hertfordshire |
| North Norfolk CC | 70,719 | Norfolk | North Norfolk |
| North West Cambridgeshire CC | 73,556 | Cambridgeshire | Huntingdonshire / Peterborough |
| North West Essex CC | 76,280 | Essex | Chelmsford / Uttlesford |
| North West Norfolk CC | 75,200 | Norfolk | Kings Lynn and West Norfolk |
| Norwich North BC | 71,441 | Norfolk | Broadland / Norwich |
| Norwich South BC | 73,201 | Norfolk | Norwich / South Norfolk |
| Peterborough CC | 72,273 | Cambridgeshire | Peterborough |
| Rayleigh and Wickford CC | 76,422 | Essex | Basildon / Rochford |
| South Basildon and East Thurrock CC | 73,322 | Essex | Basildon / Thurrock |
| South Cambridgeshire CC | 75,484 | Cambridgeshire | Cambridge / South Cambridgeshire |
| South Norfolk CC | 69,837 | Norfolk | South Norfolk |
| South Suffolk CC | 71,070 | Suffolk | Babergh |
| South West Hertfordshire CC | 71,552 | Hertfordshire | Dacorum / Three Rivers |
| South West Norfolk CC | 72,496 | Norfolk | Breckland / Kings Lynn and West Norfolk |
| Southend East and Rochford CC | 70,094 | Essex | Rochford / Southend-on-Sea |
| Southend West and Leigh BC | 76,824 | Essex | Southend-on-Sea |
| St Albans CC | 70,881 | Hertfordshire | St Albans |
| St Neots and Mid Cambridgeshire CC | 74,699 | Cambridgeshire | Huntingdonshire / South Cambridgeshire |
| Stevenage CC | 70,370 | Hertfordshire | East Hertfordshire / North Hertfordshire / Stevenage |
| Suffolk Coastal CC | 72,683 | Suffolk | East Suffolk |
| Thurrock BC | 73,347 | Essex | Thurrock |
| Watford BC | 70,576 | Hertfordshire | Hertsmere / Watford |
| Waveney Valley CC | 70,540 | Norfolk / Suffolk | East Suffolk / Mid Suffolk / South Norfolk |
| Welwyn Hatfield CC | 74,535 | Hertfordshire | Welwyn Hatfield |
| West Suffolk CC | 76,243 | Suffolk | West Suffolk |
| Witham CC | 75,064 | Essex | Braintree / Colchester / Maldon |
Primary data source: House of Commons research briefing - General election results from 1918 to 2019 [9]
The number of votes cast for each political party who fielded candidates in constituencies comprising the East of England region in the 2019 general election were as follows:
| Party | Votes | % | Change from 2017 | Seats | Change from 2017 |
|---|---|---|---|---|---|
| Conservative | 1,754,091 | 57.2% | 52 | ||
| Labour | 749,906 | 24.4% | 5 | ||
| Liberal Democrats | 410,849 | 13.4% | 1 | 0 | |
| Greens | 90,957 | 3.0% | 0 | 0 | |
| Brexit | 11,707 | 0.4% | new | 0 | 0 |
| Others | 50,751 | 1.6% | 0 | 0 | |
| Total | 3,068,261 | 100.0 | 58 |

Key:
CON - Conservative Party, including National Liberal Party up to 1966
LAB - Labour Party
LIB - Liberal Party up to 1979; SDP-Liberal Alliance 1983 & 1987; Liberal Democrats from 1992
UKIP/Br - UK Independence Party 2010 to 2017 (included in Other up to 2005 and in 2019); Brexit Party in 2019
Green - Green Party of England and Wales (included in Other up to 2005)

Key: CON - Conservative Party, including National Liberal Party up to 1966
LAB - Labour Party
LIB - Liberal Party up to 1979; SDP-Liberal Alliance 1983 & 1987; Liberal Democrats from 1992
OTH - 1945 - Common Wealth Party (unopposed by Labour); 2015 - UK Independence Party
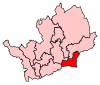
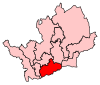
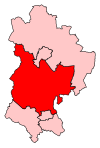
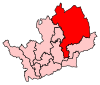
The ceremonial county of Shropshire, England, is divided into 5 parliamentary constituencies – 1 borough constituency and 4 county constituencies. As with all constituencies for the House of Commons in the modern age, each constituency elects one Member of Parliament by the first-past-the-post system.
The region of South West England has, since the 2010 general election, 55 parliamentary constituencies which is made up of 15 borough constituencies and 40 county constituencies. At that election the Conservative Party held the largest number of constituencies, with 36. The Liberal Democrats had 15 and Labour had 4. At the 2015 general election the Liberal Democrats lost all of their seats, while the Conservatives gained one seat from Labour, leaving the Conservatives with 51 and Labour with 4. In the 2017 general election, the Conservatives remained, by far, the largest party with 47 seats, though losing three to Labour, who won 7, and one to the Liberal Democrats, who won 1. In the 2019 general election, the Conservatives increased their number of seats to 48 by regaining Stroud from Labour, who held their other six seats, while the Liberal Democrats retained their sole seat in Bath.
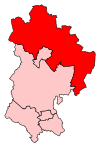
The region of North East England is divided into 29 parliamentary constituencies which is made up of 19 borough constituencies and 10 county constituencies. Since the 2019 general election, 17 are represented by Labour MPs and 11 by Conservative MPs. One is an independent.
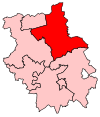
The region of East Midlands is divided into 46 parliamentary constituencies which is made up of 12 borough constituencies and 34 county constituencies. Since the 2019 United Kingdom general election, 35 are represented by Conservative MPs, 8 by Labour MPs, 2 by independent MPs, and 1 by a Reform UK MP.
The region of Yorkshire and the Humber is divided into 54 parliamentary constituencies which is made up of 25 borough constituencies and 29 county constituencies. Since the general election of December 2019, 24 are represented by Conservative MPs and 30 by Labour MPs.
The region of West Midlands is divided into 59 parliamentary constituencies which is made up of 35 borough constituencies and 24 county constituencies. Since the general election of December 2019, 42 are represented by Conservative MPs, 16 by Labour MPs, and 1 by a Liberal Democrat MP.
The region of North West England is divided into 75 parliamentary constituencies, of which 39 are borough constituencies and 36 are county constituencies. Since the general election of December 2019, 30 are represented by Conservative MPs, 41 by Labour MPs, 1 by a Liberal Democrat MP, 1 by the Speaker, and 1 by a Workers MP.
The region of South East England is divided into 84 parliamentary constituencies, which are made up of 23 borough constituencies and 61 county constituencies. Since the general election of December 2019, 73 are represented by Conservative MPs, 8 by Labour MPs, 2 by Liberal Democrat MPs, and 1 by a Green MP.
The turnout for the Southend West by election was 24.03 per cent of an electorate of 66,354