Parliamentary constituencies in North West England

Last updated

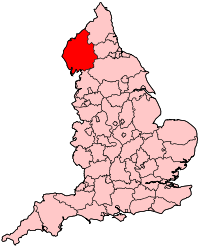
The region [1] of North West England is divided into 75 parliamentary constituencies, of which 39 are borough constituencies and 36 are county constituencies. Since the general election of December 2019, [2] 31 are represented by Conservative MPs, 41 by Labour MPs, 1 by a Liberal Democrat MP, 1 by the Speaker, and 1 by a Workers MP.

Contents

Constituencies

   † Conservative    ‡ Labour    ¤ Liberal Democrat   Speaker   Independent    Workers

Constituency [nb 1] Electorate [3] Majority [4] [nb 2] Member of Parliament [4] Nearest opposition [4] CountyCounty locationConstituency map
Altrincham and Sale West BC 73,1076,139  Sir Graham Brady  Andrew Western Greater Manchester EnglandGreaterManchester.svg
AltrinchamSaleWest2007Constituency.svg
Ashton-under-Lyne BC 67,9784,263  Angela Rayner Dan Costello† Greater Manchester EnglandGreaterManchester.svg
AshtonUnderLyne2007Constituency.svg
Barrow and Furness 70,1585,789  Simon Fell Chris Altree‡ Cumbria EnglandCumbria.svg
BarrowFurness2007Constituency.svg
Birkenhead BC 63,76217,705  Mick Whitley  Frank Field

(Birkenhead Social Justice)

Merseyside EnglandMerseyside.svg
Birkenhead2007Constituency.svg
Blackburn BC 71,23418,304  Kate Hollern Claire Gill† Lancashire EnglandLancashire.svg
Blackburn2007Constituency.svg
Blackley and Broughton BC 73,37214,402  Graham Stringer Alexander Elias† Greater Manchester EnglandGreaterManchester.svg
BlackleyBroughton2007Constituency.svg
Blackpool North and Cleveleys BC 63,6928,596  Paul Maynard Chris Webb‡ Lancashire EnglandLancashire.svg
BlackpoolNorthCleveleys2007Constituency.svg
Blackpool South BC 57,6903,690  Scott Benton  Gordon Marsden Lancashire EnglandLancashire.svg
BlackpoolSouth2007Constituency.svg
Bolton North East BC 67,564378  Mark Logan  David Crausby Greater Manchester EnglandGreaterManchester.svg
BoltonNorthEast2007Constituency.svg
Bolton South East BC 69,1637,598  Yasmin Qureshi Johno Lee† Greater Manchester EnglandGreaterManchester.svg
BoltonSouthEast2007Constituency.svg
Bolton West CC 73,1918,855  Chris Green  Julie Hilling Greater Manchester EnglandGreaterManchester.svg
BoltonWest2007Constituency.svg
Bootle BC 74,83234,566  Peter Dowd Tarsilo Onuluk† Merseyside EnglandMerseyside.svg
Bootle2007Constituency.svg
Burnley BC 64,3451,352  Antony Higginbotham  Julie Cooper Lancashire EnglandLancashire.svg
Burnley2007Constituency.svg
Bury North BC 68,802105  James Daly  James Frith Greater Manchester EnglandGreaterManchester.svg
BuryNorth2007Constituency.svg
Bury South BC 75,152402  Christian Wakeford [nb 3]  Lucy Burke‡ Greater Manchester EnglandGreaterManchester.svg
BurySouth2007Constituency.svg
Carlisle 65,1058,319 John StevensonRuth Alcroft‡ Cumbria EnglandCumbria.svg
Carlisle2007Constituency.svg
Cheadle BC 74,5772,336  Mary Robinson Tom Morrison¤ Greater Manchester EnglandGreaterManchester.svg
Cheadle2007Constituency.svg
Chorley CC 78,17717,392  Lindsay Hoyle  Mark Brexit-Smith Lancashire EnglandLancashire.svg
Chorley2007Constituency.svg
City of Chester CC 28,541 [6] 10,974 [7]   Samantha Dixon Liz Wardlaw† Cheshire EnglandCheshire.svg
CityOfChester2007Constituency.svg
Congleton CC 80,93018,591  Fiona Bruce Jo Dale‡ Cheshire EnglandCheshire.svg
Congleton2007Constituency.svg
Copeland 61,6935,842 Trudy HarrisonTony Lywoood‡ Cumbria EnglandCumbria.svg
Copeland2007Constituency.svg
Crewe and Nantwich CC 80,3218,508  Kieran Mullan  Laura Smith Cheshire EnglandCheshire.svg
CreweNantwich2007Constituency.svg
Denton and Reddish BC 66,2346,175  Andrew Gwynne Ian Bott† Greater Manchester EnglandGreaterManchester.svg
DentonReddish2007Constituency.svg
Eddisbury CC 73,70018,443  Edward Timpson Terry Savage‡ Cheshire EnglandCheshire.svg
Eddisbury2007Constituency.svg
Ellesmere Port and Neston CC 70,3278,764  Justin Madders Alison Rodwell† Cheshire EnglandCheshire.svg
EllesmerePortNeston2007Constituency.svg
Fylde CC 66,84716,611  Mark Menzies Martin Mitchell‡ Lancashire EnglandLancashire.svg
Fylde2007Constituency.svg
Garston and Halewood BC 76,11631,624  Maria Eagle Neva Novaky† Merseyside EnglandMerseyside.svg
GarstonHalewood2007Constituency.svg
Halton CC 71,93018,975  Derek Twigg Charles Rowley† Cheshire EnglandCheshire.svg
Halton2007Constituency.svg
Hazel Grove CC 63,3464,423  William Wragg Lisa Smart¤ Greater Manchester EnglandGreaterManchester.svg
HazelGrove2007Constituency.svg
Heywood and Middleton CC 80,162663  Chris Clarkson  Liz McInnes Greater Manchester EnglandGreaterManchester.svg
HeywoodMiddleton2007Constituency.svg
Hyndburn BC 70,8422,961  Sara Britcliffe  Graham Jones Lancashire EnglandLancashire.svg
Hyndburn2007Constituency.svg
Knowsley BC 84,08239,942  George Howarth Rushi Millins† Merseyside EnglandMerseyside.svg
Knowsley2007Constituency.svg
Lancaster and Fleetwood CC 70,0592,380  Cat Smith Louise Thistletwhaite† Lancashire EnglandLancashire.svg
LancasterFleetwood2007Constituency.svg
Leigh CC 77,4171,965  James Grundy  Joanne Platt Greater Manchester EnglandGreaterManchester.svg
Leigh2007Constituency.svg
Liverpool, Riverside BC 80,31037,043  Kim Johnson Sean Malkeson† Merseyside EnglandMerseyside.svg
LiverpoolRiverside2007Constituency.svg
Liverpool, Walton BC 62,62830,520  Dan Carden Alex Phillips† Merseyside EnglandMerseyside.svg
LiverpoolWalton2007Constituency.svg
Liverpool, Wavertree BC 63,45827,085  Paula Barker Catherine Mulhern† Merseyside EnglandMerseyside.svg
LiverpoolWavertree2007Constituency.svg
Liverpool, West Derby BC 65,64029,984  Ian Byrne Tom Bradley† Merseyside EnglandMerseyside.svg
LiverpoolWestDerby2007Constituency.svg
Macclesfield CC 76,21610,711  David Rutley Neil Puttick‡ Cheshire EnglandCheshire.svg
Macclesfield2007Constituency.svg
Makerfield CC 74,1904,740  Yvonne Fovargue Nick King† Greater Manchester EnglandGreaterManchester.svg
Makerfield2007Constituency.svg
Manchester, Central BC 92,24729,089  Lucy Powell Shaden Jaradat† Greater Manchester EnglandGreaterManchester.svg
ManchesterCentral2007Constituency.svg
Manchester, Gorton BC 76,41930,339  Afzal Khan Sebastian Lowe† Greater Manchester EnglandGreaterManchester.svg
ManchesterGorton2007Constituency.svg
Manchester, Withington BC 76,53027,905  Jeff Smith  John Leech¤ Greater Manchester EnglandGreaterManchester.svg
ManchesterWithington2007Constituency.svg
Morecambe and Lunesdale CC 67,3976,354  David Morris Lizzi Collinge‡ Lancashire EnglandLancashire.svg
MorecambeLunesdale2007Constituency.svg
Oldham East and Saddleworth CC 72,1201,499  Debbie Abrahams Tom Lord† Greater Manchester EnglandGreaterManchester.svg
OldhamEastSaddleworth2007Constituency.svg
Oldham West and Royton CC 72,99917,198  Jim McMahon Kirsty Finlayson† Greater Manchester EnglandGreaterManchester.svg
OldhamWestRoyton2007Constituency.svg
Pendle BC 65,2926,186  Andrew Stephenson Azhar Ali‡ Lancashire EnglandLancashire.svg
Pendle2007Constituency.svg
Penrith and The Border 67,55518,519 Neil HudsonSarah Williams‡ Cumbria EnglandCumbria.svg
PenrithBorder2007Constituency.svg
Preston BC 65,29212,146  Mark Hendrick Michele Scott† Lancashire EnglandLancashire.svg
Preston2007Constituency.svg
Ribble Valley CC 79,24718,439  Nigel Evans Giles Bridge‡ Lancashire EnglandLancashire.svg
RibbleValley2007Constituency.svg
Rochdale CC 78,9095,697 (2024)  George Galloway  David Tully Greater Manchester EnglandGreaterManchester.svg
Rochdale2007Constituency.svg
Rossendale and Darwen BC 72,7709,522  Jake Berry Alyson Barnes‡ Lancashire EnglandLancashire.svg
RossendaleDarwen2007Constituency.svg
Salford and Eccles BC 82,20216,327  Rebecca Long-Bailey Attika Choudhary† Greater Manchester EnglandGreaterManchester.svg
SalfordEccles2007Constituency.svg
Sefton Central CC 69,76015,618  Bill Esterson Jade Marsden† Merseyside EnglandMerseyside.svg
SeftonCentral2007Constituency.svg
South Ribble CC 75,35111,199  Katherine Fletcher Kim Snape‡ Lancashire EnglandLancashire.svg
SouthRibble2007Constituency.svg
Southport BC 70,8372,914  Damien Moore Liz Savage‡ Merseyside EnglandMerseyside.svg
Southport2007Constituency.svg
St Helens North BC 75,59312,209  Conor McGinn Joel Charles† Merseyside EnglandMerseyside.svg
StHelensNorth2007Constituency.svg
St Helens South and Whiston BC 79,06119,122  Marie Rimmer Richard Short† Merseyside EnglandMerseyside.svg
StHelensSouthWhiston2007Constituency.svg
Stalybridge and Hyde CC 73,0642,946  Jonathan Reynolds Tayub Amjad† Greater Manchester EnglandGreaterManchester.svg
StalybridgeHyde2007Constituency.svg
Stockport BC 65,39110,039  Nav Mishra Isy Imarni† Greater Manchester EnglandGreaterManchester.svg
Stockport2007Constituency.svg
Stretford and Urmston BC 71,641 [8] 9,906 [8]   Andrew Western Emily Carter-Kandola† Greater Manchester EnglandGreaterManchester.svg
StretfordUrmston2007Constituency.svg
Tatton CC 69,01817,387  Esther McVey James Weinburg‡ Cheshire EnglandCheshire.svg
Tatton2007Constituency.svg
Wallasey BC 66,31018,322  Angela Eagle James Baker† Merseyside EnglandMerseyside.svg
Wallasey2007Constituency.svg
Warrington North BC 72,2351,509  Charlotte Nichols Wendy Maisey† Cheshire EnglandCheshire.svg
WarringtonNorth2007Constituency.svg
Warrington South BC 86,0152,010  Andy Carter  Faisal Rashid Cheshire EnglandCheshire.svg
WarringtonSouth2007Constituency.svg
Weaver Vale CC 70,551562  Mike Amesbury Adam Wordsworth† Cheshire EnglandCheshire.svg
WeaverVale2007Constituency.svg
West Lancashire CC 73,3478,336  Rosie Cooper Jack Gilmore† Lancashire EnglandLancashire.svg
WestLancashire2007Constituency.svg
Westmorland and Lonsdale 67,7891,934 Tim Farron¤James Airey† Cumbria EnglandCumbria.svg
WestmorlandLonsdale2007Constituency.svg
Wigan CC 75,6806,728  Lisa Nandy Ashley Williams† Greater Manchester EnglandGreaterManchester.svg
Wigan2007Constituency.svg
Wirral South CC 57,2806,105  Alison McGovern Stewart Gardiner† Merseyside EnglandMerseyside.svg
WirralSouth2007Constituency.svg
Wirral West CC 55,5503,003  Margaret Greenwood Laura Evans† Merseyside EnglandMerseyside.svg
WirralWest2007Constituency.svg
Workington 61,3704,176 Mark Jenkinson Sue Hayman Cumbria EnglandCumbria.svg
Workington2007Constituency.svg
Worsley and Eccles South CC 75,2193,219  Barbara Keeley Arnie Saunders† Greater Manchester EnglandGreaterManchester.svg
WorsleyEcclesSouth2007Constituency.svg
Wyre and Preston North CC 74,77516,781  Ben Wallace Joanne Ainscough‡ Lancashire EnglandLancashire.svg
WyrePrestonNorth2007Constituency.svg
Wythenshawe and Sale East BC 76,31310,396  Mike Kane Peter Harrop† Greater Manchester EnglandGreaterManchester.svg
WythenshaweSaleEast2007Constituency.svg

Proposed boundary changes

See 2023 Periodic Review of Westminster constituencies for further details.

Following the abandonment of the Sixth Periodic Review (the 2018 review), the Boundary Commission for England formally launched the 2023 Review on 5 January 2021. The Commission calculated that the number of seats to be allocated to the North West region will decrease by two, from 75 to 73. [9] Initial proposals were published on 8 June and, following two periods of public consultation, revised proposals were published on 8 November 2022. The final proposals were published on 28 June 2023.

Under the proposals, the following constituencies for the region will come into effect at the next general election: [10]

ConstituencyElectorateCeremonial countyLocal authority
Altrincham and Sale West BC 73,934 Greater Manchester Trafford
Ashton-under-Lyne BC 72,278Greater Manchester Tameside
Barrow and Furness CC 76,603 Cumbria Cumberland / Westmorland and Furness
Birkenhead BC 76,271 Merseyside Wirral
Blackburn BC 70,586 Lancashire Blackburn with Darwen
Blackley and Middleton South BC 71,735Greater Manchester Manchester / Rochdale
Blackpool North and Fleetwood BC 75,396Lancashire Blackpool / Wyre
Blackpool South BC 76,071LancashireBlackpool
Bolton North East BC 77,020Greater Manchester Bolton
Bolton South and Walkden BC 75,716Greater ManchesterBolton / Salford
Bolton West BC 72,125Greater ManchesterBolton
Bootle BC 75,194Merseyside Sefton
Burnley CC75,436Lancashire Burnley / Pendle
Bury North BC 77,009Greater Manchester Bury
Bury South BC 74,598Greater ManchesterBury / Salford
Carlisle CC 75,868CumbriaCumberland
Cheadle BC 73,775Greater Manchester Stockport
Chester North and Neston CC 72,327 Cheshire Cheshire West and Chester
Chester South and Eddisbury CC 71,975Cheshire Cheshire East / Cheshire West and Chester
Chorley CC 74,568Lancashire Chorley / South Ribble
Congleton CC 69,836Cheshire Cheshire East
Crewe and Nantwich CC 76,236CheshireCheshire East
Ellesmere Port and Bromborough BC 71,027Cheshire / MerseysideCheshire West and Chester / Wirral
Fylde CC 75,114Lancashire Fylde / Wyre
Gorton and Denton BC 74,306Greater Manchester Manchester / Tameside
Hazel Grove CC 72,941Greater ManchesterStockport
Heywood and Middleton North CC 73,306Greater Manchester Rochdale
Hyndburn CC 69,971Lancashire Hyndburn / Ribble Valley
Knowsley BC 71,228Merseyside Knowsley
Lancaster and Wyre CC 74,992Lancashire Lancaster / Wyre
Leigh and Atherton BC 76,363Greater Manchester Wigan
Liverpool Garston BC 70,372Merseyside Liverpool
Liverpool Riverside BC 70,157MerseysideLiverpool
Liverpool Walton BC 75,926MerseysideLiverpool / Sefton
Liverpool Wavertree BC 71,076MerseysideLiverpool
Liverpool West Derby BC 70,730MerseysideKnowsley / Liverpool
Macclesfield CC 75,881CheshireCheshire East
Makerfield BC 76,517Greater ManchesterWigan
Manchester Central BC 75,311Greater ManchesterManchester / Oldham
Manchester Rusholme BC 70,692Greater ManchesterManchester
Manchester Withington BC 71,614Greater ManchesterManchester
Mid Cheshire CC 69,775CheshireCheshire East / Cheshire West and Chester
Morecambe and Lunesdale CC 76,040Cumbria / LancashireLancaster / Westmorland and Furness
Oldham East and Saddleworth CC 72,997Greater ManchesterOldham
Oldham West, Chadderton and Royton BC 74,183Greater ManchesterOldham
Pendle and Clitheroe CC 76,941LancashirePendle / Ribble Valley
Penrith and Solway CC 76,720CumbriaCumberland / Westmorland and Furness
Preston BC 72,946Lancashire Preston
Ribble Valley CC 75,993LancashirePreston / Ribble Valley / South Ribble
Rochdale CC 71,697Greater ManchesterRochdale
Rossendale and Darwen BC 74,593LancashireBlackburn with Darwen / Rossendale
Runcorn and Helsby CC 70,950CheshireCheshire West and Chester / Halton
Salford BC 72,169Greater ManchesterSalford
Sefton Central CC 74,746MerseysideSefton
South Ribble CC 72,029LancashireSouth Ribble
Southport CC 74,168Lancashire / MerseysideSefton / West Lancashire
St Helens North CC 76,082Merseyside St Helens
St Helens South and Whiston BC 70,302MerseysideKnowsley / St Helens
Stalybridge and Hyde BC 73,028Greater ManchesterTameside
Stockport BC 74,769Greater ManchesterStockport
Stretford and Urmston BC 73,212Greater ManchesterTrafford
Tatton CC 75,538CheshireCheshire East / Cheshire West and Chester / Warrington
Wallasey BC 73,054MerseysideWirral
Warrington North CC 72,350CheshireWarrington
Warrington South BC 76,639CheshireWarrington
West Lancashire CC 73,652LancashireWest Lancashire
Westmorland and Lonsdale CC 72,322CumbriaWestmorland and Furness
Whitehaven and Workington CC 73,385CumbriaCumberland
Widnes and Halewood CC 70,865Cheshire / MerseysideHalton / Knowsley
Wigan CC 75,607Greater ManchesterWigan
Wirral West CC 72,126MerseysideWirral
Worsley and Eccles CC 76,915Greater ManchesterSalford / Wigan
Wythenshawe and Sale East BC 76,971Greater ManchesterManchester / Trafford

Results history

Primary data source: House of Commons research briefing - General election results from 1918 to 2019 [11]

2019

The number of votes cast for each political party who fielded candidates in constituencies comprising the North West region in the 2019 general election were as follows:

PartyVotes%Change from 2017SeatsChange from 2017
Conservative 1,321,07237.5%Increase2.svg1.3%32Increase2.svg12
Labour 1,665,08947.2%Decrease2.svg7.7%42Decrease2.svg12
Liberal Democrats 277,5057.9%Increase2.svg2.5%10
Greens 86,8152.5%Increase2.svg1.4%00
Brexit 136,1963.9%new00
Others37,0071.0%Decrease2.svg1.4%00
Total3,523,684100.075

Percentage votes

North West votes percentage North West votes %25.svg
North West votes percentage

Key:

CON - Conservative Party, including National Liberal Party up to 1966

LAB - Labour Party

LIB - Liberal Party up to 1979; SDP-Liberal Alliance 1983 & 1987; Liberal Democrats from 1992

UKIP/Br - UK Independence Party 2010 to 2017 (included in Other up to 2005 and in 2019); Brexit Party in 2019

Green - Green Party of England and Wales (included in Other up to 2005)

Seats

North West seats North West seats.svg
North West seats

Key:

CON - Conservative Party, including National Liberal Party up to 1966

LAB - Labour Party (2019 - includes the Speaker, Lindsay Hoyle)

LIB - Liberal Party up to 1979; SDP-Liberal Alliance 1983 & 1987; Liberal Democrats from 1992

OTH - 1997 - Independent (Martin Bell)

See also

Notes

  1. BC denotes borough constituency, CC denotes county constituency.
  2. The majority is the number of votes the winning candidate receives more than their nearest rival.
  3. Elected as a Conservative in 2019, Wakeford defected to Labour on 19 January 2022. [5]

Related Research Articles

The ceremonial county of Shropshire, England, is divided into 5 parliamentary constituencies – 1 borough constituency and 4 county constituencies. As with all constituencies for the House of Commons in the modern age, each constituency elects one Member of Parliament by the first-past-the-post system.

The region of South West England has, since the 2010 general election, 55 parliamentary constituencies which is made up of 15 borough constituencies and 40 county constituencies. At that election the Conservative Party held the largest number of constituencies, with 36. The Liberal Democrats had 15 and Labour had 4. At the 2015 general election the Liberal Democrats lost all of their seats, while the Conservatives gained one seat from Labour, leaving the Conservatives with 51 and Labour with 4. In the 2017 general election, the Conservatives remained, by far, the largest party with 47 seats, though losing three to Labour, who won 7, and one to the Liberal Democrats, who won 1. In the 2019 general election, the Conservatives increased their number of seats to 48 by regaining Stroud from Labour, who held their other six seats, while the Liberal Democrats retained their sole seat in Bath.

The region of North East England is divided into 29 parliamentary constituencies which is made up of 19 borough constituencies and 10 county constituencies. Since the 2019 general election, 17 are represented by Labour MPs and 11 by Conservative MPs. One is an independent.

The region of East Midlands is divided into 46 parliamentary constituencies which is made up of 12 borough constituencies and 34 county constituencies. Since the 2019 United Kingdom general election, 35 are represented by Conservative MPs, 8 by Labour MPs, 2 by independent MPs, and 1 by a Reform UK MP.

The region of Yorkshire and the Humber is divided into 54 parliamentary constituencies which is made up of 25 borough constituencies and 29 county constituencies. Since the general election of December 2019, 24 are represented by Conservative MPs and 30 by Labour MPs.

The region of the East of England is divided into 58 parliamentary constituencies which is made up of 16 borough constituencies and 42 county constituencies. Since the general election of December 2019, 51 are represented by Conservative MPs, six by Labour MPs, and one by a Liberal Democrat MP.

The region of West Midlands is divided into 59 parliamentary constituencies which is made up of 35 borough constituencies and 24 county constituencies. Since the general election of December 2019, 42 are represented by Conservative MPs, 16 by Labour MPs, and 1 by a Liberal Democrat MP.

The region of South East England is divided into 84 parliamentary constituencies, which are made up of 23 borough constituencies and 61 county constituencies. Since the general election of December 2019, 73 are represented by Conservative MPs, 8 by Labour MPs, 2 by Liberal Democrat MPs, and 1 by a Green MP.

References

  1. See NUTS 1 statistical regions of England
  2. "2019 Election Results". BBC.
  3. Baker, Carl; Uberoi, Elise; Cracknell, Richard (28 January 2020). "General Election 2019: full results and analysis".
  4. 1 2 3 "Constituencies A-Z - Election 2019". BBC News. Retrieved 26 April 2020.
  5. "Tory MP Christian Wakeford defects to Labour". BBC News . 19 January 2022. Retrieved 20 January 2022.
  6. Britain Elects [@BritainElects] (1 December 2022). "Chester by-election, turnout: 41.2% 28,541 votes cast" (Tweet) via Twitter.
  7. "Labour Holds Chester In By-Election Blow To Tories". HuffPost UK. 2 December 2022. Retrieved 3 December 2022.
  8. 1 2 "2022 Stretford and Urmston by-election result". Trafford Council. 16 December 2022.
  9. "2023 Review". Boundary Commission for England. Retrieved 8 January 2021.
  10. "The 2023 Review of Parliamentary Constituency Boundaries in England – Volume two: Constituency names, designations and composition – North West". Boundary Commission for England. Retrieved 8 July 2023.
  11. Watson, Christopher; Uberoi, Elise; Loft, Philip (17 April 2020). "General election results from 1918 to 2019".