Ashton under Lyne | |
---|---|
Borough constituency for the House of Commons | |
County | Greater Manchester |
Population | 90,484 (2011 census) [1] |
Electorate | 68,553 (December 2010) [2] |
Borough | Tameside |
Major settlements | Ashton-under-Lyne, Failsworth, Droylsden |
Current constituency | |
Created | 1832 |
Member of Parliament | Angela Rayner (Labour) |
Seats | 1 |
Created from | Lancashire |
Ashton-under-Lyne is a constituency [n 1] in the House of Commons of the UK Parliament. It has been represented since 2015 by Angela Rayner, who has served as Deputy Leader of the Labour Party since 2020. [n 2]
Like much of Greater Manchester, Ashton was a significant hub for textile production and retains some manufacturing. [3] Incomes and house prices are lower than UK averages. [4]
1832–1885: The area defined by the Ashton-under-Lyne Improvement Act 1827 (7 & 8 Geo. 4. c. lxxvii). [5]
1885–1918: The existing parliamentary borough, and so much of the parish of Ashton-under-Lyne included in the local government district of Hurst as was not already included in the parliamentary borough. [6]
1918–1949: The Municipal Borough of Ashton-under-Lyne, and the Urban District of Hurst.
1950–1955: The Municipal Boroughs of Ashton-under-Lyne, and Mossley; and the Rural District of Limehurst.
1955–1983: The Municipal Boroughs of Ashton-under-Lyne, and Mossley; and the Rural District of Droylsden. [7]
The constituency currently covers the Failsworth East and Failsworth West wards in the Metropolitan Borough of Oldham and the Ashton Hurst, Ashton St. Michael's, Ashton Waterloo, Droylsden East, Droylsden West and St. Peters wards of the Metropolitan Borough of Tameside.
Further to the 2023 Periodic Review of Westminster constituencies, enacted by the Parliamentary Constituencies Order 2023, from the next general election, due by January 2025, the constituency will be composed of the following wards of the Metropolitan Borough of Tameside (as they existed on 1 December 2020):
The constituency will gain the Audenshaw and Dukinfield wards from the (to be abolished) constituency of Denton and Reddish, and lose the two Failsworth wards to Manchester Central.
In the 1886 election, voting resulted in a tie between incumbent John Edmund Wentworth Addison and the Liberal candidate. Under the legislation of the time, the presiding officer had a casting vote, and Addison was reelected. In the by-election of 29 October 1928, the turnout was 89.1%, a record for Great Britain. The mayor arranged for the result to be signalled by coloured rockets. [20]
</ref>|votes=|percentage=|change=|}}
Party | Candidate | Votes | % | ±% | |
---|---|---|---|---|---|
Labour | Angela Rayner | ||||
Workers Party | Aroma Hassan [21] | ||||
Majority | |||||
Turnout |
Party | Candidate | Votes | % | ±% | |
---|---|---|---|---|---|
Labour | Angela Rayner | 18,544 | 48.1 | 12.3 | |
Conservative | Dan Costello | 14,281 | 37.0 | 5.0 | |
Brexit Party | Derek Brocklehurst | 3,151 | 8.2 | New | |
Liberal Democrats | George Rice | 1,395 | 3.6 | 2.0 | |
Green | Lee Huntbach | 1,208 | 3.1 | 1.8 | |
Majority | 4,263 | 11.1 | 17.3 | ||
Turnout | 38,579 | 56.3 | 2.5 | ||
Registered electors | 67,978 | ||||
Labour hold | Swing | 8.7 | |||
Party | Candidate | Votes | % | ±% | |
---|---|---|---|---|---|
Labour | Angela Rayner | 24,005 | 60.4 | 10.6 | |
Conservative | Jack Rankin | 12,710 | 32.0 | 9.9 | |
UKIP | Maurice Jackson | 1,878 | 4.7 | 17.1 | |
Liberal Democrats | Carly Hicks | 646 | 1.6 | 0.8 | |
Green | Andy Hunter-Rossall | 534 | 1.3 | 2.6 | |
Majority | 11,295 | 28.4 | 0.7 | ||
Turnout | 39,773 | 58.8 | 1.3 | ||
Registered electors | 65,751 | ||||
Labour hold | Swing | 0.4 | |||
Party | Candidate | Votes | % | ±% | |
---|---|---|---|---|---|
Labour | Angela Rayner | 19,366 | 49.8 | 1.4 | |
Conservative | Tracy Sutton | 8,610 | 22.1 | 2.6 | |
UKIP | Maurice Jackson | 8,468 | 21.8 | 17.4 | |
Green | Charlotte Hughes | 1,531 | 3.9 | New | |
Liberal Democrats | Carly Hicks | 943 | 2.4 | 12.4 | |
Majority | 10,756 | 27.7 | 4.0 | ||
Turnout | 38,918 | 57.5 | 0.6 | ||
Registered electors | 68,343 | ||||
Labour hold | Swing | 2.0 | |||
UKIP originally selected Angela McManus as candidate, [25] but she changed to the Stalybridge and Hyde constituency. [26]
Party | Candidate | Votes | % | ±% | |
---|---|---|---|---|---|
Labour | David Heyes | 18,604 | 48.4 | 10.1 | |
Conservative | Seema Kennedy | 9,510 | 24.7 | 4.6 | |
Liberal Democrats | Paul Larkin [28] | 5,703 | 14.8 | 3.2 | |
BNP | David Lomas | 2,929 | 7.6 | 1.7 | |
UKIP | Angela McManus | 1,686 | 4.4 | 2.3 | |
Majority | 9,094 | 23.7 | 14.0 | ||
Turnout | 38,432 | 56.9 | 5.4 | ||
Registered electors | 67,714 | ||||
Labour hold | Swing | 7.3 | |||
Party | Candidate | Votes | % | ±% | |
---|---|---|---|---|---|
Labour | David Heyes | 21,211 | 57.4 | 5.1 | |
Conservative | Graeme Brown | 7,259 | 19.6 | 0.5 | |
Liberal Democrats | Les Jones | 5,108 | 13.8 | 2.0 | |
BNP | Anthony Jones | 2,051 | 5.5 | 1.0 | |
UKIP | John Whittaker | 768 | 2.1 | New | |
Local Community Party | Jack Crossfield | 570 | 1.5 | New | |
Majority | 13,952 | 37.8 | 6.6 | ||
Turnout | 36,967 | 51.3 | 2.2 | ||
Registered electors | 71,291 | ||||
Labour hold | Swing | 2.8 | |||
Party | Candidate | Votes | % | ±% | |
---|---|---|---|---|---|
Labour | David Heyes | 22,340 | 62.5 | 5.0 | |
Conservative | Tim Charlesworth | 6,822 | 19.1 | 0.2 | |
Liberal Democrats | Kate Fletcher | 4,237 | 11.8 | 2.1 | |
BNP | Roger Woods | 1,617 | 4.5 | New | |
Green | Nigel Rolland | 748 | 2.1 | New | |
Majority | 15,518 | 43.4 | 5.2 | ||
Turnout | 35,764 | 49.1 | 16.4 | ||
Registered electors | 72,820 | ||||
Labour hold | Swing | 2.6 | |||
Party | Candidate | Votes | % | ±% | |
---|---|---|---|---|---|
Labour | Robert Sheldon | 31,919 | 67.5 | 10.9 | |
Conservative | Richard Mayson | 8,954 | 18.9 | 12.5 | |
Liberal Democrats | Tim Pickstone | 4,603 | 9.7 | 0.5 | |
Referendum | Lorraine Clapham | 1,346 | 2.8 | New | |
Monster Raving Loony | Prince Cymbal | 458 | 1.0 | New | |
Majority | 22,965 | 48.6 | 23.4 | ||
Turnout | 47,280 | 65.5 | 8.4 | ||
Registered electors | 72,308 | ||||
Labour hold | Swing | 11.7 | |||
Party | Candidate | Votes | % | ±% | |
---|---|---|---|---|---|
Labour | Robert Sheldon | 24,550 | 56.6 | 4.8 | |
Conservative | John R. Pinniger | 13,615 | 31.4 | 1.1 | |
Liberal Democrats | Charles W. Turner | 4,005 | 9.2 | 8.8 | |
Liberal | Colin L. Hall | 907 | 2.1 | N/A | |
Natural Law | John Brannigan | 289 | 0.7 | New | |
Majority | 10,935 | 25.2 | 3.7 | ||
Turnout | 43,366 | 73.9 | 0.1 | ||
Registered electors | 58,701 | ||||
Labour hold | Swing | 1.9 | |||
Party | Candidate | Votes | % | ±% | |
---|---|---|---|---|---|
Labour | Robert Sheldon | 22,389 | 51.8 | 2.1 | |
Conservative | Henry Cadman | 13,103 | 30.3 | 1.2 | |
Liberal | Mark Hunter | 7,760 | 18.0 | New | |
Majority | 9,286 | 21.5 | 3.3 | ||
Turnout | 43,250 | 74.0 | 2.4 | ||
Registered electors | 58,440 | ||||
Labour hold | Swing | 1.7 | |||
Party | Candidate | Votes | % | ±% | |
---|---|---|---|---|---|
Labour | Robert Sheldon | 20,987 | 49.7 | 5.0 | |
Conservative | Richard Spring | 13,290 | 31.5 | 4.5 | |
SDP | John Adler | 7,521 | 17.8 | 9.6 | |
Independent | Dave Hallsworth | 407 | 1.0 | New | |
Majority | 7,697 | 18.2 | 0.5 | ||
Turnout | 42,196 | 71.6 | 5.0 | ||
Registered electors | 58,963 | ||||
Labour hold | Swing | 0.3 | |||
Party | Candidate | Votes | % | ±% | |
---|---|---|---|---|---|
Labour | Robert Sheldon | 24,535 | 54.7 | 0.8 | |
Conservative | Alan Fearn | 16,156 | 36.0 | 6.7 | |
Liberal | G. Taylor | 3,699 | 8.2 | 8.7 | |
National Front | D. Jones | 486 | 1.1 | New | |
Majority | 8,379 | 18.7 | 5.9 | ||
Turnout | 44,876 | 76.6 | 4.4 | ||
Registered electors | 58,588 | ||||
Labour hold | Swing | 3.0 | |||
Party | Candidate | Votes | % | ±% | |
---|---|---|---|---|---|
Labour | Robert Sheldon | 23,490 | 53.9 | 5.5 | |
Conservative | M.H. Litchfield | 12,763 | 29.3 | 1.6 | |
Liberal | T.G. Jones | 7,356 | 16.9 | 3.8 | |
Majority | 10,727 | 24.6 | 7.1 | ||
Turnout | 43,609 | 72.2 | 7.3 | ||
Registered electors | 60,393 | ||||
Labour hold | Swing | 3.6 | |||
Party | Candidate | Votes | % | ±% | |
---|---|---|---|---|---|
Labour | Robert Sheldon | 23,019 | 48.4 | 6.1 | |
Conservative | Timothy Maxwell Aitken | 14,718 | 30.9 | 14.6 | |
Liberal | J.G. Jones | 9,837 | 20.7 | New | |
Majority | 8,301 | 17.5 | 8.5 | ||
Turnout | 47,574 | 79.5 | 8.1 | ||
Registered electors | 59,881 | ||||
Labour hold | Swing | 4.3 | |||
Party | Candidate | Votes | % | ±% | |
---|---|---|---|---|---|
Labour | Robert Sheldon | 23,927 | 54.5 | 4.2 | |
Conservative | Alan d'A. Fearn | 19,973 | 45.5 | 4.2 | |
Majority | 3,954 | 9.0 | 8.4 | ||
Turnout | 43,900 | 71.4 | 2.3 | ||
Registered electors | 61,468 | ||||
Labour hold | Swing | 4.2 | |||
Party | Candidate | Votes | % | ±% | |
---|---|---|---|---|---|
Labour | Robert Sheldon | 24,728 | 58.7 | 4.2 | |
Conservative | Henry Donald Moore | 17,396 | 41.3 | 4.2 | |
Majority | 7,332 | 17.4 | 8.4 | ||
Turnout | 42,124 | 73.7 | 3.7 | ||
Registered electors | 57,159 | ||||
Labour hold | Swing | 4.2 | |||
Party | Candidate | Votes | % | ±% | |
---|---|---|---|---|---|
Labour | Robert Sheldon | 24,657 | 54.5 | 1.7 | |
Conservative | Henry Donald Moore | 20,550 | 45.5 | 1.7 | |
Majority | 4,107 | 9.0 | 3.4 | ||
Turnout | 45,213 | 77.4 | 3.7 | ||
Registered electors | 58,411 | ||||
Labour hold | Swing | 1.7 | |||
Party | Candidate | Votes | % | ±% | |
---|---|---|---|---|---|
Labour | Hervey Rhodes | 25,991 | 52.8 | 0.8 | |
Conservative | Robert Horrocks | 23,239 | 47.2 | 0.9 | |
Majority | 2,752 | 5.6 | 1.7 | ||
Turnout | 49,230 | 81.1 | 1.0 | ||
Registered electors | 60,706 | ||||
Labour hold | Swing | 0.9 | |||
Party | Candidate | Votes | % | ±% | |
---|---|---|---|---|---|
Labour | Hervey Rhodes | 26,216 | 52.0 | 0.1 | |
Conservative | Edwin Hodson | 24,251 | 48.1 | 0.1 | |
Majority | 1,965 | 3.9 | 0.2 | ||
Turnout | 50,467 | 80.1 | 4.8 | ||
Registered electors | 62,392 | ||||
Labour hold | Swing | 0.1 | |||
Party | Candidate | Votes | % | ±% | |
---|---|---|---|---|---|
Labour | Hervey Rhodes | 21,424 | 52.1 | 1.5 | |
Conservative | Kenneth Lewis | 19,740 | 48.0 | 0.3 | |
Majority | 1,684 | 4.1 | 1.8 | ||
Turnout | 41,164 | 84.9 | 1.5 | ||
Registered electors | 48,490 | ||||
Labour hold | Swing | 0.9 | |||
Party | Candidate | Votes | % | ±% | |
---|---|---|---|---|---|
Labour | Hervey Rhodes | 20,970 | 50.6 | 5.8 | |
Conservative | Gilbert Burdett Howcroft | 20,046 | 48.3 | 4.7 | |
Communist | H.H.H. Blackwell | 459 | 1.1 | New | |
Majority | 924 | 2.3 | 10.5 | ||
Turnout | 41,475 | 86.4 | 7.8 | ||
Registered electors | 47,989 | ||||
Labour hold | Swing | 8.4 | |||
Party | Candidate | Votes | % | ±% | |
---|---|---|---|---|---|
Labour | Hervey Rhodes | 12,889 | 54.1 | 2.3 | |
Conservative | Robert Cary | 8,360 | 35.0 | 8.6 | |
Liberal | A. Beale | 2,604 | 10.9 | New | |
Majority | 4,529 | 19.1 | 6.3 | ||
Turnout | 23,853 | 70.5 | 8.1 | ||
Labour hold | Swing | 3.2 | |||
Party | Candidate | Votes | % | ±% | |
---|---|---|---|---|---|
Labour | William Jowitt | 14,998 | 56.4 | 6.2 | |
Conservative | Francis Henry Gerard Heron Goodhart | 11,604 | 43.6 | 6.2 | |
Majority | 3,394 | 12.8 | 12.4 | ||
Turnout | 26,602 | 78.6 | 2.4 | ||
Registered electors | 33,790 | ||||
Labour hold | Swing | 6.2 | |||
Party | Candidate | Votes | % | ±% | |
---|---|---|---|---|---|
Labour | William Jowitt | Unopposed | |||
Labour hold | |||||
Party | Candidate | Votes | % | ±% | |
---|---|---|---|---|---|
Labour | Fred Simpson | 14,140 | 50.2 | 13.1 | |
Conservative | John Broadbent | 14,026 | 49.8 | 2.7 | |
Majority | 114 | 0.4 | N/A | ||
Turnout | 28,166 | 81.0 | 4.3 | ||
Registered electors | 34,789 | ||||
Labour gain from Conservative | Swing | 7.9 | |||
Party | Candidate | Votes | % | ±% | |
---|---|---|---|---|---|
Conservative | John Broadbent | 15,652 | 52.5 | 19.5 | |
Labour | John William Gordon | 11,074 | 37.1 | 7.3 | |
Liberal | James Taylor Middleton | 2,696 | 9.0 | New | |
New Party | Charles B. Hobhouse | 424 | 1.4 | N/A | |
Majority | 4,578 | 15.4 | 4.0 | ||
Turnout | 29,846 | 85.3 | 0.6 | ||
Conservative gain from Labour | Swing | 5.1 | |||
Party | Candidate | Votes | % | ±% | |
---|---|---|---|---|---|
Conservative | John Broadbent | 12,420 | 44.6 | 11.6 | |
Labour | John William Gordon | 11,005 | 39.4 | 5.0 | |
New Party | Allan Young | 4,472 | 16.0 | New | |
Majority | 1,415 | 5.2 | N/A | ||
Turnout | 27,897 | 80.2 | 5.7 | ||
Conservative gain from Labour | Swing | 8.3 | |||
Party | Candidate | Votes | % | ±% | |
---|---|---|---|---|---|
Labour | Albert Bellamy | 13,170 | 44.4 | 3.8 | |
Unionist | John Broadbent | 9,763 | 33.0 | 2.7 | |
Liberal | William Gilbert Greenwood | 6,693 | 22.6 | 6.5 | |
Majority | 3,407 | 11.4 | 1.4 | ||
Turnout | 29,626 | 85.9 | 3.2 | ||
Labour hold | Swing | 0.6 | |||
Party | Candidate | Votes | % | ±% | |
---|---|---|---|---|---|
Labour | Albert Bellamy | 9,567 | 40.6 | 7.8 | |
Unionist | Gordon Touche | 7,161 | 30.3 | 9.2 | |
Liberal | William Gilbert Greenwood | 6,874 | 29.1 | 1.4 | |
Majority | 2,406 | 10.3 | N/A | ||
Turnout | 23,512 | 89.1 | 0.8 | ||
Labour gain from Unionist | Swing | 8.5 | |||
Party | Candidate | Votes | % | ±% | |
---|---|---|---|---|---|
Unionist | Cornelius Homan | 8,971 | 39.5 | 3.3 | |
Labour | Cecil Malone | 7,451 | 32.8 | 4.1 | |
Liberal | Henry Thomas Greenwood | 6,692 | 27.7 | 7.4 | |
Majority | 1,520 | 6.7 | 5.6 | ||
Turnout | 23,114 | 88.3 | 3.0 | ||
Unionist hold | Swing | 0.4 | |||
Party | Candidate | Votes | % | ±% | |
---|---|---|---|---|---|
Unionist | Walter de Frece | 7,813 | 36.2 | 21.4 | |
Liberal | Henry Thomas Greenwood | 7,574 | 35.1 | New | |
Labour | Ellen Wilkinson | 6,208 | 28.7 | 13.7 | |
Majority | 239 | 1.1 | 14.1 | ||
Turnout | 21,595 | 85.3 | 2.0 | ||
Unionist hold | Swing | ||||
Party | Candidate | Votes | % | ±% | |
---|---|---|---|---|---|
Unionist | Walter de Frece | 12,006 | 57.6 | 14.3 | |
Labour | Tom Gillinder | 8,834 | 42.4 | 2.8 | |
Majority | 3,172 | 15.2 | 11.5 | ||
Turnout | 20,840 | 83.3 | 1.0 | ||
Unionist hold | Swing | 5.7 | |||
Party | Candidate | Votes | % | ±% | |
---|---|---|---|---|---|
C | Unionist | Walter de Frece | 8,864 | 43.3 | 15.0 |
Labour | William C. Robinson | 8,127 | 39.6 | New | |
Liberal | Arthur Marshall | 3,511 | 17.1 | New | |
Majority | 738 | 3.7 | 12.9 | ||
Turnout | 20,502 | 82.3 | 13.9 | ||
Unionist hold | Swing | ||||
Cindicates candidate endorsed by the coalition government. |
Party | Candidate | Votes | % | ±% | |
---|---|---|---|---|---|
C | Unionist | Albert Stanley | 10,261 | 58.3 | 7.2 |
NFDDSS | Frederick Lister | 7,334 | 41.7 | New | |
Majority | 2,927 | 16.6 | 14.2 | ||
Turnout | 17,595 | 68.4 | 23.4 | ||
Unionist hold | Swing | ||||
Cindicates candidate endorsed by the coalition government. |
Party | Candidate | Votes | % | ±% | |
---|---|---|---|---|---|
Unionist | Albert Stanley | Unopposed | |||
Unionist hold | |||||
Party | Candidate | Votes | % | ±% | |
---|---|---|---|---|---|
Conservative | Max Aitken | 4,044 | 51.1 | 5.2 | |
Liberal | Alfred Scott | 3,848 | 48.8 | 0.5 | |
Majority | 196 | 2.4 | N/A | ||
Turnout | 7,652 | 91.8 | 3.6 | ||
Conservative gain from Liberal | Swing | 3.0 | |||
Party | Candidate | Votes | % | ±% | |
---|---|---|---|---|---|
Liberal | Alfred Scott | 4,039 | 49.3 | 7.0 | |
Conservative | Herbert Whiteley | 3,746 | 45.9 | 2.2 | |
Independent Labour | William Gee | 413 | 5.0 | New | |
Majority | 293 | 3.4 | 9.2 | ||
Turnout | 8,198 | 95.4 | 2.6 | ||
Liberal hold | Swing | 4.6 | |||
Party | Candidate | Votes | % | ±% | |
---|---|---|---|---|---|
Liberal | Alfred Scott | 4,310 | 56.3 | 20.4 | |
Conservative | Herbert Whiteley | 3,342 | 43.7 | 9.4 | |
Majority | 968 | 12.6 | N/A | ||
Turnout | 7,652 | 92.8 | 6.6 | ||
Registered electors | 8,248 | ||||
Liberal gain from Conservative | Swing | 14.8 | |||
Party | Candidate | Votes | % | ±% | |
---|---|---|---|---|---|
Conservative | Herbert Whiteley | 3,545 | 53.1 | 0.5 | |
Liberal | Ernest Albert Parkin | 2,400 | 35.9 | 5.1 | |
Labour Repr. Cmte. | James Johnston | 737 | 11.0 | New | |
Majority | 1,145 | 17.2 | 5.6 | ||
Turnout | 6,682 | 86.2 | 5.1 | ||
Registered electors | 7,753 | ||||
Conservative hold | Swing | 2.8 | |||
Party | Candidate | Votes | % | ±% | |
---|---|---|---|---|---|
Conservative | Herbert Whiteley | 3,434 | 52.6 | 1.6 | |
Liberal | William Woods | 2,680 | 41.0 | 8.0 | |
Ind. Labour Party | James Sexton | 415 | 6.4 | New | |
Majority | 754 | 11.6 | 9.6 | ||
Turnout | 6,529 | 91.3 | 2.6 | ||
Registered electors | 7,152 | ||||
Conservative hold | Swing | 4.8 | |||
Party | Candidate | Votes | % | ±% | |
---|---|---|---|---|---|
Conservative | John Addison | 3,358 | 51.0 | 1.0 | |
Liberal | Octavius Morgan | 3,223 | 49.0 | 1.0 | |
Majority | 135 | 2.0 | 2.0 | ||
Turnout | 6,581 | 93.9 | 0.8 | ||
Registered electors | 7,012 | ||||
Conservative hold | Swing | 1.0 | |||
Party | Candidate | Votes | % | ±% | |
---|---|---|---|---|---|
Conservative | John Addison | 3,050* | 50.0 | 0.4 | |
Liberal | Alexander Rowley [38] [39] | 3,049 | 50.0 | 0.4 | |
Majority | 1 | 0.0 | 0.8 | ||
Turnout | 6,099 | 93.1 | 2.4 | ||
Registered electors | 6,553 | ||||
Conservative hold | Swing | 0.4 | |||
* Both candidates having received 3,049 votes each, Addison was elected on the Returning Officer's casting vote.
Party | Candidate | Votes | % | ±% | |
---|---|---|---|---|---|
Conservative | John Addison | 3,153 | 50.4 | 3.8 | |
Liberal | Hugh Mason | 3,104 | 49.6 | 3.8 | |
Majority | 49 | 0.8 | N/A | ||
Turnout | 6,257 | 95.5 | 1.4 | ||
Registered electors | 6,553 | ||||
Conservative gain from Liberal | Swing | 3.8 | |||
Party | Candidate | Votes | % | ±% | |
---|---|---|---|---|---|
Liberal | Hugh Mason | 2,966 | 53.4 | 5.2 | |
Conservative | John Ross Coulthart [41] | 2,586 | 46.6 | 5.2 | |
Majority | 380 | 6.8 | N/A | ||
Turnout | 5,552 | 94.1 | 1.9 | ||
Registered electors | 5,901 | ||||
Liberal gain from Conservative | Swing | 5.2 | |||
Party | Candidate | Votes | % | ±% | |
---|---|---|---|---|---|
Conservative | Thomas Walton Mellor | 2,612 | 51.8 | 0.6 | |
Liberal | Abel Buckley [42] | 2,432 | 48.2 | 0.6 | |
Majority | 180 | 3.6 | 1.2 | ||
Turnout | 5,044 | 92.2 | 0.4 | ||
Registered electors | 5,471 | ||||
Conservative hold | Swing | ||||
Party | Candidate | Votes | % | ±% | |
---|---|---|---|---|---|
Conservative | Thomas Walton Mellor | 2,318 | 52.4 | New | |
Liberal | Thomas Milner Gibson | 2,109 | 47.6 | N/A | |
Majority | 209 | 4.8 | N/A | ||
Turnout | 4,427 | 91.8 | N/A | ||
Registered electors | 4,822 | ||||
Conservative gain from Liberal | Swing | N/A | |||
Party | Candidate | Votes | % | ±% | |
---|---|---|---|---|---|
Liberal | Thomas Milner Gibson | Unopposed | |||
Registered electors | 967 | ||||
Liberal hold | |||||
Party | Candidate | Votes | % | ±% | |
---|---|---|---|---|---|
Liberal | Thomas Milner Gibson | Unopposed | |||
Liberal hold | |||||
Party | Candidate | Votes | % | ±% | |
---|---|---|---|---|---|
Liberal | Thomas Milner Gibson | Unopposed | |||
Liberal hold | |||||
Party | Candidate | Votes | % | ±% | |
---|---|---|---|---|---|
Liberal | Thomas Milner Gibson | Unopposed | |||
Registered electors | 1,081 | ||||
Liberal hold | |||||
Party | Candidate | Votes | % | ±% | |
---|---|---|---|---|---|
Radical | Thomas Milner Gibson | 522 | 57.2 | N/A | |
Conservative | Booth Mason [43] | 390 | 42.8 | New | |
Majority | 132 | 14.4 | N/A | ||
Turnout | 912 | 84.1 | N/A | ||
Registered electors | 1,085 | ||||
Radical hold | |||||
Party | Candidate | Votes | % | ±% | |
---|---|---|---|---|---|
Radical | Charles Hindley | Unopposed | |||
Registered electors | 1,085 | ||||
Radical hold | |||||
Party | Candidate | Votes | % | ±% | |
---|---|---|---|---|---|
Radical | Charles Hindley | Unopposed | |||
Registered electors | 937 | ||||
Radical hold | |||||
Party | Candidate | Votes | % | ±% | |
---|---|---|---|---|---|
Radical | Charles Hindley | Unopposed | |||
Registered electors | 871 | ||||
Radical hold | |||||
Party | Candidate | Votes | % | ±% | |
---|---|---|---|---|---|
Radical | Charles Hindley | 303 | 54.4 | 2.5 | |
Conservative | Jonah Harrop [44] | 254 | 45.6 | 1.6 | |
Majority | 49 | 8.8 | 0.9 | ||
Turnout | 557 | 78.1 | 2.3 | ||
Registered electors | 713 | ||||
Radical hold | Swing | 0.5 | |||
Party | Candidate | Votes | % | ±% | |
---|---|---|---|---|---|
Radical | Charles Hindley | 237 | 51.9 | 3.9 | |
Conservative | James Wood | 201 | 44.0 | 16.4 | |
Chartist | Rayner Stephens | 19 | 4.2 | New | |
Majority | 36 | 7.9 | 20.3 | ||
Turnout | 457 | 75.8 | 2.0 | ||
Registered electors | 603 | ||||
Radical hold | Swing | 10.2 | |||
Party | Candidate | Votes | % | ±% | |
---|---|---|---|---|---|
Radical | Charles Hindley | 212 | 55.8 | 12.0 | |
Conservative | Thomas William Helps | 105 | 27.6 | 18.7 | |
Radical | George Williams | 63 | 16.6 | 30.7 | |
Majority | 107 | 28.2 | 24.7 | ||
Turnout | 380 | 73.8 | 12.1 | ||
Registered electors | 515 | ||||
Radical hold | Swing | 3.4 | |||
Party | Candidate | Votes | % | ±% | |
---|---|---|---|---|---|
Radical | George Williams | 176 | 47.3 | N/A | |
Radical | Charles Hindley | 163 | 43.8 | N/A | |
Tory | Thomas William Helps | 33 | 8.9 | N/A | |
Majority | 13 | 3.5 | N/A | ||
Turnout | 372 | 85.9 | N/A | ||
Registered electors | 433 | ||||
Radical win (new seat) |
Tameside is a metropolitan borough of Greater Manchester, England, named after the River Tame, which flows through it, and includes the towns of Ashton-under-Lyne, Audenshaw, Denton, Droylsden, Dukinfield, Hyde, Mossley and Stalybridge. Tameside is bordered by the metropolitan boroughs of Stockport to the south, Oldham to the north and northeast, Manchester to the west, and to the east by the Borough of High Peak in Derbyshire. As of 2021, the population of Tameside was 231,199, making it the 8th-most populous borough of Greater Manchester by population.
Droylsden is a town in Tameside, Greater Manchester, England, 4.1 miles (6.6 km) east of Manchester city centre and 2.2 miles (3.5 km) west of Ashton-under-Lyne, with a population at the 2011 Census of 22,689.
Wokingham is a constituency in Berkshire represented in the House of Commons of the Parliament of the United Kingdom since 1987 by John Redwood, a Conservative.
Preston is a constituency represented in the House of Commons of the UK Parliament since 2000 by Sir Mark Hendrick, a member of the Labour Party and Co-operative Party.
Denton and Reddish is a constituency represented in the House of Commons of the UK Parliament since 2005 by Andrew Gwynne of the Labour Party.
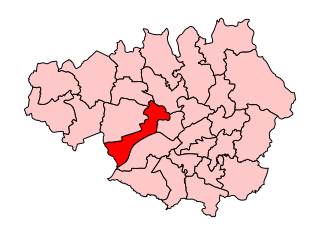
Eccles was a parliamentary constituency of the United Kingdom, centred on the town of Eccles in Greater Manchester, England. It returned one Member of Parliament (MP) to the House of Commons of the Parliament of the United Kingdom, elected by the first past the post system.
Makerfield is a constituency represented in the House of Commons of the UK Parliament since 2010 by Yvonne Fovargue of the Labour Party.
Manchester Central is a parliamentary constituency in Greater Manchester created in 1974 represented in the House of Commons of the UK Parliament since 2012 by Lucy Powell of the Labour Party and Co-operative Party.
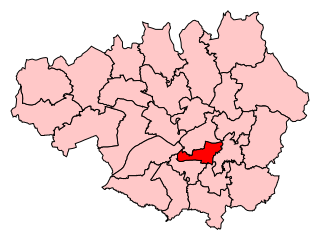
Manchester Gorton is a constituency represented in the House of Commons of the UK Parliament by Labour's Afzal Khan, who was elected at the 2017 general election. It is the safest Labour seat in Greater Manchester by numerical majority and one of the safest in the country.
Oldham West and Royton is a constituency represented in the House of Commons of the UK Parliament. It has been represented by Jim McMahon of the Labour Co-op party since 4 December 2015, after winning a by-election following the death of Michael Meacher on 21 October 2015.
Stalybridge and Hyde is a constituency in Greater Manchester represented in the House of Commons of the UK Parliament since 2010 by Jonathan Reynolds, who has served as Shadow Secretary of State for Business and Trade since 2021 as a member of Labour Co-op.
Stockport is a constituency represented in the House of Commons of the UK Parliament since 2019 by Navendu Mishra of the Labour Party.
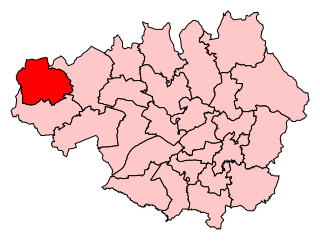
Wigan is a constituency in Greater Manchester, represented in the House of Commons of the UK Parliament since 2010 by Lisa Nandy of the Labour Party, who currently serves as the Shadow Cabinet Minister for International Development.
Berwick-upon-Tweed is a parliamentary constituency in Northumberland represented in the House of Commons of the UK Parliament since 2015 by Anne-Marie Trevelyan, a Conservative.
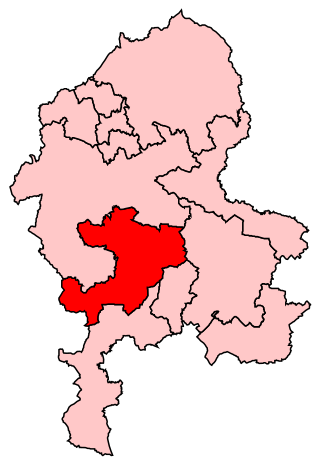
Stafford is a constituency represented in the House of Commons of the UK Parliament since 2019 by Theodora Clarke, a Conservative.
Mossley was a parliamentary constituency which returned one Member of Parliament (MP) to the House of Commons of the United Kingdom Parliament.
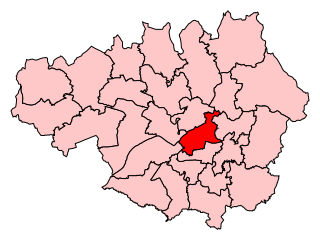
Manchester Openshaw was a parliamentary constituency centred on the Openshaw district of Manchester. It returned one Member of Parliament (MP) to the House of Commons of the Parliament of the United Kingdom.
Prestwich was a constituency in the county of Lancashire of the House of Commons for the Parliament of the United Kingdom. Created by the Redistribution of Seats Act 1885, it was represented by one Member of Parliament. The constituency was abolished in 1918.
Droylsden was a parliamentary constituency in the historic county of Lancashire in the North West of England. It returned one Member of Parliament (MP) to the House of Commons of the Parliament of the United Kingdom, elected by the first past the post system.