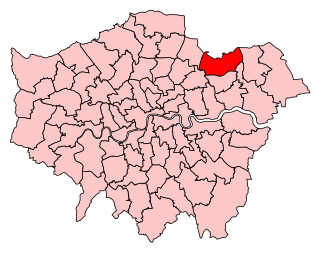
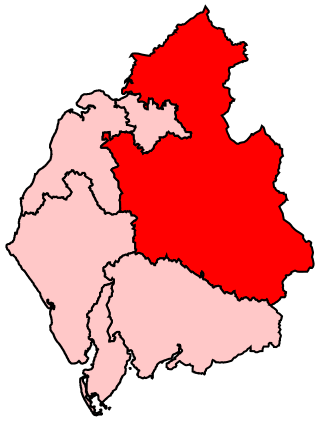
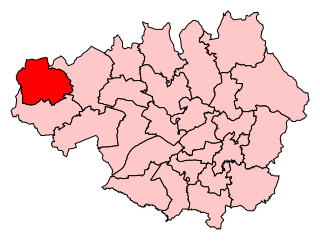
Carlisle | |
---|---|
Borough constituency for the House of Commons | |
County | Cumbria |
Population | 85,979 (2011 census) [1] |
Electorate | 66,322 (December 2010) [2] |
Major settlements | Carlisle |
Current constituency | |
Created | 1295 |
Member of Parliament | John Stevenson (Conservative) |
Seats | 1295–1885: Two 1885–present: One |
Carlisle is a constituency [n 1] in Cumbria represented in the House of Commons of the UK Parliament since 2010 by John Stevenson of the Conservative Party. [n 2]
Carlisle has existed as a seat since the Model Parliament in 1295. It was represented by Labour Party MPs from 1964 to 2010, although the Conservative candidate came within 2% of taking the seat in 1983–1987, and has been held by John Stevenson of the Conservative Party since the 2010 general election.
1918–1955: The County Borough of Carlisle.
1955–1983: As 1918 but with redrawn boundaries.
1983–1997: The City of Carlisle wards of Belah, Belle Vue, Botcherby, Currock, Denton Holme, Harraby, Morton, St Aidan's, Stanwix Urban, Trinity, Upperby, and Yewdale.
1997–2010: The City of Carlisle wards of Belah, Belle Vue, Botcherby, Burgh, Currock, Dalston, Denton Holme, Harraby, Morton, St Aidan's, St Cuthbert Without, Stanwix Urban, Trinity, Upperby, and Yewdale.
2010–present: The City of Carlisle wards of Belah, Belle Vue, Botcherby, Burgh, Castle, Currock, Dalston, Denton Holme, Harraby, Morton, St Aidan's, Stanwix Urban, Upperby, Wetheral, and Yewdale.
Further to the 2023 Periodic Review of Westminster constituencies, enacted by the Parliamentary Constituencies Order 2023, from the next general election, due by January 2025, the constituency will be composed of the following wards of the City of Carlisle (as they existed on 1 December 2020):
The constituency will be expanded to bring the electorate within the permitted range by transferring the parts of the (former) City of Carlisle local authority currently in the (to be abolished) constituency of Penrith and The Border - comprising the towns of Brampton and Longtown and surrounding villages and rural areas. To partly compensate, the Dalston & Burgh ward will be included in the new constituency of Penrith and Solway.
With effect from 1 April 2023, the City of Carlisle council was abolished and absorbed into the new unitary authority of Cumberland. [4] The constituency will therefore now comprise the following wards of Cumberland from the next general election:
The constituency covers the city of Carlisle itself. It also covers the rural area of the district to the south and west of the city, including the village of Dalston. The remaining parts of the district are in the Penrith and The Border constituency. Historically the constituency was tightly drawn around the city which favour the Labour Party but has gradually expanded to contain more rural areas within the district that are far more Conservative-inclined, such as Burgh, Dalston and Wetheral. This has seen the constituency shift from being a safe Labour seat to marginal status.
First Protectorate Parliament (One member only)
Second Protectorate Parliament (One member only)
Long Parliament (restored)
Party | Candidate | Votes | % | ±% | |
---|---|---|---|---|---|
Green | Gavin Hawkton [34] | ||||
SDP | Rachel Hayton [35] | ||||
Labour | Julie Minns [36] | ||||
Conservative | John Stevenson [37] | ||||
Reform UK | Stephen Ward [38] | ||||
Liberal Democrats | Brian Wernham [39] | ||||
Majority | |||||
Turnout | |||||
Swing | |||||
Party | Candidate | Votes | % | ±% | |
---|---|---|---|---|---|
Conservative | John Stevenson | 23,659 | 55.2 | +5.3 | |
Labour | Ruth Alcroft | 15,340 | 35.8 | ―8.0 | |
Liberal Democrats | Julia Aglionby | 2,829 | 6.6 | +3.7 | |
UKIP | Fiona Mills | 1,045 | 2.4 | ―1.0 | |
Majority | 8,319 | 19.4 | +13.3 | ||
Turnout | 42,873 | 65.9 | ―3.2 | ||
Conservative hold | Swing | +6.7 | |||
This was the largest UKIP vote share at the 2019 general election. [42]
Party | Candidate | Votes | % | ±% | |
---|---|---|---|---|---|
Conservative | John Stevenson | 21,472 | 49.9 | +5.6 | |
Labour | Ruth Alcroft | 18,873 | 43.8 | +6.0 | |
UKIP | Fiona Mills | 1,455 | 3.4 | ―9.0 | |
Liberal Democrats | Peter Thornton | 1,256 | 2.9 | +0.3 | |
Majority | 2,599 | 6.1 | ―0.4 | ||
Turnout | 43,046 | 69.1 | +4.4 | ||
Conservative hold | Swing | ―0.2 | |||
Party | Candidate | Votes | % | ±% | |
---|---|---|---|---|---|
Conservative | John Stevenson | 18,873 | 44.3 | +5.0 | |
Labour | Lee Sherriff | 16,099 | 37.8 | +0.5 | |
UKIP | Fiona Mills | 5,277 | 12.4 | +10.1 | |
Green | Helen Davison | 1,125 | 2.6 | +1.1 | |
Liberal Democrats | Loraine Birchall | 1,087 | 2.6 | ―13.0 | |
Independent | Alfred Okam | 126 | 0.3 | New | |
Majority | 2,774 | 6.5 | +4.5 | ||
Turnout | 42,587 | 64.7 | 0.0 | ||
Conservative hold | Swing | +2.3 | |||
Party | Candidate | Votes | % | ±% | |
---|---|---|---|---|---|
Conservative | John Stevenson | 16,589 | 39.3 | +5.9 | |
Labour | Michael Boaden | 15,736 | 37.3 | ―9.6 | |
Liberal Democrats | Neil Hughes | 6,567 | 15.6 | ―1.0 | |
BNP | Paul Stafford | 1,086 | 2.6 | New | |
UKIP | Michael Owen | 969 | 2.3 | 0.0 | |
Green | John Reardon | 614 | 1.5 | New | |
TUSC | John Metcalfe | 376 | 0.9 | New | |
Independent | Peter Howe | 263 | 0.6 | New | |
Majority | 853 | 2.0 | N/A | ||
Turnout | 42,200 | 64.7 | +6.1 | ||
Conservative gain from Labour | Swing | +7.7 | |||
Party | Candidate | Votes | % | ±% | |
---|---|---|---|---|---|
Labour | Eric Martlew | 17,019 | 48.1 | ―3.1 | |
Conservative | Mike Mitchelson | 11,324 | 32.0 | ―2.8 | |
Liberal Democrats | Steven Tweedie | 5,916 | 16.7 | +5.0 | |
UKIP | Steven Cochrane | 792 | 2.2 | New | |
Legalise Cannabis | Lezley Gibson | 343 | 1.0 | ―0.6 | |
Majority | 5,695 | 16.1 | ―0.3 | ||
Turnout | 35,394 | 59.5 | +0.1 | ||
Labour hold | Swing | ―0.2 | |||
Party | Candidate | Votes | % | ±% | |
---|---|---|---|---|---|
Labour | Eric Martlew | 17,856 | 51.2 | ―6.2 | |
Conservative | Mike Mitchelson | 12,154 | 34.8 | +5.8 | |
Liberal Democrats | John Guest | 4,076 | 11.7 | +1.2 | |
Legalise Cannabis | Colin Paisley | 554 | 1.6 | New | |
Socialist Alliance | Paul Wilcox | 269 | 0.8 | New | |
Majority | 5,702 | 16.4 | ―12.0 | ||
Turnout | 34,909 | 59.4 | ―13.4 | ||
Labour hold | Swing | ―6.0 | |||
Party | Candidate | Votes | % | ±% | |
---|---|---|---|---|---|
Labour | Eric Martlew | 25,031 | 57.4 | +10.6 | |
Conservative | Richard T. Lawrence | 12,641 | 29.0 | ―10.7 | |
Liberal Democrats | Christopher A. Mayho | 4,576 | 10.5 | ―2.6 | |
Referendum | Angus J. Fraser | 1,233 | 2.8 | New | |
Natural Law | William A. Stevens | 126 | 0.3 | ―0.1 | |
Majority | 12,390 | 28.4 | +21.3 | ||
Turnout | 43,607 | 72.8 | ―6.6 | ||
Labour hold | Swing | +10.7 | |||
Party | Candidate | Votes | % | ±% | |
---|---|---|---|---|---|
Labour | Eric Martlew | 20,479 | 46.8 | +4.6 | |
Conservative | Clive W. Condie | 17,371 | 39.7 | ―0.4 | |
Liberal Democrats | Ralph E. Aldersey | 5,740 | 13.1 | ―4.6 | |
Natural Law | Nina E. Robinson | 190 | 0.4 | New | |
Majority | 3,108 | 7.1 | +5.0 | ||
Turnout | 43,780 | 79.4 | +0.6 | ||
Labour hold | Swing | +2.5 | |||
Party | Candidate | Votes | % | ±% | |
---|---|---|---|---|---|
Labour | Eric Martlew | 18,311 | 42.2 | +4.7 | |
Conservative | William Hodgson | 17,395 | 40.1 | +2.8 | |
SDP | Richard Hunt | 7,655 | 17.7 | ―7.5 | |
Majority | 916 | 2.1 | +1.9 | ||
Turnout | 43,359 | 78.8 | +2.4 | ||
Labour hold | Swing | ||||
Party | Candidate | Votes | % | ±% | |
---|---|---|---|---|---|
Labour | Ronald Lewis | 15,618 | 37.5 | ―12.2 | |
Conservative | Richard Sowler | 15,547 | 37.3 | ―1.8 | |
SDP | Richard Hunt | 10,471 | 25.2 | +14.0 | |
Majority | 71 | 0.2 | ―10.4 | ||
Turnout | 41,638 | 76.4 | ―3.6 | ||
Labour hold | Swing | ||||
Party | Candidate | Votes | % | ±% | |
---|---|---|---|---|---|
Labour | Ronald Lewis | 21,343 | 49.7 | ―1.5 | |
Conservative | D. Bloomer | 16,777 | 39.1 | +3.1 | |
Liberal | T. Potts | 4,829 | 11.2 | ―1.7 | |
Majority | 4,566 | 10.6 | ―4.6 | ||
Turnout | 42,951 | 80.0 | +1.2 | ||
Labour hold | Swing | ||||
Party | Candidate | Votes | % | ±% | |
---|---|---|---|---|---|
Labour | Ronald Lewis | 21,079 | 51.2 | ―4.0 | |
Conservative | D. Bloomer | 14,825 | 36.0 | ―7.3 | |
Liberal | F. Phillips | 5,306 | 12.9 | New | |
Majority | 6,254 | 15.2 | +3.3 | ||
Turnout | 41,211 | 78.8 | ―10.0 | ||
Labour hold | Swing | ||||
Party | Candidate | Votes | % | ±% | |
---|---|---|---|---|---|
Labour | Ronald Lewis | 23,119 | 55.2 | +2.0 | |
Conservative | E. M. White | 18,139 | 43.3 | ―3.5 | |
Independent Socialist | J. Wild | 628 | 1.5 | New | |
Majority | 4,980 | 11.9 | +5.5 | ||
Turnout | 41,887 | 88.8 | +10.2 | ||
Labour hold | Swing | ||||
Party | Candidate | Votes | % | ±% | |
---|---|---|---|---|---|
Labour | Ronald Lewis | 21,866 | 53.2 | ―2.9 | |
Conservative | B. A. Marsden | 19,241 | 46.8 | +2.9 | |
Majority | 2,625 | 6.4 | ―5.9 | ||
Turnout | 41,105 | 78.6 | ―4.9 | ||
Labour hold | Swing | ||||
Party | Candidate | Votes | % | ±% | |
---|---|---|---|---|---|
Labour | Ronald Lewis | 22,565 | 56.13 | ||
Conservative | Godfrey William Iredell | 17,638 | 43.87 | ||
Majority | 4,927 | 12.26 | |||
Turnout | 40,203 | 83.51 | |||
Labour hold | Swing | ||||
Party | Candidate | Votes | % | ±% | |
---|---|---|---|---|---|
Labour | Ronald Lewis | 19,169 | 45.6 | −2.0 | |
Conservative | Peter T. S. Boydell | 17,049 | 40.5 | −11.9 | |
Liberal | Brian G. Ashmore | 4,617 | 11.0 | New | |
Ind. Conservative | Donald Johnson | 1,227 | 2.9 | New | |
Majority | 2,120 | 5.1 | N/A | ||
Turnout | 42,062 | 85.6 | +1.0 | ||
Labour gain from Conservative | Swing | +4.9 | |||
Party | Candidate | Votes | % | ±% | |
---|---|---|---|---|---|
Conservative | Donald Johnson | 21,948 | 52.38 | ||
Labour | Alex Hargreaves | 19,950 | 47.62 | ||
Majority | 1,998 | 4.76 | |||
Turnout | 41,898 | 84.61 | |||
Conservative hold | Swing | ||||
Party | Candidate | Votes | % | ±% | |
---|---|---|---|---|---|
Conservative | Donald Johnson | 20,071 | 50.47 | ||
Labour | Alex Hargreaves | 19,701 | 49.53 | ||
Majority | 370 | 0.94 | N/A | ||
Turnout | 39,772 | 82.30 | |||
Conservative gain from Labour | Swing | ||||
Party | Candidate | Votes | % | ±% | |
---|---|---|---|---|---|
Labour | Alex Hargreaves | 19,648 | 46.8 | +0.3 | |
Conservative | Noel T. O'Reilly | 16,456 | 39.2 | +5.4 | |
Liberal | Doreen Gorsky | 5,886 | 14.0 | -5.6 | |
Majority | 3,192 | 7.6 | -5.1 | ||
Turnout | 41,990 | 87.4 | -1.1 | ||
Labour hold | Swing | ||||
Party | Candidate | Votes | % | ±% | |
---|---|---|---|---|---|
Labour | Alex Hargreaves | 19,031 | 46.50 | ||
Conservative | H. E. R. Peers | 13,850 | 33.84 | ||
Liberal | Godfrey William Iredell | 8,043 | 19.65 | ||
Majority | 5,181 | 12.66 | |||
Turnout | 40,924 | 88.49 | |||
Labour hold | Swing | ||||
Party | Candidate | Votes | % | ±% | |
---|---|---|---|---|---|
Labour | Edgar Grierson | 18,505 | 50.41 | ||
Conservative | Edward Spears | 13,356 | 36.39 | ||
Liberal | Godfrey William Iredell | 4,845 | 13.20 | ||
Majority | 5,149 | 14.02 | N/A | ||
Turnout | 36,706 | 79.20 | |||
Labour gain from Conservative | Swing | ||||
General election 1939–40: Another general election was required to take place before the end of 1940. The political parties had been making preparations for an election to take place and by the Autumn of 1939, the following candidates had been selected;
Party | Candidate | Votes | % | ±% | |
---|---|---|---|---|---|
Conservative | Edward Spears | 16,591 | 48.7 | −8.6 | |
Labour | Arnold Townend | 13,956 | 41.0 | +1.6 | |
Liberal | Barbara Bliss | 3,525 | 10.3 | New | |
Majority | 2,635 | 7.7 | −7.0 | ||
Turnout | 34,072 | 88.2 | +1.5 | ||
Conservative hold | Swing | −3.5 | |||
Party | Candidate | Votes | % | ±% | |
---|---|---|---|---|---|
Conservative | Edward Spears | 18,079 | 57.35 | ||
Labour | George Middleton | 13,445 | 42.65 | ||
Majority | 4,634 | 14.70 | N/A | ||
Turnout | 31,524 | 86.66 | |||
Conservative gain from Labour | Swing | ||||
Party | Candidate | Votes | % | ±% | |
---|---|---|---|---|---|
Labour | George Middleton | 12,779 | 40.4 | −5.1 | |
Unionist | Edward Spears | 10,362 | 32.8 | −21.7 | |
Liberal | Archibald Creighton | 8,484 | 26.8 | New | |
Majority | 2,417 | 7.6 | N/A | ||
Turnout | 31,625 | 90.4 | +1.3 | ||
Labour gain from Unionist | Swing | +8.3 | |||
Party | Candidate | Votes | % | ±% | |
---|---|---|---|---|---|
Unionist | William Watson | 12,787 | 54.5 | +15.2 | |
Labour | George Middleton | 10,676 | 45.5 | +5.0 | |
Majority | 2,111 | 9.0 | N/A | ||
Turnout | 23,463 | 89.1 | +1.3 | ||
Unionist gain from Labour | Swing | +5.1 | |||
Party | Candidate | Votes | % | ±% | |
---|---|---|---|---|---|
Labour | George Middleton | 9,120 | 40.5 | +2.9 | |
Unionist | William Watson | 8,844 | 39.3 | +8.0 | |
Liberal | Richard Denman | 4,541 | 20.2 | −11.5 | |
Majority | 276 | 1.2 | −5.1 | ||
Turnout | 17,964 | 87.8 | +3.8 | ||
Labour hold | Swing | −2.8 | |||
Party | Candidate | Votes | % | ±% | |
---|---|---|---|---|---|
Labour | George Middleton | 7,870 | 37.6 | +4.4 | |
Unionist | Claude Lowther | 6,569 | 31.3 | New | |
National Liberal | Theodore Carr | 6,526 | 31.1 | −35.7 | |
Majority | 1,301 | 6.3 | N/A | ||
Turnout | 20,965 | 84.0 | +22.2 | ||
Labour gain from Liberal | Swing | ||||
Party | Candidate | Votes | % | ±% | |
---|---|---|---|---|---|
C | Liberal | Theodore Carr | 9,511 | 66.8 | +16.3 |
Labour | Ernest Lowthian | 4,736 | 33.2 | New | |
Majority | 4,775 | 33.6 | +32.6 | ||
Turnout | 14,247 | 61.8 | −24.6 | ||
Liberal hold | Swing | N/A | |||
Cindicates candidate endorsed by the coalition government. |
A General Election was due to take place by the end of 1915. By the summer of 1914, the following candidates had been adopted to contest that election. Due to the outbreak of war, the election never took place.
Party | Candidate | Votes | % | ±% | |
---|---|---|---|---|---|
Liberal | Richard Denman | 3,243 | 50.5 | +2.8 | |
Conservative | Irwen W. Raymond | 3,179 | 49.5 | +8.5 | |
Majority | 64 | 1.0 | −5.7 | ||
Turnout | 6,422 | 86.4 | −5.9 | ||
Registered electors | 7,436 | ||||
Liberal hold | Swing | −2.9 | |||
Party | Candidate | Votes | % | ±% | |
---|---|---|---|---|---|
Liberal | Richard Denman | 3,270 | 47.7 | N/A | |
Conservative | Valentine John Hussey-Walsh | 2,815 | 41.0 | New | |
Social Democratic Federation | Charlie Bannington | 777 | 11.3 | New | |
Majority | 455 | 6.7 | N/A | ||
Turnout | 6,862 | 92.3 | N/A | ||
Registered electors | 7,436 | ||||
Liberal hold | Swing | N/A | |||
Party | Candidate | Votes | % | ±% | |
---|---|---|---|---|---|
Liberal | Frederick Chance | Unopposed | |||
Liberal hold | |||||
Party | Candidate | Votes | % | ±% | |
---|---|---|---|---|---|
Liberal | Frederick Chance | 3,616 | 58.3 | N/A | |
Conservative | Lancelot Sanderson | 2,586 | 41.7 | New | |
Majority | 1,030 | 16.6 | N/A | ||
Turnout | 6,202 | 84.4 | N/A | ||
Registered electors | 7,344 | ||||
Liberal hold | Swing | N/A | |||
Party | Candidate | Votes | % | ±% | |
---|---|---|---|---|---|
Speaker (Liberal) | William Gully | Unopposed | |||
Speaker hold | |||||
Party | Candidate | Votes | % | ±% | |
---|---|---|---|---|---|
Speaker (Liberal) | William Gully | 3,167 | 52.6 | +1.3 | |
Conservative | S. P. Foster | 2,853 | 47.4 | −1.3 | |
Majority | 314 | 5.2 | +2.6 | ||
Turnout | 6,020 | 88.6 | +2.8 | ||
Registered electors | 6,798 | ||||
Speaker hold | Swing | +1.3 | |||
Party | Candidate | Votes | % | ±% | |
---|---|---|---|---|---|
Liberal | William Gully | 2,729 | 51.3 | −1.9 | |
Conservative | S. P. Foster | 2,586 | 48.7 | +1.9 | |
Majority | 143 | 2.6 | −3.8 | ||
Turnout | 5,315 | 85.8 | +5.4 | ||
Registered electors | 6,195 | ||||
Liberal hold | Swing | −1.9 | |||
Party | Candidate | Votes | % | ±% | |
---|---|---|---|---|---|
Liberal | William Gully | 2,448 | 53.2 | N/A | |
Conservative | William George Frederick Cavendish Bentinck [70] | 2,155 | 46.8 | New | |
Majority | 293 | 6.4 | N/A | ||
Turnout | 4,603 | 80.4 | N/A | ||
Registered electors | 5,726 | ||||
Liberal hold | |||||
Party | Candidate | Votes | % | ±% | |
---|---|---|---|---|---|
Liberal | Robert Ferguson | Unopposed | |||
Liberal hold | |||||
Party | Candidate | Votes | % | ±% | |
---|---|---|---|---|---|
Liberal | Robert Ferguson | 2,802 | 37.6 | +8.9 | |
Liberal | Wilfrid Lawson | 2,691 | 36.1 | +8.7 | |
Conservative | Miles Walker Mattinson [74] | 1,968 | 26.4 | −17.5 | |
Majority | 723 | 9.7 | +5.5 | ||
Turnout | 4,770 (est) | 85.9 (est) | +6.0 | ||
Registered electors | 5,550 | ||||
Liberal hold | Swing | +8.8 | |||
Liberal hold | Swing | +8.7 | |||
Party | Candidate | Votes | % | ±% | |
---|---|---|---|---|---|
Liberal | Robert Ferguson | 2,154 | 28.7 | −3.9 | |
Liberal | Wilfrid Lawson | 2,051 | 27.4 | −6.4 | |
Conservative | William Farrer Ecroyd | 1,741 | 23.2 | +7.0 | |
Conservative | William Banks [75] | 1,551 | 20.7 | +4.5 | |
Majority | 310 | 4.2 | +2.8 | ||
Turnout | 3,749 (est) | 79.9 (est) | −9.0 | ||
Registered electors | 4,693 | ||||
Liberal hold | Swing | −5.5 | |||
Party | Candidate | Votes | % | ±% | |
---|---|---|---|---|---|
Liberal | Wilfrid Lawson | 2,043 | 33.8 | +1.4 | |
Liberal | Edmund Potter | 1,971 | 32.6 | −0.8 | |
Conservative | William Nicholson Hodgson | 1,957 | 32.4 | −1.7 | |
Independent Liberal | William Slater [76] | 71 | 1.2 | New | |
Majority | 86 | 1.4 | N/A | ||
Turnout | 4,035 (est) | 88.9 (est) | −4.0 | ||
Registered electors | 4,537 | ||||
Liberal hold | Swing | +1.1 | |||
Liberal gain from Conservative | Swing | +0.0 | |||
Party | Candidate | Votes | % | ±% | |
---|---|---|---|---|---|
Conservative | William Nicholson Hodgson | 616 | 34.1 | +3.0 | |
Liberal | Edmund Potter | 604 | 33.4 | −1.8 | |
Liberal | Wilfrid Lawson | 586 | 32.4 | −1.3 | |
Majority | 30 | 1.7 | N/A | ||
Turnout | 1,211 (est) | 92.9 (est) | +12.9 | ||
Registered electors | 1,304 | ||||
Conservative gain from Liberal | Swing | +3.1 | |||
Liberal hold | Swing | −1.7 | |||
Party | Candidate | Votes | % | ±% | |
---|---|---|---|---|---|
Liberal | Edmund Potter | 536 | 50.1 | −18.8 | |
Conservative | William Nicholson Hodgson | 533 | 49.9 | +18.8 | |
Majority | 3 | 0.2 | −2.4 | ||
Turnout | 1,069 | 89.5 | +9.5 | ||
Registered electors | 1,195 | ||||
Liberal hold | Swing | −18.8 | |||
Party | Candidate | Votes | % | ±% | |
---|---|---|---|---|---|
Liberal | James Graham | 538 | 35.2 | +1.7 | |
Liberal | Wilfrid Lawson | 516 | 33.7 | +2.4 | |
Conservative | William Nicholson Hodgson | 475 | 31.1 | −4.2 | |
Majority | 41 | 2.6 | +0.4 | ||
Turnout | 1,002 (est) | 80.0 (est) | −3.0 | ||
Registered electors | 1,253 | ||||
Liberal hold | Swing | +1.9 | |||
Liberal gain from Conservative | Swing | +2.3 | |||
Party | Candidate | Votes | % | ±% | |
---|---|---|---|---|---|
Conservative | William Nicholson Hodgson | 529 | 35.3 | +6.5 | |
Peelite | James Graham | 502 | 33.5 | −2.6 | |
Whig | Joseph Ferguson | 469 | 31.3 | −3.9 | |
Turnout | 1,015 (est) | 83.0 (est) | +0.3 | ||
Registered electors | 1,223 | ||||
Majority | 60 | 4.0 | N/A | ||
Conservative gain from Whig | Swing | +5.2 | |||
Majority | 33 | 2.2 | +1.3 | ||
Peelite hold | Swing | −2.9 | |||
Party | Candidate | Votes | % | ±% | |
---|---|---|---|---|---|
Peelite | James Graham | Unopposed | |||
Peelite hold | |||||
Party | Candidate | Votes | % | ±% | |
---|---|---|---|---|---|
Peelite | James Graham | 525 | 36.1 | N/A | |
Whig | Joseph Ferguson | 512 | 35.2 | −31.0 | |
Conservative | William Nicholson Hodgson | 419 | 28.8 | −5.1 | |
Turnout | 938 (est) | 82.7 (est) | −1.6 | ||
Registered electors | 1,134 | ||||
Majority | 106 | 7.3 | N/A | ||
Peelite gain from Conservative | Swing | N/A | |||
Majority | 93 | 6.4 | +5.8 | ||
Whig hold | Swing | −13.0 | |||
Party | Candidate | Votes | % | ±% | |
---|---|---|---|---|---|
Conservative | William Nicholson Hodgson | 477 | 37.4 | +3.5 | |
Whig | Philip Howard | 414 | 32.5 | +0.8 | |
Whig | John Dixon | 328 | 25.7 | −8.8 | |
Chartist | Peter Murray McDouall [77] | 55 | 4.3 | New | |
Turnout | 637 (est) | 59.7 (est) | −24.6 | ||
Registered electors | 1,067 | ||||
Majority | 63 | 4.9 | +2.7 | ||
Conservative hold | Swing | +3.8 | |||
Majority | 359 | 28.2 | +27.6 | ||
Whig hold | Swing | −0.5 | |||
Party | Candidate | Votes | % | ±% | |
---|---|---|---|---|---|
Whig | John Dixon | 479 | 34.5 | +2.0 | |
Conservative | William Nicholson Hodgson | 471 | 33.9 | +6.0 | |
Whig | Philip Howard | 440 | 31.7 | −7.8 | |
Turnout | 899 | 84.3 | −1.3 | ||
Registered electors | 1,054 | ||||
Majority | 8 | 0.6 | −4.0 | ||
Whig hold | Swing | −0.5 | |||
Majority | 31 | 2.2 | N/A | ||
Conservative gain from Whig | Swing | +5.9 | |||
Party | Candidate | Votes | % | ±% | |
---|---|---|---|---|---|
Whig | Philip Howard | 419 | 39.5 | N/A | |
Whig | William Marshall | 345 | 32.5 | N/A | |
Conservative | Edward Goulburn [79] | 296 | 27.9 | New | |
Majority | 49 | 4.6 | N/A | ||
Turnout | 643 | 85.6 | N/A | ||
Registered electors | 751 | ||||
Whig hold | Swing | N/A | |||
Party | Candidate | Votes | % | ±% | |
---|---|---|---|---|---|
Whig | Philip Howard | Unopposed | |||
Whig | William Marshall | Unopposed | |||
Registered electors | 1,012 | ||||
Whig hold | |||||
Whig hold | |||||
Party | Candidate | Votes | % | ±% | |
---|---|---|---|---|---|
Whig | Philip Howard | Unopposed | |||
Whig | William Marshall | Unopposed | |||
Registered electors | 946 | ||||
Whig hold | |||||
Whig gain from Radical |
Party | Candidate | Votes | % | ±% | |
---|---|---|---|---|---|
Radical | William James | 477 | 44.5 | +1.9 | |
Whig | Philip Howard | 472 | 44.0 | +1.4 | |
Tory | John Malcolm | 124 | 11.6 | −3.3 | |
Turnout | 646 | 66.1 | c. +51.1 | ||
Registered electors | 977 | ||||
Majority | 5 | 0.5 | +0.5 | ||
Radical hold | Swing | +1.8 | |||
Majority | 348 | 32.4 | +4.7 | ||
Whig hold | Swing | +1.5 | |||
Party | Candidate | Votes | % | ±% | |
---|---|---|---|---|---|
Radical | William James | 100 | 42.6 | N/A | |
Whig | Philip Howard | 100 | 42.6 | N/A | |
Tory | James Lushington | 35 | 14.9 | N/A | |
Turnout | c. 135 | c. 15% | N/A | ||
Registered electors | c. 900 | ||||
Majority | 0 | 0.0 | N/A | ||
Radical gain from Tory | Swing | N/A | |||
Majority | 65 | 27.7 | N/A | ||
Whig hold | Swing | N/A | |||
Party | Candidate | Votes | % | ±% | |
---|---|---|---|---|---|
Tory | James Lushington | Unopposed | |||
Whig | Philip Howard | Unopposed | |||
Tory hold | |||||
Whig hold | |||||
Election results taken from the History of Parliament Trust series.
Party | Candidate | Votes | % | ±% | |
---|---|---|---|---|---|
Non Partisan | Charles Howard | Unopposed | N/A | N/A | |
Whig | John Stanwix | Unopposed | N/A | N/A | |
Party | Candidate | Votes | % | ±% | |
---|---|---|---|---|---|
Whig | John Stanwix | N/A | N/A | N/A | |
Non Partisan | Richard Musgrave | N/A | N/A | N/A | |
Party | Candidate | Votes | % | ±% | |
---|---|---|---|---|---|
Non Partisan | Charles Howard | 109 | 38.11 | N/A | |
Whig | John Stanwix | 90 | 31.47 | N/A | |
Tory | John Hylton | 87 | 30.42 | N/A | |
Party | Candidate | Votes | % | ±% | |
---|---|---|---|---|---|
Non Partisan | Charles Howard | 354 | 37.82 | N/A | |
Tory | John Hylton | 351 | 37.50 | N/A | |
Non Partisan | Henry Aglionby | 231 | 24.68 | N/A | |
Party | Candidate | Votes | % | ±% | |
---|---|---|---|---|---|
Non Partisan | Charles Howard | Unopposed | N/A | N/A | |
Tory | John Hylton | Unopposed | N/A | N/A | |
Party | Candidate | Votes | % | ±% | |
---|---|---|---|---|---|
Non Partisan | Henry Aglionby | 398 | 37.65 | N/A | |
Tory | James Bateman | 350 | 33.11 | N/A | |
Whig | Thomas Stanwix | 309 | 29.23 | N/A | |
Party | Candidate | Votes | % | ±% | |
---|---|---|---|---|---|
Non Partisan | Henry Aglionby | 268 | 67.00 | N/A | |
Whig | Thomas Stanwix | 132 | 33.00 | N/A | |
Party | Candidate | Votes | % | ±% | |
---|---|---|---|---|---|
Whig | William Strickland | Unopposed | N/A | N/A | |
Whig | Thomas Stanwix | Unopposed | N/A | N/A | |
Carlisle is a cathedral city in the ceremonial county of Cumbria in England. It is the administrative centre of Cumberland Council which covers an area similar to the historic county of Cumberland.
The City of Carlisle was a local government district of Cumbria, England, with the status of a city. It was named after its largest settlement, Carlisle, but covered a far larger area which included the towns of Brampton and Longtown, as well as outlying villages including Dalston, Scotby and Wetheral. In 2011 the district had a population of 107,524, and an area of 1,039.97 square kilometres (402 sq mi).
Ilford North is a constituency created in 1945 and represented in the House of Commons of the UK Parliament since 2015 by Wes Streeting of the Labour Party.
A civil parish in England is the lowest unit of local government. There are 284 civil parishes in the ceremonial county of Cumbria, with most of the county being parished. At the 2001 census, there were 359,692 people living in those 284 parishes, accounting for 73.8 per cent of the county's population.
Orkney and Shetland is a constituency of the House of Commons of the Parliament of the United Kingdom. It elects one Member of Parliament (MP) by the first past the post system of election. In the Scottish Parliament, Orkney and Shetland are separate constituencies. The constituency was historically known as Orkney and Zetland.
Aldershot is a constituency in Hampshire represented in the House of Commons of the UK Parliament since 2017 by Leo Docherty, a Conservative.
Penrith and The Border is a constituency in Cumbria represented in the House of Commons of the UK Parliament since 2019 by Neil Hudson, a Conservative.
Wigan is a constituency in Greater Manchester, represented in the House of Commons of the UK Parliament since 2010 by Lisa Nandy of the Labour Party, who currently serves as the Shadow Cabinet Minister for International Development.
Erewash is a constituency in Derbyshire represented in the House of Commons of the UK Parliament since 2015 by Maggie Throup, a Conservative.
Lewisham East is a parliamentary constituency represented in the House of Commons of the UK Parliament since the by-election on 14 June 2018 by Janet Daby of the Labour Party.
Hackney South and Shoreditch is a constituency represented in the House of Commons of the UK Parliament since 2005 by Meg Hillier of Labour Co-op.
Hove is a borough constituency in East Sussex represented in the House of Commons of the UK Parliament since 2015 by Labour's Peter Kyle.
The 2006 Carlisle City Council election took place on 4 May 2006 to elect members of Carlisle District Council in Cumbria, England. One third of the council was up for election and the council stayed under no overall control.
The 2007 Carlisle City Council election took place on 3 May 2007 to elect members of Carlisle District Council in Cumbria, England. One third of the council was up for election and the council stayed under no overall control.
The 2008 Carlisle City Council election took place on 1 May 2008 to elect members of Carlisle District Council in Cumbria, England. One third of the council was up for election and the council stayed under no overall control.
The 2012 Carlisle City Council election took place on 3 May 2012 to elect members of Carlisle District Council in Cumbria, England. One third of the council was up for election and the Labour Party gained overall control of the council from no overall control.
The 2014 Carlisle City Council election took place on 22 May 2014 to elect members of Carlisle District Council in Cumbria, England. One third of the council was up for election and the Labour Party stayed in overall control of the council.
The 2019 Carlisle City Council election took place on 2 May 2019 to elect members of Carlisle City Council in England. This was on the same day as other local elections.
{{cite encyclopedia}}
: Missing or empty |title=
(help)(Subscription or UK public library membership required.)