Barrow and Furness | |
---|---|
County constituency for the House of Commons | |
County | Cumbria (Lancashire until 1974) |
Population | 88,826 (2011 census) [1] |
Electorate | 69,148 (December 2010) [2] |
Major settlements | Barrow-in-Furness, Ulverston, Dalton-in-Furness |
Current constituency | |
Created | 1885 |
Member of Parliament | Simon Fell (Conservative) |
Seats | One |
Created from | North Lancashire |
Barrow and Furness, formerly known as Barrow-in-Furness, is a constituency [n 1] in Cumbria which has been represented in the House of Commons of the UK Parliament by Simon Fell of the Conservative Party since 2019. [n 2]
The seat was established by the Redistribution of Seats Act 1885 and covers the southwest part of Cumbria. The largest town in the constituency, Barrow-in-Furness, grew on the back of the shipbuilding industry and is now the site of the BAE Systems nuclear submarine and shipbuilding operation. This reliance on the industry aligns many of its journalists and in its community with strong nuclear deterrents, from which Labour has recoiled since its involvement in the Iraq War that removed dictator Saddam Hussain. Labour Cabinet member Albert Booth represented Barrow for many years from 1966, but was defeated in 1983, in the aftermath of the Falklands War, by a Manchester lawyer, Cecil Franks of the Conservative Party, who retained the seat until 1992. Local media attributed this to widespread fears of job losses because the Labour Party was then signed up to doing away with all its nuclear capabilities including the submarines. [n 3]
As Labour revised its policies by favouring the retention of Britain's nuclear capability, and following massive job losses in the town's shipbuilding industry, Labour's fortunes revived in Barrow. John Hutton took the seat back for Labour in 1992 and retained it until the 2010 general election, when he was replaced by John Woodcock, also of Labour. In 2001, Hutton had the support of more than half of all those who voted. Other industries in the constituency currently include engineering and chemicals, and more than a quarter of all jobs are in manufacturing. The 2015 result gave the seat the 10th-smallest majority of Labour's 232 seats by percentage of majority. [3] In 2017, Woodcock's majority was reduced from 795 votes to 209 votes, the 16th smallest majority in the country. [4] Conservative, Simon Fell, took the seat in 2019 with a slightly greater margin than John Woodcock had when he first won the seat for Labour in 2010.
This constituency contains the southern half of the Furness peninsula, South Cumbria in the north-west of England.
1885–1918: The municipal borough of Barrow-in-Furness. [5]
1983–2010: The entire district of Barrow-in-Furness and the following wards from the District of South Lakeland: Low Furness, Pennington, Ulverston Central, Ulverston East, Ulverston North, Ulverston South and Ulverston West.
2010–present: The entire district of Barrow-in-Furness and the following wards from the District of South Lakeland: Broughton, Crake Valley, Low Furness & Swarthmoor, Ulverston Central, Ulverston East, Ulverston North, Ulverston South, Ulverston Town and Ulverston West.
Further to the 2023 Periodic Review of Westminster constituencies, enacted by the Parliamentary Constituencies Order 2023, from the next general election, due by January 2025, the constituency will be composed of the following (as they existed on 1 December 2020):
The constituency will be expanded to bring the electorate within the permitted range by transferring the (former) Copeland Borough wards of Black Combe & Scafell, and Millom from the (to be abolished) constituency of Copeland. The boundaries within the (former) District of South Lakeland are unchanged, with the revised contents reflecting a previous local government boundary review.
With effect from 1 April 2023, the second tier councils in Cumbria were abolished and replaced by the new unitary authorities of Cumberland, and Westmorland and Furness. [7] The constituency will therefore now comprise the following from the next general election:
Election | Member [9] | Party | |
---|---|---|---|
1885 | David Duncan | Liberal | |
1886 by-election | William Sproston Caine | Liberal | |
1886 | Liberal Unionist | ||
1890 by-election | James Duncan | Liberal | |
1892 | Charles Cayzer | Conservative | |
1906 | Charles Duncan | Labour | |
1918 | Robert Chadwick | Conservative | |
1922 | Daniel Somerville | Conservative | |
1924 | John Bromley | Labour | |
1931 | Jonah Walker-Smith | Conservative | |
1945 | Walter Monslow | Labour | |
1966 | Albert Booth | Labour | |
1983 | Constituency renamed "Barrow and Furness" | ||
Cecil Franks | Conservative | ||
1992 | John Hutton | Labour | |
2010 | John Woodcock | Labour Co-op | |
2018 | Independent | ||
2019 | Simon Fell | Conservative |
Party | Candidate | Votes | % | ±% | |
---|---|---|---|---|---|
Liberal | David Duncan | 2,958 | 53.1 | ||
Conservative | Henry Schneider | 2,612 | 46.9 | ||
Majority | 346 | 6.2 | |||
Turnout | 5,570 | 91.9 | |||
Registered electors | 6,063 | ||||
Liberal win (new seat) |
The election was declared void on petition, causing a by-election.
Party | Candidate | Votes | % | ±% | |
---|---|---|---|---|---|
Liberal | William Sproston Caine | 3,109 | 58.7 | 5.6 | |
Conservative | Gainsford Bruce | 2,174 | 41.0 | 5.9 | |
Independent Liberal | W H M Edmunds | 15 | 0.3 | New | |
Majority | 935 | 17.7 | 11.5 | ||
Turnout | 5,298 | 87.4 | 4.5 | ||
Registered electors | 6,063 | ||||
Liberal hold | Swing | 5.8 | |||
Party | Candidate | Votes | % | ±% | |
---|---|---|---|---|---|
Liberal Unionist | William Sproston Caine | 3,212 | 63.1 | 16.2 | |
Liberal | John Ainsworth | 1,882 | 36.9 | 16.2 | |
Majority | 1,330 | 26.2 | N/A | ||
Turnout | 5,094 | 84.0 | 7.9 | ||
Registered electors | 6,063 | ||||
Liberal Unionist gain from Liberal | Swing | 16.2 | |||
Party | Candidate | Votes | % | ±% | |
---|---|---|---|---|---|
Liberal | James Duncan | 1,944 | 38.2 | 1.3 | |
Conservative | Herbert Henry Wainwright | 1,862 | 36.6 | 26.5 | |
Independent Liberal | William Sproston Caine | 1,280 | 25.2 | New | |
Majority | 82 | 1.6 | N/A | ||
Turnout | 5,086 | 84.3 | 0.3 | ||
Registered electors | 6,034 | ||||
Liberal gain from Liberal Unionist | Swing | 13.9 | |||
Party | Candidate | Votes | % | ±% | |
---|---|---|---|---|---|
Conservative | Charles Cayzer | 3,312 | 53.4 | 9.7 | |
Liberal | James Duncan | 2,890 | 46.6 | 9.7 | |
Majority | 422 | 6.8 | 19.4 | ||
Turnout | 6,202 | 89.1 | 5.1 | ||
Registered electors | 6,958 | ||||
Conservative hold | Swing | 9.7 | |||
Party | Candidate | Votes | % | ±% | |
---|---|---|---|---|---|
Conservative | Charles Cayzer | 3,192 | 53.6 | 0.2 | |
Liberal | Womesh Chunder Bonnerjee | 2,355 | 39.5 | 7.1 | |
Ind. Labour Party | Pete Curran | 414 | 6.9 | New | |
Majority | 837 | 14.1 | 7.3 | ||
Turnout | 5,961 | 89.4 | 0.3 | ||
Registered electors | 6,665 | ||||
Conservative hold | Swing | 3.7 | |||
Party | Candidate | Votes | % | ±% | |
---|---|---|---|---|---|
Conservative | Charles Cayzer | Unopposed | |||
Conservative hold | |||||
Party | Candidate | Votes | % | ±% | |
---|---|---|---|---|---|
Labour Repr. Cmte. | Charles Duncan | 5,167 | 60.3 | New | |
Conservative | Charles Cayzer | 3,395 | 39.7 | N/A | |
Majority | 1,772 | 20.6 | N/A | ||
Turnout | 8,562 | 90.8 | N/A | ||
Registered electors | 9,426 | ||||
Labour Repr. Cmte. gain from Conservative | Swing | N/A | |||
Party | Candidate | Votes | % | ±% | |
---|---|---|---|---|---|
Labour | Charles Duncan | 5,304 | 55.2 | 5.1 | |
Conservative | Francis Hugo Lindley Meynell | 4,298 | 44.8 | 5.1 | |
Majority | 1,006 | 10.4 | 10.2 | ||
Turnout | 9,602 | 91.6 | 0.8 | ||
Registered electors | 10,478 | ||||
Labour hold | Swing | 5.1 | |||
Party | Candidate | Votes | % | ±% | |
---|---|---|---|---|---|
Labour | Charles Duncan | 4,810 | 52.9 | 2.3 | |
Conservative | Francis Hugo Lindley Meynell | 4,290 | 47.1 | 2.3 | |
Majority | 520 | 5.8 | 4.6 | ||
Turnout | 9,100 | 86.8 | 4.8 | ||
Registered electors | 10,478 | ||||
Labour hold | Swing | 2.3 | |||
General Election 1914–15:
Another General Election was required to take place before the end of 1915. The political parties had been making preparations for an election to take place and by July 1914, the following candidates had been selected;
Party | Candidate | Votes | % | ±% | |
---|---|---|---|---|---|
Unionist | Robert Burton-Chadwick | 12,608 | 50.6 | 3.5 | |
Labour | Charles Duncan | 12,309 | 49.4 | 3.5 | |
Majority | 299 | 1.2 | N/A | ||
Turnout | 24,917 | 66.1 | 20.7 | ||
Unionist gain from Labour | Swing | 3.5 | |||
Party | Candidate | Votes | % | ±% | |
---|---|---|---|---|---|
Unionist | Daniel Somerville | 16,478 | 53.1 | +2.5 | |
Labour | John Bromley | 14,551 | 46.9 | 2.5 | |
Majority | 1,927 | 6.2 | 5.0 | ||
Turnout | 31,299 | 87.1 | 21.0 | ||
Unionist hold | Swing | 2.5 | |||
Party | Candidate | Votes | % | ±% | |
---|---|---|---|---|---|
Unionist | Daniel Somerville | 13,996 | 47.5 | 5.6 | |
Labour | John Bromley | 13,576 | 46.0 | 0.9 | |
Liberal | William Hood Wandless | 1,931 | 6.5 | New | |
Majority | 420 | 1.5 | 4.7 | ||
Turnout | 29,503 | 86.3 | 0.8 | ||
Unionist hold | Swing | 2.3 | |||
Party | Candidate | Votes | % | ±% | |
---|---|---|---|---|---|
Labour | John Bromley | 15,512 | 51.2 | 5.2 | |
Unionist | Daniel Somerville | 14,802 | 48.8 | 1.3 | |
Majority | 710 | 2.4 | N/A | ||
Turnout | 30,314 | 89.9 | 3.6 | ||
Labour gain from Unionist | Swing | 1.9 | |||
Party | Candidate | Votes | % | ±% | |
---|---|---|---|---|---|
Labour | John Bromley | 19,798 | 56.0 | 4.8 | |
Unionist | Kenneth McDonald Cameron | 15,551 | 44.0 | 4.8 | |
Majority | 4,247 | 12.0 | 9.6 | ||
Turnout | 35,349 | 86.8 | 3.1 | ||
Labour hold | Swing | 4.8 | |||
Party | Candidate | Votes | % | ±% | |
---|---|---|---|---|---|
Conservative | Jonah Walker-Smith | 20,794 | 56.8 | 12.8 | |
Labour | David Adams | 15,835 | 43.2 | 12.8 | |
Majority | 4,959 | 13.4 | N/A | ||
Turnout | 36,629 | 88.9 | 2.1 | ||
Conservative gain from Labour | Swing | 12.8 | |||
Party | Candidate | Votes | % | ±% | |
---|---|---|---|---|---|
Conservative | Jonah Walker-Smith | 18,136 | 50.3 | 6.5 | |
Labour | Percy Barstow | 17,919 | 49.7 | 6.5 | |
Majority | 217 | 0.6 | 12.8 | ||
Turnout | 36,055 | 85.4 | 3.5 | ||
Conservative hold | Swing | 6.5 | |||
General Election 1939–40
Another General Election was required to take place before the end of 1940. The political parties had been making preparations for an election to take place and by the Autumn of 1939, the following candidates had been selected;
Party | Candidate | Votes | % | ±% | |
---|---|---|---|---|---|
Labour | Walter Monslow | 25,939 | 65.5 | 15.8 | |
Conservative | Jonah Walker-Smith | 13,648 | 34.5 | 15.8 | |
Majority | 12,291 | 31.0 | N/A | ||
Turnout | 39,587 | 79.7 | 5.7 | ||
Labour gain from Conservative | Swing | 15.8 | |||
Party | Candidate | Votes | % | ±% | |
---|---|---|---|---|---|
Labour | Walter Monslow | 26,342 | 56.27 | ||
Conservative | Wilfrid Sugden | 16,793 | 35.87 | ||
Liberal | Herbert Alexander Anderson Jardine | 3,678 | 7.86 | New | |
Majority | 9,549 | 20.40 | |||
Turnout | 46,813 | 87.83 | |||
Labour hold | Swing | ||||
Party | Candidate | Votes | % | ±% | |
---|---|---|---|---|---|
Labour | Walter Monslow | 26,709 | 56.91 | ||
Conservative | Kenneth F. Lawton | 20,225 | 43.09 | ||
Majority | 6,484 | 13.82 | |||
Turnout | 46,934 | 86.18 | |||
Labour hold | Swing | ||||
Party | Candidate | Votes | % | ±% | |
---|---|---|---|---|---|
Labour | Walter Monslow | 22,792 | 53.22 | ||
Conservative | Edward du Cann | 20,033 | 46.78 | ||
Majority | 2,759 | 6.44 | |||
Turnout | 42,825 | 80.69 | |||
Labour hold | Swing | ||||
Party | Candidate | Votes | % | ±% | |
---|---|---|---|---|---|
Labour | Walter Monslow | 23,194 | 54.68 | ||
Conservative | Malcolm Metcalf | 19,220 | 45.32 | ||
Majority | 3,974 | 9.36 | |||
Turnout | 42,414 | 81.72 | |||
Labour hold | Swing | ||||
Party | Candidate | Votes | % | ±% | |
---|---|---|---|---|---|
Labour | Walter Monslow | 22,197 | 55.13 | ||
Conservative | Peter Davies | 18,068 | 44.87 | ||
Majority | 4,129 | 10.26 | |||
Turnout | 40,265 | 78.03 | |||
Labour hold | Swing | ||||
Party | Candidate | Votes | % | ±% | |
---|---|---|---|---|---|
Labour | Albert Booth | 23,485 | 60.31 | ||
Conservative | Richard W. Rollins | 15,453 | 39.69 | ||
Majority | 8,032 | 20.62 | |||
Turnout | 38,938 | 76.78 | |||
Labour hold | Swing | ||||
Party | Candidate | Votes | % | ±% | |
---|---|---|---|---|---|
Labour | Albert Booth | 22,400 | 56.09 | ||
Conservative | Hal Miller | 17,536 | 43.91 | ||
Majority | 4,864 | 12.18 | |||
Turnout | 39,936 | 73.69 | |||
Labour hold | Swing | ||||
Party | Candidate | Votes | % | ±% | |
---|---|---|---|---|---|
Labour | Albert Booth | 19,925 | 46.11 | ||
Conservative | D.G.P. Bloomer | 14,818 | 34.29 | ||
Liberal | M. Benjamin | 8,470 | 19.60 | New | |
Majority | 5,107 | 11.82 | |||
Turnout | 43,213 | 79.97 | |||
Labour hold | Swing | ||||
Party | Candidate | Votes | % | ±% | |
---|---|---|---|---|---|
Labour | Albert Booth | 21,607 | 51.41 | ||
Conservative | Richard Cecil | 14,253 | 33.91 | ||
Liberal | M.A. Benjamin | 5,788 | 13.77 | ||
Independent | V. Moore | 384 | 0.91 | ||
Majority | 7,354 | 17.50 | |||
Turnout | 42,032 | 77.06 | |||
Labour hold | Swing | ||||
Party | Candidate | Votes | % | ±% | |
---|---|---|---|---|---|
Labour | Albert Booth | 22,687 | 53.24 | ||
Conservative | Patrick Thompson | 14,946 | 35.07 | ||
Liberal | G. Thompson | 4,983 | 11.69 | ||
Majority | 7,741 | 18.17 | |||
Turnout | 42,616 | 78.26 | |||
Labour hold | Swing | ||||
Party | Candidate | Votes | % | ±% | |
---|---|---|---|---|---|
Conservative | Cecil Franks | 22,284 | 43.6 | ||
Labour | Albert Booth | 17,707 | 34.7 | ||
SDP | David Cottier | 11,079 | 21.7 | New | |
Majority | 4,577 | 8.9 | N/A | ||
Turnout | 51,070 | 75.2 | |||
Conservative gain from Labour | Swing | ||||
Party | Candidate | Votes | % | ±% | |
---|---|---|---|---|---|
Conservative | Cecil Franks | 25,431 | 46.5 | 2.9 | |
Labour | Peter Phizacklea | 21,504 | 39.3 | 4.6 | |
SDP | Richard Phelps | 7,799 | 14.3 | 7.4 | |
Majority | 3,927 | 7.2 | 1.7 | ||
Turnout | 54,731 | 79.0 | 3.8 | ||
Conservative hold | Swing | 0.9 | |||
Party | Candidate | Votes | % | ±% | |
---|---|---|---|---|---|
Labour | John Hutton | 26,568 | 47.7 | 8.4 | |
Conservative | Cecil Franks | 22,990 | 41.3 | 5.2 | |
Liberal Democrats | Clive J. Crane | 6,089 | 10.9 | 3.4 | |
Majority | 3,578 | 6.4 | N/A | ||
Turnout | 55,647 | 82.0 | 3.0 | ||
Labour gain from Conservative | Swing | 6.8 | |||
Party | Candidate | Votes | % | ±% | |
---|---|---|---|---|---|
Labour | John Hutton | 27,630 | 57.3 | 9.6 | |
Conservative | Richard Hunt | 13,133 | 27.2 | 14.1 | |
Liberal Democrats | Anne A. Metcalfe | 4,264 | 8.8 | 2.1 | |
Independent | Jim Hamezeian | 1,995 | 4.1 | New | |
Referendum | David Y. Mitchell | 1,208 | 2.5 | New | |
Majority | 14,497 | 30.1 | 23.7 | ||
Turnout | 48,230 | 72.0 | 10.0 | ||
Labour hold | Swing | 11.9 | |||
Party | Candidate | Votes | % | ±% | |
---|---|---|---|---|---|
Labour | John Hutton | 21,724 | 55.7 | 1.6 | |
Conservative | James Airey | 11,835 | 30.3 | 3.1 | |
Liberal Democrats | Barry Rabone | 4,750 | 12.2 | 3.4 | |
UKIP | John Smith | 711 | 1.8 | New | |
Majority | 9,889 | 25.4 | 4.7 | ||
Turnout | 39,020 | 60.3 | 11.7 | ||
Labour hold | Swing | 2.4 | |||
Party | Candidate | Votes | % | ±% | |
---|---|---|---|---|---|
Labour | John Hutton | 17,360 | 47.6 | 8.1 | |
Conservative | William Dorman | 11,323 | 31.0 | 0.7 | |
Liberal Democrats | Barry Rabone | 6,130 | 16.8 | 4.6 | |
UKIP | Alan Beach | 758 | 2.1 | 0.3 | |
Build Duddon and Morecambe Bridges | Timothey Bell | 409 | 1.1 | New | |
Veritas | Brian Greaves | 306 | 0.8 | New | |
Independent | Helene Young | 207 | 0.6 | New | |
Majority | 6,037 | 16.6 | 8.8 | ||
Turnout | 36,493 | 59.0 | 1.3 | ||
Labour hold | Swing | 4.4 | |||
Party | Candidate | Votes | % | ±% | |
---|---|---|---|---|---|
Labour Co-op | John Woodcock | 21,226 | 48.1 | 2.9 | |
Conservative | John Gough | 16,018 | 36.3 | 3.7 | |
Liberal Democrats | Barry Rabone | 4,424 | 10.0 | 7.9 | |
UKIP | John Smith | 841 | 1.9 | 0.2 | |
BNP | Mike Ashburner | 840 | 1.9 | New | |
Green | Chris Loynes | 530 | 1.2 | New | |
Independent | Brian Greaves | 245 | 0.6 | New | |
Majority | 5,208 | 11.8 | 0.8 | ||
Turnout | 44,124 | 63.7 | 4.8 | ||
Labour hold | Swing | 0.4 | |||
Party | Candidate | Votes | % | ±% | |
---|---|---|---|---|---|
Labour Co-op | John Woodcock | 18,320 | 42.3 | 5.8 | |
Conservative | Simon Fell | 17,525 | 40.5 | 4.2 | |
UKIP | Nigel Cecil | 5,070 | 11.7 | 9.8 | |
Liberal Democrats | Clive Peaple | 1,169 | 2.7 | 7.3 | |
Green | Rob O'Hara | 1,061 | 2.5 | 1.3 | |
Independent | Ian Jackson | 130 | 0.3 | New | |
Majority | 795 | 1.8 | 10.0 | ||
Turnout | 43,275 | 63.3 | 0.4 | ||
Labour hold | Swing | 5.0 | |||
Party | Candidate | Votes | % | ±% | |
---|---|---|---|---|---|
Labour Co-op | John Woodcock | 22,592 | 47.5 | 5.2 | |
Conservative | Simon Fell | 22,383 | 47.0 | 6.5 | |
Liberal Democrats | Loraine Birchall | 1,278 | 2.7 | 0.0 | |
UKIP | Alan Piper | 962 | 2.0 | 9.7 | |
Green | Rob O'Hara | 375 | 0.8 | 1.7 | |
Majority | 209 | 0.5 | 1.3 | ||
Turnout | 47,590 | 68.5 | 5.2 | ||
Labour hold | Swing | 0.7 | |||
Party | Candidate | Votes | % | ±% | |
---|---|---|---|---|---|
Conservative | Simon Fell | 23,876 | 51.9 | 4.9 | |
Labour | Chris Altree | 18,087 | 39.3 | 8.2 | |
Liberal Democrats | Loraine Birchall | 2,025 | 4.4 | 1.7 | |
Brexit Party | Ged McGrath | 1,355 | 2.9 | New | |
Green | Chris Loynes | 703 | 1.5 | 0.7 | |
Majority | 5,789 | 12.6 | N/A | ||
Turnout | 46,046 | 65.8 | 2.7 | ||
Conservative gain from Labour | Swing | 6.5 | |||
Party | Candidate | Votes | % | ±% | |
---|---|---|---|---|---|
Labour | Michelle Scrogham [33] | ||||
Liberal Democrats | Adrian Waite [34] | ||||
Green | Lorraine Wrennall [35] | ||||
Majority | |||||
Turnout | |||||
Swing | |||||
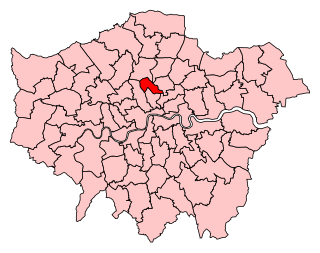
Islington North is a constituency in Greater London represented in the House of Commons of the UK Parliament since 1983 by Jeremy Corbyn, who was Leader of the Labour Party and Leader of the Opposition from 2015 to 2020.
Workington is a constituency in Cumbria represented in the House of Commons of the UK Parliament since 2019 by Mark Jenkinson, a Conservative.
South Dorset is a constituency represented in the House of Commons of the UK Parliament since 2010 by Richard Drax, a Conservative. The constituency was created as a consequence of the Redistribution of Seats Act 1885, although the area covered has changed since then.
Liverpool, West Derby is a constituency represented in the House of Commons of the UK Parliament since 2019 by Ian Byrne of the Labour Party.
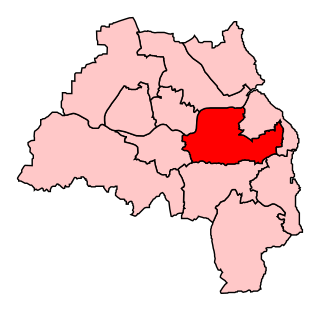
Chesterfield is a constituency represented in the House of Commons of the UK Parliament since 2010 by Toby Perkins of the Labour Party.
Copeland is a constituency in Cumbria created in 1983 and represented in the House of Commons of the UK Parliament. The constituency is represented in Parliament by Trudy Harrison, of the Conservative Party, since a by-election in February 2017. It was retained at the snap 2017 general election four months later. The seat had been held by Labour candidates at elections between 1983 and 2015 included.
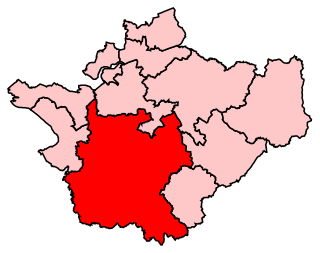
Eddisbury is a constituency in Cheshire represented in the House of Commons of the UK Parliament since 2019 by Edward Timpson, a Conservative.
Ellesmere Port and Neston is a constituency represented in the House of Commons of the UK Parliament since 2015 by Justin Madders of the Labour Party.
Morecambe and Lunesdale is a constituency represented in the House of Commons of the UK Parliament since 2010 by David Morris, a Conservative.
Westmorland and Lonsdale is a constituency in the south of Cumbria, represented in the House of Commons of the UK Parliament since 2005 by Tim Farron, the former leader of the Liberal Democrats (2015–2017).
Bootle is a constituency which has been represented in the House of Commons of the UK Parliament, since 2015 by Peter Dowd of the Labour Party.
Southport is a constituency in Merseyside which has been represented in the House of Commons of the UK Parliament since 2017 by Damien Moore of the Conservative Party.
Jarrow is a constituency represented in the House of Commons of the UK Parliament since 2019 by Kate Osborne of the Labour Party.
Leeds West is a borough constituency in the city of Leeds, West Yorkshire which is represented in the House of Commons of the Parliament of the United Kingdom. It elects one Member of Parliament (MP) by the first-past-the-post system of election. The current MP is Rachel Reeves of the Labour Party. With the exception of the Parliament of 1983–87, the seat has been held by Labour since 1945.
Leeds East is a constituency represented in the House of Commons of the UK Parliament since 2015 by Richard Burgon of the Labour Party.
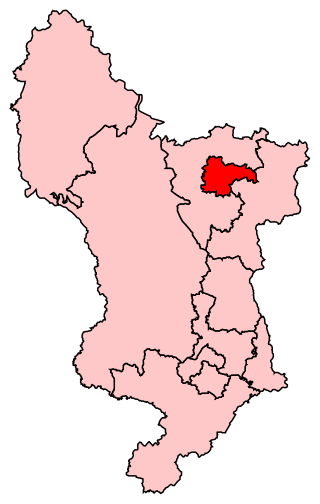
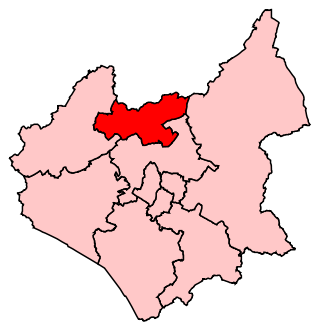
North East Derbyshire is a constituency created in 1885 represented in the House of Commons of the UK Parliament since 2017 by Lee Rowley of the Conservative Party. This was the first time a Conservative candidate had been elected since 1935.
Loughborough is a constituency in Leicestershire represented in the House of Commons of the UK Parliament since 2019 by Jane Hunt, a Conservative. From 2010 until 2019, it was represented by Nicky Morgan, who served in the governments of David Cameron and Boris Johnson. In 2020, she was elevated to the Peerage and became a member of the House of Lords. The constituency is a considered a bellwether, as it has reflected the national result at every general election since February 1974.
Tottenham is a constituency in Greater London represented in the House of Commons of the UK Parliament since 2000 by David Lammy of the Labour Party. Lammy has served as Shadow Secretary of State for Foreign, Commonwealth and Development Affairs since 2021 in the Shadow Cabinet of Keir Starmer, in which he previously served as Shadow Secretary of State for Justice and Shadow Lord Chancellor from 2020 to 2021. Tottenham was re-created as a parliamentary constituency in 1950, having previously existed from 1885 to 1918.