Liverpool Wavertree | |
---|---|
Borough constituency for the House of Commons | |
County | Merseyside |
Electorate | 63,876 (December 2019) [1] |
Major settlements | Broad Green, Edge Hill, Wavertree |
Current constituency | |
Created | 1997 |
Member of Parliament | Paula Barker (Labour) |
Seats | One |
Created from | Liverpool Broadgreen, Liverpool Mossley Hill |
1918–1983 | |
Seats | One |
Type of constituency | Borough constituency |
Created from | Liverpool East Toxteth and Liverpool Walton |
Replaced by | Liverpool Broadgreen, Liverpool Mossley Hill and Liverpool Garston [2] |
Liverpool Wavertree is a borough constituency of the Parliament of the United Kingdom. It was created in 1997 and every election since has been won by a Labour Party candidate.
An earlier constituency of the same name existed between 1918 and 1983, but lay further to the south-east, and was a predominantly Conservative seat.
1918–1950: The County Borough of Liverpool wards of Allerton, Childwall and Little Woolton, Garston, Much Woolton, Wavertree, and Wavertree West.
1950–1955: The County Borough of Liverpool wards of Old Swan, Wavertree, and Wavertree West. [3]
1955–1983: The County Borough of Liverpool wards of Broadgreen, Childwall, Church, and Old Swan. [4]
1997–2010: The City of Liverpool wards of Broadgreen, Childwall, Church, Kensington, Old Swan, and Picton.
2010–present: The City of Liverpool wards of Childwall, Church, Kensington and Fairfield, Old Swan, Picton, and Wavertree.
The constituency is one of five covering the city of Liverpool, and covers the localities in the eastern parts of the city such as Wavertree, Broadgreen, Childwall, Edge Hill, Kensington, Fairfield, part of Mossley Hill and Old Swan.
Further to the 2023 Periodic Review of Westminster constituencies, enacted by the Parliamentary Constituencies Order 2023, from the next general election, due by January 2025, the constituency will be composed of the following wards of the City of Liverpool (as they existed on 1 December 2020):
The constituency will be subject to significant change, with addition of the Greenbank, Mossley Hill and St Michael's wards from Liverpool Riverside, partly offset by the transfer of the Church ward to Liverpool Garston and the Old Swan ward to Liverpool West Derby.
Liverpool was subject to a comprehensive local government boundary review which came into effect in May 2023 [6] [7] . Accordingly, the proposed constituency boundaries no longer coincide with ward boundaries and the constituency will now comprise the following wards or part wards of the City of Liverpool from the next general election:
The present Liverpool Wavertree constituency dates from 1997. It contained parts of the former constituencies of Liverpool Broadgreen and Liverpool Mossley Hill. It was held by Jane Kennedy of the Labour Party from 1997 to 2010, who was also the former MP for Liverpool Broadgreen. At the 2005 general election, the Labour lead over the Liberal Democrats was cut from 38 points to 15 points. [9] At the 2010 general election, Jane Kennedy retired, and Luciana Berger was selected as the official Labour candidate, which caused some friction in the local CLP, especially due to her close connection with Kennedy. [10]
An earlier Liverpool Wavertree constituency existed until 1983; this was further to the south-east in the city and was predominantly a Conservative seat, occasionally with large majorities. It had been created in 1918, but a declining population in the 1970s caused it to be split between Liverpool Garston, the newly formed Liverpool Broadgreen and Liverpool Mossley Hill constituencies. While the Conservatives have fared badly in the new Wavertree constituency (polling under 7% at the 2005 general election), a direct comparison must take into account the differing boundaries since the 1997 recreation: [9] with more inner-city areas than its previous incarnation, the seat is home to constituents on a lower income than the average in the North West [11] and who are traditionally less sympathetic to Conservative policies. The 2015 general election result made the seat the seventh-safest of Labour's 232 seats by percentage of majority. [12]
At the 2010 general election, the Liberal Democrats' targeting of the seat led to a high turnout; [13] however, it was comfortably retained by Labour with a 2.1% swing away from the Liberal Democrats. The unexpected turnout led, unusually, to one polling station running out of ballot papers. [13]
Party | Candidate | Votes | % | ±% | |
---|---|---|---|---|---|
Labour | Paula Barker [15] | ||||
Reform UK | Adam Heatherington [16] | ||||
Liberal Democrats | Rob McAlister-Bell [17] | ||||
Independent | Ann San [18] | ||||
Majority | |||||
Turnout |
Party | Candidate | Votes | % | ±% | |
---|---|---|---|---|---|
Labour | Paula Barker | 31,310 | 72.2 | −7.3 | |
Conservative | Catherine Mulhern | 4,225 | 9.7 | −2.3 | |
Liberal Democrats | Richard Kemp | 4,055 | 9.3 | +2.8 | |
Brexit Party | Adam Heatherington | 1,921 | 4.4 | New | |
Green | Kay Inckle | 1,365 | 3.1 | +1.7 | |
Liberal | Mick Coyne | 501 | 1.2 | New | |
Majority | 27,085 | 62.5 | −5.0 | ||
Turnout | 43,377 | 68.4 | −1.7 | ||
Labour hold | Swing | −2.2 | |||
Party | Candidate | Votes | % | ±% | |
---|---|---|---|---|---|
Labour Co-op | Luciana Berger | 34,717 | 79.5 | +10.2 | |
Conservative | Denise Haddad | 5,251 | 12.0 | +2.0 | |
Liberal Democrats | Richard Kemp | 2,858 | 6.5 | +0.5 | |
Green | Ted Grant | 598 | 1.4 | −3.8 | |
Independent | Adam Heatherington | 216 | 0.5 | New | |
Majority | 29,466 | 67.5 | +8.2 | ||
Turnout | 43,640 | 70.1 | +3.7 | ||
Labour Co-op hold | Swing | +4.1 | |||
Party | Candidate | Votes | % | ±% | |
---|---|---|---|---|---|
Labour Co-op | Luciana Berger | 28,401 | 69.3 | +16.2 | |
Conservative | James Pearson | 4,098 | 10.0 | +2.5 | |
UKIP | Adam Heatherington | 3,375 | 8.2 | +5.9 | |
Liberal Democrats | Leo Evans | 2,454 | 6.0 | −28.2 | |
Green | Peter Cranie | 2,140 | 5.2 | +3.6 | |
TUSC | David Walsh | 362 | 0.9 | New | |
Independent | Niamh McCarthy | 144 | 0.4 | New | |
Majority | 24,303 | 59.3 | +40.4 | ||
Turnout | 40,974 | 66.4 | +5.8 | ||
Labour Co-op hold | Swing | +6.9 | |||
Party | Candidate | Votes | % | ±% | |
---|---|---|---|---|---|
Labour Co-op | Luciana Berger | 20,132 | 53.1 | +0.7 | |
Liberal Democrats | Colin Eldridge | 12,965 | 34.2 | −3.5 | |
Conservative | Andrew Garnett | 2,830 | 7.5 | +1.0 | |
UKIP | Neil Miney | 890 | 2.3 | +0.4 | |
Green | Rebecca Lawson | 598 | 1.6 | New | |
Socialist Labour | Kim Singleton | 200 | 0.5 | −0.2 | |
BNP | Steven McEllenborough | 150 | 0.4 | New | |
Independent | Franke Dunne | 149 | 0.4 | New | |
Majority | 7,167 | 18.9 | +4.2 | ||
Turnout | 37,914 | 60.6 | +12.8 | ||
Labour Co-op hold | Swing | +2.1 | |||
Party | Candidate | Votes | % | ±% | |
---|---|---|---|---|---|
Labour | Jane Kennedy | 18,441 | 52.4 | −10.3 | |
Liberal Democrats | Colin Eldridge | 13,268 | 37.7 | +13.3 | |
Conservative | Jason W. Steen | 2,331 | 6.6 | −3.0 | |
UKIP | Mark E. Bill | 660 | 1.9 | +0.8 | |
Socialist Labour | Gary Theys | 244 | 0.7 | −0.4 | |
Democratic Socialist Alliance | Paul Filby | 227 | 0.6 | −0.5 | |
Majority | 5,173 | 14.7 | −23.6 | ||
Turnout | 35,171 | 50.8 | +6.5 | ||
Labour hold | Swing | −11.8 | |||
Party | Candidate | Votes | % | ±% | |
---|---|---|---|---|---|
Labour | Jane Kennedy | 20,155 | 62.7 | −1.7 | |
Liberal Democrats | Christopher Newby | 7,836 | 24.4 | +2.9 | |
Conservative | Geoffrey Allen | 3,091 | 9.6 | −1.2 | |
Socialist Labour | Michael Lane | 359 | 1.1 | New | |
Socialist Alliance | Mark O'Brien | 349 | 1.1 | New | |
UKIP | Neil Miney | 348 | 1.1 | New | |
Majority | 12,319 | 38.3 | −4.6 | ||
Turnout | 32,138 | 44.3 | −18.4 | ||
Labour hold | Swing | −2.3 | |||
Party | Candidate | Votes | % | ±% | |
---|---|---|---|---|---|
Labour | Jane Kennedy | 29,592 | 64.4 | +23.1 | |
Liberal Democrats | Richard Kemp | 9,891 | 21.5 | −13.2 | |
Conservative | Kit Malthouse | 4,944 | 10.8 | −1.7 | |
Referendum | Peter A. Worthington | 576 | 1.3 | New | |
Liberal | Keith McCullough | 391 | 0.9 | New | |
ProLife Alliance | Racheal A. Kingsley | 346 | 0.8 | New | |
Workers Revolutionary | Carole Corkhill | 178 | 0.4 | New | |
Majority | 19,701 | 42.9 | N/A | ||
Turnout | 45,918 | 62.7 | N/A | ||
Labour win (new seat) |
Party | Candidate | Votes | % | ±% | |
---|---|---|---|---|---|
Conservative | Anthony Steen | 21,770 | 50.3 | +4.5 | |
Labour Co-op | Roy Morris | 14,828 | 34.2 | −5.0 | |
Liberal | C. W. Roberts | 6,705 | 15.5 | +0.5 | |
Majority | 6,942 | 15.9 | +9.2 | ||
Turnout | 43,303 | 73.4 | +4.1 | ||
Conservative hold | Swing | +4.8 | |||
Party | Candidate | Votes | % | ±% | |
---|---|---|---|---|---|
Conservative | Anthony Steen | 18,971 | 45.9 | +2.8 | |
Labour Co-op | Roy Morris | 16,216 | 39.2 | +8.1 | |
Liberal | Anthony Limont | 6,193 | 15.0 | −10.9 | |
Majority | 2,755 | 6.7 | |||
Turnout | 41,380 | 69.3 | −5.5 | ||
Conservative hold | Swing | −5.5 | |||
Party | Candidate | Votes | % | ±% | |
---|---|---|---|---|---|
Conservative | Anthony Steen | 19,027 | 43.0 | ||
Labour | Ian Levin | 13,752 | 31.1 | ||
Liberal | Cyril Carr | 11,450 | 25.9 | ||
Majority | 5,275 | 11.9 | |||
Turnout | 44,229 | 74.8 | |||
Conservative hold | Swing | ||||
Party | Candidate | Votes | % | ±% | |
---|---|---|---|---|---|
Conservative | John Tilney | 19,127 | 46.6 | −2.0 | |
Liberal | Cyril Carr | 11,650 | 28.4 | +11.3 | |
Labour | Gordon Woodburn | 10,253 | 25.0 | −9.3 | |
Majority | 7,477 | 18.2 | +3.9 | ||
Turnout | 41,030 | 69.2 | −0.9 | ||
Conservative hold | Swing | N/A | |||
Party | Candidate | Votes | % | ±% | |
---|---|---|---|---|---|
Conservative | John Tilney | 19,179 | 48.58 | ||
Labour | Robert Ashcroft | 13,529 | 34.27 | ||
Liberal | Cyril Carr | 6,771 | 17.15 | ||
Majority | 5,650 | 14.31 | |||
Turnout | 39,479 | 70.97 | |||
Conservative hold | Swing | ||||
Party | Candidate | Votes | % | ±% | |
---|---|---|---|---|---|
Conservative | John Tilney | 20,598 | 49.45 | ||
Labour | Stanley Thorne | 12,338 | 29.62 | ||
Liberal | Cyril Carr | 8,719 | 20.93 | ||
Majority | 8,260 | 19.83 | |||
Turnout | 41,655 | 73.74 | |||
Conservative hold | Swing | ||||
Party | Candidate | Votes | % | ±% | |
---|---|---|---|---|---|
Conservative | John Tilney | 26,624 | 63.12 | ||
Labour | Milicent Aspin | 10,392 | 24.64 | ||
Liberal | Tom Stuttard Rothwell | 5,161 | 12.24 | New | |
Majority | 16,232 | 38.48 | |||
Turnout | 42,177 | 75.75 | |||
Conservative hold | Swing | ||||
Party | Candidate | Votes | % | ±% | |
---|---|---|---|---|---|
Conservative | John Tilney | 28,172 | 69.18 | ||
Labour | Milicent Aspin | 12,552 | 30.82 | ||
Majority | 15,620 | 38.36 | |||
Turnout | 40,724 | 70.84 | |||
Conservative hold | Swing | ||||
Party | Candidate | Votes | % | ±% | |
---|---|---|---|---|---|
Conservative | John Tilney | 28,179 | 58.85 | ||
Labour | William Hamling | 19,702 | 41.15 | ||
Majority | 8,477 | 17.70 | |||
Turnout | 47,881 | 78.32 | |||
Conservative hold | Swing | ||||
Party | Candidate | Votes | % | ±% | |
---|---|---|---|---|---|
Conservative | John Tilney | 26,164 | 52.08 | ||
Labour | William Hamling | 18,559 | 36.94 | ||
Liberal | Thomas John Vernon Parry | 5,512 | 10.97 | ||
Majority | 7,605 | 15.14 | |||
Turnout | 50,235 | 82.42 | |||
Conservative hold | Swing | ||||
Party | Candidate | Votes | % | ±% | |
---|---|---|---|---|---|
Conservative | Victor Raikes | 25,470 | 48.2 | −10.3 | |
Labour | Derek Maurice Van Abbé | 20,249 | 38.4 | −3.1 | |
Liberal | Leslie Hall Storey | 7,063 | 13.4 | New | |
Majority | 5,221 | 9.8 | −7.2 | ||
Turnout | 52,782 | 73.1 | −0.1 | ||
Conservative hold | Swing | −3.6 | |||
A general election was planned for 1939–1940 but was postponed because of war. By the end of 1939, the following candidates had been selected;
Party | Candidate | Votes | % | ±% | |
---|---|---|---|---|---|
Conservative | Peter Stapleton Shaw | 26,915 | 58.5 | −19.4 | |
Labour | Joseph Cleary | 19,068 | 41.5 | +19.4 | |
Majority | 7,847 | 17.0 | N/A | ||
Turnout | 45,983 | 73.2 | −2.0 | ||
Conservative hold | Swing | −10.6 | |||
Party | Candidate | Votes | % | ±% | |
---|---|---|---|---|---|
Labour | Joseph Cleary | 15,611 | 35.3 | +13.2 | |
Conservative | James Platt | 13,711 | 31.2 | −46.7 | |
Ind. Conservative | Randolph Churchill | 10,575 | 23.9 | New | |
Liberal | Tudor Artro Morris | 4,208 | 9.5 | New | |
Majority | 1,840 | 4.1 | N/A | ||
Turnout | 44,165 | 72.3 | −2.9 | ||
Labour gain from Conservative | Swing | −30.0 | |||
Party | Candidate | Votes | % | ±% | |
---|---|---|---|---|---|
Conservative | Ronald Nall-Cain | 33,476 | 77.9 | +12.9 | |
Labour | Colin Clark | 9,504 | 22.1 | −12.9 | |
Majority | 23,972 | 55.8 | +25.8 | ||
Turnout | 42,980 | 75.2 | −3.9 | ||
Conservative hold | Swing | +12.9 | |||
Party | Candidate | Votes | % | ±% | |
---|---|---|---|---|---|
Conservative | Ronald Nall-Cain | 18,687 | 65.0 | +25.0 | |
Labour | Samuel Lewis Treleaven | 10,042 | 35.0 | +2.8 | |
Majority | 8,645 | 30.0 | +22.2 | ||
Turnout | 28,729 | 51.7 | −26.4 | ||
Conservative hold | Swing | +11.2 | |||
Party | Candidate | Votes | % | ±% | |
---|---|---|---|---|---|
Unionist | John Tinné | 16,880 | 40.0 | −7.4 | |
Labour | Samuel Lewis Treleaven | 13,585 | 32.2 | −2.8 | |
Liberal | Hugh Rathbone | 11,723 | 27.8 | +10.2 | |
Majority | 3,295 | 7.8 | −4.6 | ||
Turnout | 42,188 | 78.1 | −2.2 | ||
Registered electors | 53,989 | ||||
Unionist hold | Swing | −2.3 | |||
Party | Candidate | Votes | % | ±% | |
---|---|---|---|---|---|
Unionist | John Tinné | 14,063 | 47.4 | +12.7 | |
Labour | William Robinson | 10,383 | 35.0 | +7.0 | |
Liberal | Hugh Rathbone | 5,206 | 17.6 | −19.7 | |
Majority | 3,680 | 12.4 | N/A | ||
Turnout | 29,652 | 80.3 | +8.4 | ||
Registered electors | 36,936 | ||||
Unionist gain from Liberal | Swing | +16.2 | |||
Party | Candidate | Votes | % | ±% | |
---|---|---|---|---|---|
Liberal | Hugh Rathbone | 9,349 | 37.3 | New | |
Unionist | Harold Smith | 8,700 | 34.7 | −26.9 | |
Labour | James Vint Laughland | 7,025 | 28.0 | −10.4 | |
Majority | 649 | 2.6 | N/A | ||
Turnout | 25,074 | 71.9 | +2.4 | ||
Registered electors | 34,869 | ||||
Liberal gain from Unionist | Swing | N/A | |||
Party | Candidate | Votes | % | ±% | |
---|---|---|---|---|---|
Unionist | Harold Smith | 14,372 | 61.6 | +1.7 | |
Labour | James Vint Laughland | 8,941 | 38.4 | +11.4 | |
Majority | 5,431 | 23.2 | −9.7 | ||
Turnout | 23,313 | 69.5 | +9.0 | ||
Registered electors | 33,558 | ||||
Unionist hold | Swing | −4.9 | |||
Party | Candidate | Votes | % | ±% | |
---|---|---|---|---|---|
C | Unionist | Nathan Raw | 11,326 | 59.9 | |
Labour | Charles Wilson | 5,103 | 27.0 | ||
Liberal | Alfred Allen Booth | 2,484 | 13.1 | ||
Majority | 6,223 | 32.9 | |||
Turnout | 18,913 | 60.5 | |||
Registered electors | 31,262 | ||||
Unionist win (new seat) | |||||
Cindicates candidate endorsed by the coalition government. |
Childwall is a suburb and ward of Liverpool, England, located to the southeast of the city. It is bordered by Belle Vale, Bowring Park, Broadgreen, Gateacre, Mossley Hill, and Wavertree. In 2019, the population was 13,640.
Mossley Hill is a suburb of Liverpool and a Liverpool City Council ward. Located approximately 3.5 miles south east of Liverpool City Centre, it is bordered by Aigburth, Allerton, Childwall, Garston and Wavertree. At the 2001 Census, the population was 12,650, increasing to 13,816 at the 2011 Census.
Old Swan is an eastern neighbourhood of Liverpool, Merseyside, England, bordered by Knotty Ash, Stoneycroft, Broadgreen, Fairfield and Wavertree. At the 2011 Census, the population was 16,461.
Liverpool, West Derby is a constituency represented in the House of Commons of the UK Parliament since 2019 by Ian Byrne of the Labour Party.
Bootle is a constituency which has been represented in the House of Commons of the UK Parliament, since 2015 by Peter Dowd of the Labour Party.
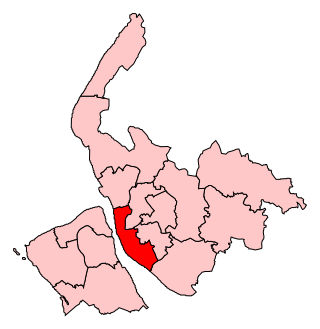
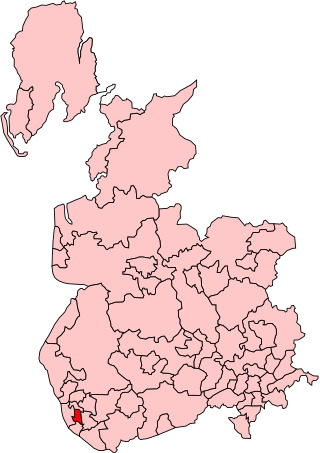
Liverpool Garston was a borough constituency represented in the House of Commons of the Parliament of the United Kingdom which existed from 1950 and 2010. It elected one Member of Parliament (MP) by the first past the post system of election.
Liverpool Riverside is a constituency represented in the House of Commons of the UK Parliament since 2019 by Kim Johnson, who is a member of the Labour Party.
Liverpool Edge Hill was a borough constituency within the city and metropolitan borough of Liverpool, in the English county of Merseyside, centred on Edge Hill. It returned one Member of Parliament (MP) to the House of Commons of the Parliament of the United Kingdom, elected by the first-past-the-post voting system.
Elections to Liverpool City Council were held on 4 May 2006. One third of the council was up for election and the Liberal Democrat party kept overall control of the council. Overall turnout was 25%.
Liverpool Broadgreen was a parliamentary constituency centred on the Broadgreen suburb of Liverpool. It returned one Member of Parliament (MP) to the House of Commons of the Parliament of the United Kingdom.
Elections to Liverpool City Council were held on 3 May 2007. One third of the council was up for election and the Liberal Democrat party kept overall control of the council. Overall turnout was 27.5%
Elections to Liverpool City Council were held on 1 May 2008. One third of the council was up for election.
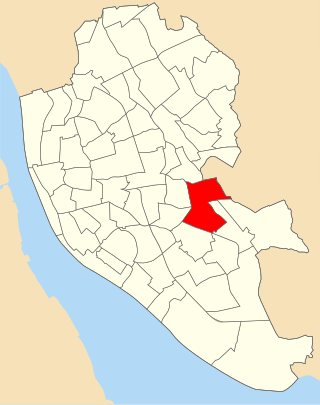
Childwall ward is an electoral district of Liverpool City Council within the Liverpool Wavertree and Garston and Halewood Parliamentary constituencies.
Elections to Liverpool City Council were held on 22 May 2014. The election date was delayed from the usual first Thursday in May to coincide with the European Parliament election. Due to the 'in thirds' system of election, one third of the council were up for election, with direct comparisons to previous results made with the corresponding vote at the 2010 Liverpool City Council election After the election, the composition of the council was:
The 2015 Liverpool City Council election took take place on 7 May 2015 to elect members of Liverpool City Council in England. This was on the same day as other local elections.
The 2018 Liverpool City Council election took place on 3 May 2018 to elect members of Liverpool City Council in England. This was on the same day as other local elections.
The 2019 Liverpool City Council election took place on 2 May 2019 to elect members of Liverpool City Council in England. This was the same day as other local elections.
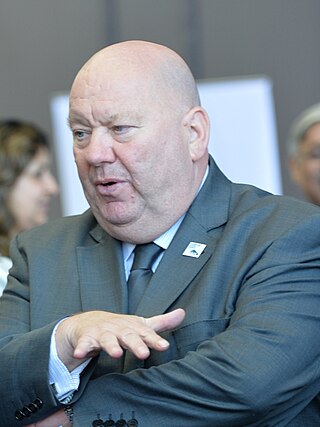
The 2023 Liverpool City Council election took place on 4 May 2023 to elect members of Liverpool City Council. Following a Boundary Review by The Local Government Boundary Commission for England, the size of the council was reduced from 90 to 85 seats with a change from three-member seats, elected in thirds, three years out of every four, following the British Government instigated Best Value Inspection Report which led to the appointment by the government of Commissioners and the subsequent boundary review for Council Wards in Liverpool which the government initiated with the proviso that the number of councillors be reduced and the predominant number of wards be reduced to single members with all-up elections every four years. The election also marked the end of Liverpool's directly-elected mayoralty. After the election the council reverted to having a leader of the council chosen from amongst the councillors instead. Labour retained control of the council and their group leader Liam Robinson became leader of the council after the election.