Blackburn (UK Parliament constituency)

Last updated

Blackburn
Borough constituency
for the House of Commons
Blackburn2007Constituency.svg
Boundary of Blackburn in Lancashire
EnglandLancashire.svg
Location of Lancashire within England
County Lancashire
Population107,246 (2011 census) [1]
Electorate 69,954 (December 2018) [2]
Major settlements Blackburn
Current constituency
Created 1955
Member of Parliament Kate Hollern (Labour)
SeatsOne
Created from Blackburn East and Blackburn West
18321950
SeatsTwo
Type of constituency Borough constituency
Created from Lancashire
Replaced by Blackburn East
Blackburn West

Blackburn is a constituency [n 1] in Lancashire, England, which has been represented in the House of Commons of the UK Parliament [n 2] since 2015 by Kate Hollern of the Labour Party. From 1979 to 2015, it was represented by Jack Straw who served under the Labour leaders of Neil Kinnock and John Smith and the Labour governments of Tony Blair and Gordon Brown.

Contents

Constituency profile

It has elected Labour MPs since its re-creation in 1955.

Boundaries

Blackburn (UK Parliament constituency)
Map of present boundaries

1832–1885: The township of Blackburn. [3]

1885–1918: The existing parliamentary borough, and so much of the municipal borough of Blackburn as was not already included in the parliamentary borough. [4]

1918–1950: the county borough of Blackburn. [5]

1955–1974: The county borough of Blackburn wards of Park, St. John's, St. Jude's, St. Luke's, St. Matthew's, St. Michael's, St. Paul's, St. Silas's, St. Stephen's, St. Thomas's and Trinity. [6]

The constituency encompasses the town of Blackburn in the North West of England. It borders four other constituencies: Ribble Valley to the north, Hyndburn to the east, Rossendale and Darwen to the south and Chorley to the west.

Following the review of parliamentary representation in Lancashire, including the unitary authority of Blackburn with Darwen in the run up to the 2010 United Kingdom general election the Boundary Commission for England made minor boundary changes to the existing constituency.

The electoral wards in the Blackburn seat fought at the UK general election in 2010 were entirely within the district of Blackburn with Darwen.

Proposed

Further to the 2023 Periodic Review of Westminster constituencies, enacted by the Parliamentary Constituencies Order 2023, from the next general election, due by January 2025, the constituency will be composed of the following wards of the Borough of Blackburn with Darwen (as they existed on 1 December 2020):

Minor changes to reflect changes to local authority ward structure.

History

For more details, see the Politics section of the Blackburn article.

Blackburn was first enfranchised by the Reform Act 1832, as a two-member constituency, and was first used at the 1832 general election. It was abolished for the 1950 general election, replaced by two single member constituencies, Blackburn East and Blackburn West.

Blackburn was re-established as a single-member constituency for the 1955 general election, partially replacing Blackburn East and Blackburn West. After its re-establishment, the constituency was initially a marginal, but Blackburn is now considered to be a Labour Party stronghold.

It has been represented by two prominent frontbenchers in the Cabinet: Barbara Castle, a First Secretary of State (amongst other roles) who stood down from this seat to become a Member of the European Parliament, and Jack Straw, who served as Home Secretary and then Foreign Secretary in the Blair government.

2005 general election

Blackburn's then MP, Straw, was primarily challenged in the 2005 general election by the Conservative Party, but the former British ambassador to Uzbekistan, Craig Murray, also stood for election in the seat as an Independent. Murray said: "I've been approached by several people in the Asian community who are under huge pressure from Labour activists [talking up the BNP's chances] to apply for a postal vote rather than a ballot vote and then hand their postal vote over to the Labour party." Over 50% more people used postal votes in the 2005 general election in Blackburn than in 2001. [8] The BNP had not stood in the previous two elections, but this time had a candidate, who polled 5.4% of the vote, and beat Murray to come fourth. Both were outperformed by the Liberal Democrats in third place, and the Conservatives, who remained second. Straw held on comfortably, albeit with a reduced majority; his winning share of 42% is the smallest since the seat became a single-member constituency.

2015 general election

In August 2011, Straw announced he had no plans to retire, despite hitting 65 earlier that month. [9]

On 25 October 2013, Straw announced that he would stand down as Blackburn's MP at the next election. [10] In March 2014, Kate Hollern was selected, via an all women shortlist, as the candidate for Labour for the 2015 general election, and held the seat.

Members of Parliament

Two-member constituency (1832–1950)

Election1st Member [11] 1st Party [12]

[13] [14]

2nd Member [11] 2nd Party
1832 William Feilden Whig [15] [16] [17] William Turner Whig [15] [18] [19]
1841 Conservative [15] [16] [17] John Hornby Conservative [15]
1847 James Pilkington Whig [20] [21] [22]
1852 William Eccles Radical [20]
1853 by-election Montague Joseph Feilden Whig [20]
1857 William Henry Hornby Conservative
1859 Liberal
1865 Joseph Feilden Conservative
1869 by-election Henry Feilden Conservative Edward Hornby Conservative
1874 William Edward Briggs Liberal
1875 by-election Daniel Thwaites Conservative
1880 Sir William Coddington Conservative
1885 Sir Robert Peel Conservative
1886 William Hornby Conservative
1906 Philip Snowden Labour
1910 Sir Thomas Barclay Liberal
1910 Sir Henry Norman Liberal
1918 Percy Dean Coalition Conservative Coalition Liberal
1922 Sir Sidney Henn Conservative National Liberal
1923 John Duckworth Liberal
1929 Thomas Gill Labour Mary Hamilton Labour
1931 Sir George Elliston Conservative Sir WD Smiles Conservative
1945 John Edwards Labour Barbara Castle Labour
1950 constituency abolished: see Blackburn East and Blackburn West

Single member constituency (1955–present)

ElectionMember [11] Party
1955 constituency re-established
1955 Barbara Castle Labour
1979 Jack Straw Labour
2015 Independent
2015 Kate Hollern Labour

Elections

Blackburn election results since 1955. Blackburn Election Results.png
Blackburn election results since 1955.

Elections in the 2020s

Next general election: Blackburn
PartyCandidateVotes%±%
Labour Kate Hollern [23]
Liberal Democrats Adam Waller-Slack [24]
SDP Paul Topping [25]
Workers Party Craig Murray [26]
Majority
Turnout

Elections in the 2010s

General election 2019: Blackburn [27]
PartyCandidateVotes%±%
Labour Kate Hollern 29,040 64.9 ―4.9
Conservative Claire Gill10,73624.0―2.9
Brexit Party Rick Moore2,7706.2New
Liberal Democrats Beth Waller-Slack1,1302.5+1.0
Green Reza Hossain7411.7New
Independent Rizwan Shah3190.7New
Majority18,30440.9―2.0
Turnout 44,73662.8―4.4
Labour hold Swing ―1.0
General election 2017: Blackburn [28]
PartyCandidateVotes%±%
Labour Kate Hollern 33,148 69.8 +13.5
Conservative Bob Eastwood12,78026.9―0.4
Independent Duncan Miller8751.8New
Liberal Democrats Irfan Ahmed7091.5―0.7
Majority20,36842.9+13.9
Turnout 47,51267.2+7.1
Labour hold Swing +6.9
General election 2015: Blackburn [28]
PartyCandidateVotes%±%
Labour Kate Hollern 24,762 56.3 +8.5
Conservative Bob Eastwood12,00227.3+1.2
UKIP Dayle Taylor6,28014.3+12.2
Liberal Democrats Gordon Lishman 9552.2―13.0
Majority12,76029.0+8.3
Turnout 43,99960.1―1.8
Labour hold Swing +3.7
General election 2010: Blackburn [28]
PartyCandidateVotes%±%
Labour Jack Straw 21,751 47.8 +5.7
Conservative Michael Law-Riding11,89526.1+3.5
Liberal Democrats Paul English6,91815.2―5.4
BNP Robin Evans2,1584.7―0.7
Independent Bushra Irfan1,4243.1New
UKIP Bobby Anwar9422.1―0.2
Independent Grace Astley2380.5New
Independent Janis Sharp 1730.4New
Majority9,85621.7+2.2
Turnout 45,49962.9+5.2
Labour hold Swing +1.1

Elections in the 2000s

General election 2005: Blackburn [28]
PartyCandidateVotes%±%
Labour Jack Straw 17,562 42.0 ―12.1
Conservative Imtiaz Ameen9,55322.9―8.3
Liberal Democrats Tony Melia8,60820.6+12.5
BNP Nicholas Holt2,2635.4New
Independent Craig Murray 2,0825.0New
UKIP Dorothy Baxter9542.3―0.6
Green Graham Carter7831.9New
Majority8,00919.1―3.8
Turnout 41,80556.9+1.4
Labour hold Swing ―1.4
General election 2001: Blackburn [28]
PartyCandidateVotes%±%
Labour Jack Straw 21,808 54.1 ―0.9
Conservative John Cotton12,55931.2+6.6
Liberal Democrats Imtiaz Patel3,2648.1―2.4
UKIP Dorothy Baxter1,1852.9New
Socialist Labour Terry Cullen5591.4+0.1
Socialist Alliance Jim Nichol5321.3New
Independent Paul Morris3770.9New
Majority9,24922.9―7.5
Turnout 40,28455.5―9.5
Labour hold Swing ―2.9

Elections in the 1990s

General election 1997: Blackburn [28]
PartyCandidateVotes%±%
Labour Jack Straw 26,141 55.0 +6.6
Conservative Geeta Sidhu Robb11,69024.6―12.9
Liberal Democrats Stephen Fenn4,99010.5―1.0
Referendum David Bradshaw1,8924.0New
National Democrats Tina Wingfield6711.4New
Socialist Labour Helen Drummond6351.3New
Green Robin Field6081.3―0.3
Keep Britain Free and Independent PartyMargo Carmichael-Grimshaw5061.1New
Common Sense Sick of PoliticiansJohn Batchelor3620.8New
Majority14,45130.4+19.5
Turnout 47,49565.0―10.1
Labour hold Swing +9.7
General election 1992: Blackburn [28]
PartyCandidateVotes%±%
Labour Jack Straw 26,633 48.4 ―1.5
Conservative Ross M. Coates20,60637.5―2.6
Liberal Democrats Derek Mann6,33211.5+1.5
Green Robin Field8781.6New
Lodestar PartyMargo Carmichael-Grimshaw3340.6New
Natural Law William Ayliffe1950.4New
Majority6,02710.9+1.1
Turnout 54,97875.1+0.2
Labour hold Swing +0.6

Elections in the 1980s

General election 1987: Blackburn [28]
PartyCandidateVotes%±%
Labour Jack Straw 27,965 49.9 +5.2
Conservative Anne Cheetham22,46840.1+0.7
SDP Mohammed Ali5,60210.0―4.4
Majority5,4979.8+4.5
Turnout 56,03574.9+0.3
Labour hold Swing +2.3
General election 1983: Blackburn [28]
PartyCandidateVotes%±%
Labour Jack Straw 25,400 44.7 ―6.0
Conservative Graham Mather 22,34539.4+2.8
SDP Eric B. Fairbrother8,17414.4+2.7
National Front David A. Riley8641.50.0
Majority3,0555.3―8.8
Turnout 56,78474.6+0.5
Labour hold Swing ―4.4

Elections in the 1970s

General election 1979: Blackburn [28]
PartyCandidateVotes%±%
Labour Jack Straw 19,683 50.7 ―0.8
Conservative Ian D. McGaw14,19336.6+4.5
Liberal Frank J. Beetham4,37111.3―0.7
National Front Edward Adamson5651.5―3.0
Majority5,49014.1―5.3
Turnout 38,81374.0+1.1
Labour hold Swing ―2.6
General election October 1974: Blackburn [28]
PartyCandidateVotes%±%
Labour Barbara Castle 20,344 51.5 +3.1
Conservative Ian D. McGaw12,69232.1―1.3
Liberal Frank J. Beetham4,74112.0―2.0
National Front John Kingsley Read 1,7584.5+0.3
Majority7,65219.4+4.4
Turnout 39,53772.9―6.4
Labour hold Swing +2.2
General election February 1974: Blackburn [28]
PartyCandidateVotes%±%
Labour Barbara Castle 20,340 48.4 ―4.8
Conservative Ian D. McGaw14,04033.4―13.4
Liberal Frank J. Beetham5,89114.0New
National Front John Kingsley Read 1,7784.2New
Majority6,30015.0+8.6
Turnout 42,04978.3+2.8
Labour hold Swing +4.3
General election 1970: Blackburn [28]
PartyCandidateVotes%±%
Labour Barbara Castle 22,473 53.2 ―6.1
Conservative Trixie Gardner 19,73746.8+6.1
Majority2,7366.4―10.2
Turnout 42,21075.5―3.7
Labour hold Swing ―6.1

Elections in the 1960s

General election 1966: Blackburn [28]
PartyCandidateVotes%±%
Labour Barbara Castle 25,381 58.3 +0.8
Conservative Thomas Marsden18,13341.7―0.8
Majority7,24816.6+1.6
Turnout 43,51479.2―1.8
Labour hold Swing +1.6
General election 1964: Blackburn [28]
PartyCandidateVotes%±%
Labour Barbara Castle 26,543 57.5 +4.7
Conservative John Maurice Armstrong Yerburgh19,65042.5―4.7
Majority6,89315.0+9.4
Turnout 46,19381.0―4.9
Labour hold Swing +4.7

Elections in the 1950s

General election 1959: Blackburn [28]
PartyCandidateVotes%±%
Labour Barbara Castle 27,356 52.8 +2.3
Conservative John Maurice Armstrong Yerburgh24,49047.2―2.3
Majority2,8665.6+4.6
Turnout 51,84685.9+2.8
Labour hold Swing +2.3
General election 1955: Blackburn [28]
PartyCandidateVotes%±%
Labour Barbara Castle 26,241 50.5
Conservative Thomas Marsden25,75249.5
Majority4891.0
Turnout 51,99383.1
Labour win (new seat)

Back to elections

Elections in the 1940s

General election 1945: Blackburn
PartyCandidateVotes%±%
Labour John Edwards 35,182 26.0 +2.1
Labour Barbara Castle 35,145 26.0 +2.2
Conservative Douglas Glover 26,32519.5-6.7
Conservative Robert Goulborne Parker25,80719.1-7.0
Liberal Robert Shackleton 6,5874.9New
Liberal Marjorie Annie Macinerney6,0964.5New
Turnout 135,14282.6-2.3
Majority8,8576.5N/A
Labour gain from Conservative Swing
Majority9,3386.9N/A
Labour gain from Conservative Swing

General Election 1939–40: Another General Election was required to take place before the end of 1940. The political parties had been making preparations for an election to take place from 1939 and by the end of this year, the following candidates had been selected;

Back to elections

Elections in the 1930s

General election 1935: Blackburn
PartyCandidateVotes%±%
Conservative George Elliston 37,932 26.2 -6.9
Conservative W. D. Smiles 37,769 26.1 -7.0
Labour James Bell 34,57123.9+6.9
Labour George Walker 34,42323.8+7.2
Turnout 144,69584.9-2.5
Majority3,5092.4-13.2
Conservative hold Swing
Majority3,1982.2-13.9
Conservative hold Swing
General election 1931: Blackburn
PartyCandidateVotes%±%
Conservative W. D. Smiles 50,105 33.2
Conservative George Elliston 49,953 33.1
Labour Mary Hamilton 25,64317.0
Labour Thomas Gill 25,03016.6
Turnout 150,55187.4
Majority25,07515.6N/A
Conservative gain from Labour Swing
Majority24,92316.1N/A
Conservative gain from Labour Swing

Back to elections

Elections in the 1920s

General election 1929: Blackburn (2 seats)
PartyCandidateVotes%±%
Labour Mary Hamilton 37,256 26.1 +4.3
Labour Thomas Gill 35,723 25.0 +3.2
Unionist Sydney Henn 35,24924.7-3.4
Liberal Gerald Isaacs 34,50424.2-4.1
Turnout 142,73287.8-0.4
Majority2,7521.9N/A
Majority4740.3N/A
Labour gain from Unionist Swing
Labour gain from Liberal Swing
General election 1924: Blackburn (2 seats)
PartyCandidateVotes%±%
Liberal John Duckworth 31,612 28.3 -0.8
Conservative Sydney Henn 31,347 28.1 +1.5
Labour Mary Hamilton 24,33021.8-2.0
Labour Thomas Gill 24,31721.8+1.3
Turnout 111,60688.2+3.2
Majority7,0176.3+0.2
Unionist hold Swing
Majority7,2956.5+1.2
Liberal hold Swing
General election 1923: Blackburn (2 seats)
PartyCandidateVotes%±%
Liberal John Duckworth 31,117 29.1 -5.3
Unionist Sydney Henn 28,505 26.6 +1.1
Labour John Davies 25,42823.8+2.1
Labour Edward Porter 21,90320.5-0.6
Turnout 106,95385.0-3.4
Majority6,6026.1+2.8
Unionist hold Swing
Majority5,6895.3+1.5
Liberal hold Swing
General election 1922: Blackburn (2 seats)
PartyCandidateVotes%±%
Unionist Sydney Henn 28,280 25.5 -13.4
National Liberal Henry Norman 27,071 24.4 -17.0
Labour John Davies 24,04921.7
Labour Edward Porter 23,40221.1
Liberal Thomas Meech 8,1417.3N/A
Turnout 110,94388.4+13.6
Majority3,6693.3-15.9
Unionist hold Swing
Majority4,2313.8-17.9
National Liberal hold Swing

Back to elections

Elections in the 1910s

Henry Norman 1917 Sir Henry Norman.jpg
Henry Norman
General election 1918: Blackburn
PartyCandidateVotes%±%
C Liberal Henry Norman 32,07641.4+15.1
C Unionist Percy Dean 30,15838.98.4
Labour Philip Snowden 15,27419.76.7
Turnout 77,51074.817.6
Majority14,88419.2N/A
Unionist gain from Labour Swing 0.9
Majority16,80221.7+19.4
Liberal hold Swing +11.8
Cindicates candidate endorsed by the coalition government.
General election December 1910: Blackburn (two seats) [29]
PartyCandidateVotes%±%
Labour Philip Snowden 10,762 26.4 1.7
Liberal Henry Norman 10,754 26.3 2.1
Conservative W.B. Boyd-Carpenter9,81424.0+2.0
Conservative H.L. Riley9,50023.3+1.8
Turnout 40,83092.43.6
Registered electors 22,572
Majority9482.43.7
Labour hold Swing 1.9
Majority9402.34.1
Liberal hold Swing 2.1
General election January 1910: Blackburn (two seats) [29]
PartyCandidateVotes%±%
Liberal Henry Norman 12,064 28.4 +4.8
Labour Philip Snowden 11,916 28.1 +1.4
Conservative Robert Cecil 9,30722.04.8
Conservative G.F.S. Bowles9,11221.51.8
Turnout 42,39996.0+0.6
Registered electors 22,572
Majority2,7576.4N/A
Liberal gain from Conservative Swing +4.9
Majority2,6096.1+2.7
Labour hold Swing +1.6

Back to elections

Elections in the 1900s

General election 1906: Blackburn (two seats) [29]
PartyCandidateVotes%±%
Conservative Harry Hornby 10,291 26.8 13.7
Labour Repr. Cmte. Philip Snowden 10,282 26.7 +2.1
Conservative Geoffrey Drage 8,93223.310.6
Liberal Edwin Hamer [30] 8,89223.2New
Turnout 38,39795.4+9.6
Registered electors 21,127
Majority1,3993.64.9
Conservative hold Swing +4.9
Majority1,3503.4N/A
Labour Repr. Cmte. gain from Conservative Swing +6.4
General election 1900: Blackburn (two seats) [29]
PartyCandidateVotes%±%
Conservative Harry Hornby 11,247 40.5 +3.1
Conservative William Coddington 9,415 33.9 1.9
Labour Repr. Cmte. Philip Snowden 7,09625.6New
Turnout 27,75885.81.8
Registered electors 19,496
Majority2,3198.30.7
Conservative hold Swing N/A

Back to elections

Elections in the 1890s

General election 1895: Blackburn (two seats) [29]
PartyCandidateVotes%±%
Conservative Harry Hornby 9,553 37.4 +8.6
Conservative William Coddington 9,150 35.8 +7.8
Liberal Thomas Ritzema6,84026.816.4
Turnout 25,54387.64.5
Registered electors 18,275
Majority2,3109.0+3.5
Conservative hold Swing +12.5
Conservative hold Swing +12.1
General election 1892: Blackburn (two seats) [29]
PartyCandidateVotes%±%
Conservative Harry Hornby 9,265 28.8 N/A
Conservative William Coddington 9,046 28.0 N/A
Liberal W. Taylor7,27222.5New
Liberal Eli Heyworth [31] 6,69420.7New
Turnout 32,27792.1N/A
Registered electors 17,661
Majority1,7745.5N/A
Conservative hold Swing N/A

Back to elections

Elections in the 1880s

General election 1886: Blackburn (two seats) [32]
PartyCandidateVotes%±%
Conservative William Coddington Unopposed
Conservative Harry Hornby Unopposed
Conservative hold
Conservative hold
Coddington William Coddington.jpg
Coddington
Briggs W-e-briggs-in-1880.jpg
Briggs
General election 1885: Blackburn (two seats) [32] [33] [34]
PartyCandidateVotes%±%
Conservative William Coddington 9,168 30.9 +5.5
Conservative Robert Peel 8,425 28.4 +3.5
Liberal William Edward Briggs 6,74022.73.3
Liberal James Nuttall Boothman [35] 5,34118.05.6
Majority1,6855.7N/A
Turnout 15,65695.9+2.5 (est)
Registered electors 16,329
Conservative hold Swing +5.6
Conservative gain from Liberal Swing +3.4
General election 1880: Blackburn (two seats) [36]
PartyCandidateVotes%±%
Liberal William Edward Briggs 6,349 26.0 +0.6
Conservative William Coddington 6,207 25.4 0.9
Conservative Daniel Thwaites 6,08824.90.4
Liberal George Molesworth 5,76023.6+0.5
Turnout 12,202 (est)93.4 (est)0.6
Registered electors 13,062
Majority2611.1+1.0
Liberal hold Swing +0.5
Majority4471.8+0.9
Conservative hold Swing 0.7

Back to elections

Elections in the 1870s

By-election, 2 Oct 1875 [37] [36]
PartyCandidateVotes%±%
Conservative Daniel Thwaites 5,792 54.5 +2.9
Liberal J. T. Hibbert [38] 4,83245.53.0
Majority9609.0+8.1
Turnout 10,62490.63.4
Registered electors 11,721
Conservative hold Swing +3.0
General election 1874: Blackburn [36]
PartyCandidateVotes%±%
Conservative Henry Feilden 5,532 26.3 0.1
Liberal William Edward Briggs 5,338 25.4 +1.4
Conservative Daniel Thwaites 5,32325.31.5
Liberal Richard Shackleton [39] 4,85123.1+0.3
Turnout 10,522 (est)94.0 (est)5.6
Registered electors 11,195
Majority1940.91.5
Conservative hold Swing 0.2
Majority150.1N/A
Liberal gain from Conservative Swing +1.5

Back to elections

Elections in the 1860s

By-election, 30 March 1869: Blackburn [36] [40]
PartyCandidateVotes%±%
Conservative Edward Hornby 4,738 27.5 +0.7
Conservative Henry Feilden 4,697 27.3 +0.9
Liberal John Gerald Potter 3,96423.01.0
Liberal John Morley 3,80422.10.7
Majority7334.3+1.9
Turnout 8,602 (est)93.7 (est)5.9
Registered electors 9,183
Conservative hold Swing +0.9
Conservative hold Swing +0.8
General election, 1868: Blackburn [36]
PartyCandidateVotes%±%
Conservative William Hornby 4,907 26.8 5.0
Conservative Joseph Feilden 4,826 26.4 1.9
Liberal John Gerald Potter 4,39924.0+6.6
Liberal Montague Joseph Feilden 4,16422.8+0.3
Majority4272.43.4
Turnout 9,148 (est)99.6 (est)+12.2
Registered electors 9,183
Conservative hold Swing 5.8
Conservative hold Swing 1.1
General election, 1865: Blackburn [36]
PartyCandidateVotes%±%
Conservative William Hornby 1,053 31.8
Conservative Joseph Feilden 938 28.3
Liberal James Pilkington 74422.5
Liberal John Gerald Potter 57717.4
Majority1945.8+2.0
Turnout 1,656 (est)87.4 (est)-4.8
Registered electors 1,894
Conservative hold Swing
Conservative gain from Liberal Swing

Back to elections

Elections in the 1850s

General election, 1859: Blackburn [36]
PartyCandidateVotes%±%
Conservative William Hornby 832 38.7 N/A
Liberal James Pilkington 750 34.9 N/A
Liberal John Patrick Murrough [42] 56726.4N/A
Majority823.8N/A
Turnout 1,491 (est)92.2 (est)N/A
Registered electors 1,617
Conservative hold Swing N/A
Liberal hold Swing N/A
General election, 1857: Blackburn [36]
PartyCandidateVotes%±%
Conservative William Hornby Unopposed
Whig James Pilkington Unopposed
Registered electors 1,518
Conservative gain from Radical
Whig hold
By-election, 24 March 1853: Blackburn [36]
PartyCandidateVotes%±%
Whig Montague Joseph Feilden 631 52.4 +8.7
Conservative William Hornby 57447.6+21.3
Majority574.8-8.9
Turnout 1,20590.9+14.0
Registered electors 1,325
Whig gain from Radical Swing 6.3
General election, 1852: Blackburn [36]
PartyCandidateVotes%±%
Whig James Pilkington 846 43.7 +8.4
Radical William Eccles 580 30.0 +26.0
Conservative John Hornby 50926.311.3
Turnout 968 (est)76.9 (est)+0.9
Registered electors 1,258
Majority26613.717.6
Whig hold Swing +7.0
Majority713.7N/A
Radical gain from Conservative Swing +15.8

Back to elections

Elections in the 1840s

General election, 1847: Blackburn [36]
PartyCandidateVotes%±%
Conservative John Hornby 641 37.6 28.5
Whig James Pilkington 602 35.3 +18.8
Whig William Hargreaves [44] [45] 39223.0+6.5
Chartist William Prowting Roberts [46] 684.0New
Turnout 852 (est)76.0 (est)12.9
Registered electors 1,121
Majority392.3+2.2
Conservative hold Swing 26.9
Majority53431.3N/A
Whig gain from Conservative Swing +16.5
General election, 1841: Blackburn [36] [15]
PartyCandidateVotes%±%
Conservative William Feilden 441 34.1 New
Conservative John Hornby 427 33.0 New
Whig William Turner 42632.921.9
Turnout 80588.9+18.9
Registered electors 906
Majority151.2N/A
Conservative gain from Whig Swing 20.7
Majority10.1N/A
Conservative gain from Whig Swing 11.3

Back to elections

Elections in the 1830s

General election, 1837: Blackburn [36] [15]
PartyCandidateVotes%±%
Whig William Turner 515 54.8 +13.7
Whig William Feilden 416 44.3 +14.2
Radical John Benjamin Smith 91.027.8
Turnout 58970.011.2
Registered electors 842
Majority9910.50.5
Whig hold Swing +13.8
Majority40743.3+42.0
Whig hold Swing +14.1
General election, 1835: Blackburn [36] [15]
PartyCandidateVotes%±%
Whig William Turner 432 41.1 +8.3
Whig William Feilden 316 30.1 5.5
Radical John Bowring 30328.82.8
Turnout 61881.215.8
Registered electors 761
Majority11611.0+9.8
Whig hold Swing +4.9
Majority131.31.5
Whig hold Swing 2.1
General election, 1832: Blackburn [36] [15]
PartyCandidateVotes%±%
Whig William Feilden 376 35.6
Whig William Turner 346 32.8
Radical John Bowring 33431.6
Turnout 60797.0
Registered electors 626
Majority302.8
Whig win (new seat)
Majority121.2
Whig win (new seat)

Back to elections

See also

Notes

  1. A borough constituency (for the purposes of election expenses and type of returning officer)
  2. As with all constituencies, the constituency elects one Member of Parliament (MP) by the first past the post system of election at least every five years.

Related Research Articles

<span class="mw-page-title-main">Burnley (UK Parliament constituency)</span> UK Parliament constituency in England since 1868

Burnley is a constituency centred on the town of Burnley in Lancashire which has been represented since 2019 by Antony Higginbotham, a Conservative.

<span class="mw-page-title-main">Preston (UK Parliament constituency)</span> Parliamentary constituency in the United Kingdom, 1983 onwards

Preston is a constituency represented in the House of Commons of the UK Parliament since 2000 by Sir Mark Hendrick, a member of the Labour Party and Co-operative Party.

<span class="mw-page-title-main">Ashton-under-Lyne (UK Parliament constituency)</span> Parliamentary constituency in the United Kingdom, 1832 onwards

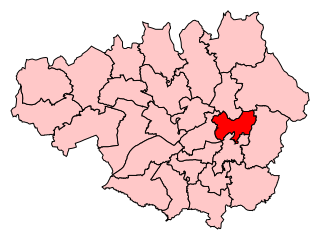
Ashton-under-Lyne is a constituency in the House of Commons of the UK Parliament. It has been represented since 2015 by Angela Rayner, who has served as Deputy Leader of the Labour Party since 2020.

<span class="mw-page-title-main">Tynemouth (UK Parliament constituency)</span> Parliamentary constituency in the United Kingdom, 1885 onwards

Tynemouth is a constituency in Tyne and Wear represented in the House of Commons of the UK Parliament since 1997 by Sir Alan Campbell, a member of the Labour Party.

<span class="mw-page-title-main">Reigate (UK Parliament constituency)</span> United Kingdom parliamentary constituency

Reigate is a constituency in Surrey represented in the House of Commons of the UK Parliament since 1997 by Crispin Blunt, originally of the Conservative Party, but as of October 2023, sitting as an Independent, after having the whip suspended.

Greenock was a burgh constituency represented in the House of Commons of the Parliament of the United Kingdom from 1832 until 1974, when it was abolished and its area was merged into the new Greenock and Port Glasgow constituency.

<span class="mw-page-title-main">Lancaster (UK Parliament constituency)</span> Parliamentary constituency in the United Kingdom, 1885–1997

Lancaster was a constituency of the House of Commons of the Parliament of England then of the Parliament of Great Britain from 1707 to 1800 and of the Parliament of the United Kingdom from 1801 to 1867, centred on the historic city of Lancaster in north-west England. It was represented by two Members of Parliament until the constituency was disenfranchised for corruption in 1867.

<span class="mw-page-title-main">Accrington (UK Parliament constituency)</span> Parliamentary constituency in the United Kingdom, 1885–1983

Accrington was a parliamentary constituency of the House of Commons of the Parliament of the United Kingdom from 1885 to 1983. It elected one Member of Parliament (MP) by the first-past-the-post system of election.

Sunderland was a borough constituency in the House of Commons of the United Kingdom, created by the Reform Act 1832 for the 1832 general election. It elected two Members of Parliament (MPs) by the bloc vote system of election. It was split into the single-member seats of Sunderland North and Sunderland South for the 1950 general election.

The parliamentary borough of Finsbury was a constituency of the House of Commons of the UK Parliament from 1832 to 1885, and from 1918 to 1950. The constituency was first created in 1832 as one of seven two-seat "metropolis" parliamentary boroughs other than the two which already existed: Westminster and the City of London; the latter until 1885 retained an exceptional four seats. Finsbury was directly north of the City of London and was smaller than the Finsbury division of the Ossulstone hundred but took in land of Holborn division to its southwest in pre-introduction changes by Boundary Commissioners. It included Finsbury, Holborn, Moorfields, Clerkenwell, Islington, Stoke Newington and historic St Pancras. The 1918 constituency corresponded to the smaller Metropolitan Borough of Finsbury ; it was a seat, thus electing a single member, fulfilling a longstanding aim of Chartism which underscored the 1832 reforms.

<span class="mw-page-title-main">Warrington (UK Parliament constituency)</span> Parliamentary constituency in the United Kingdom, 1832–1983

Warrington was a parliamentary constituency in the United Kingdom. From 1832 to 1983 it returned one Member of Parliament (MP) to the House of Commons of the Parliament of the United Kingdom.

Shrewsbury was a parliamentary constituency in England, centred on the town of Shrewsbury in Shropshire.

<span class="mw-page-title-main">Isle of Thanet (UK Parliament constituency)</span>

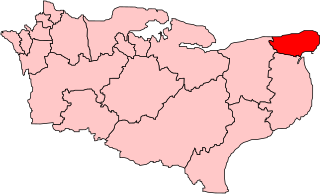
Isle of Thanet was a county constituency which returned one Member of Parliament (MP) to the House of Commons of the Parliament of the United Kingdom from 1885, until it was abolished for the February 1974 general election.

<span class="mw-page-title-main">Darwen (UK Parliament constituency)</span> Parliamentary constituency in the United Kingdom, 1885–1983

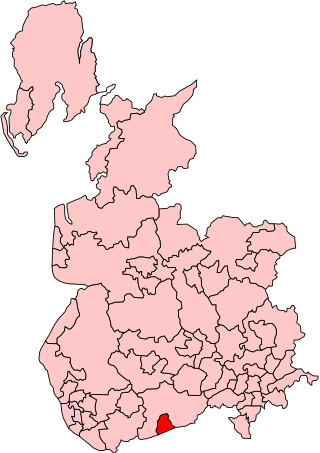
Darwen was a county constituency in Lancashire, centred on the town of Darwen. It returned one Member of Parliament to the House of Commons of the Parliament of the United Kingdom from 1885 until it was abolished for the 1983 general election.

<span class="mw-page-title-main">Clitheroe (UK Parliament constituency)</span> Parliamentary constituency in the United Kingdom, 1832–1983

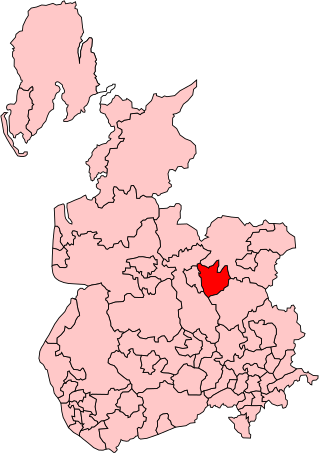
Clitheroe was a parliamentary constituency in Lancashire.

The Hartlepools was a borough constituency represented in the House of Commons of the UK Parliament. The constituency became Hartlepool in 1974. The seat's name reflected the representation of both old Hartlepool and West Hartlepool.

Hertford was the name of a parliamentary constituency in Hertfordshire, which elected Members of Parliament (MPs) from 1298 until 1974.

Blackpool was a parliamentary constituency centred on the town of Blackpool in Lancashire. It returned one Member of Parliament (MP) to the House of Commons of the Parliament of the United Kingdom.

Bury was a borough constituency centred on the town of Bury in Lancashire. It returned one Member of Parliament (MP) to the House of Commons of the Parliament of the United Kingdom.

Oldham was a parliamentary constituency centred on the town of Oldham, England. It returned two Members of Parliament (MPs) to the House of Commons of the Parliament of the United Kingdom. The constituency was created by the Great Reform Act of 1832 and was abolished for the 1950 general election when it was split into the Oldham East and Oldham West constituencies.

References

  1. "Blackburn: Usual Resident Population, 2011". Neighbourhood Statistics. Office for National Statistics. Retrieved 31 January 2015.
  2. England Parliamentary electorates Boundary Commission for England]
  3. "The statutes of the United Kingdom of Great Britain and Ireland. 2 & 3 William IV. Cap. LXIV. An Act to settle and describe the Divisions of Counties, and the Limits of Cities and Boroughs, in England and Wales, in so far as respects the Election of Members to serve in Parliament". London: His Majesty's statute and law printers. 1832. pp. 300–383. Retrieved 23 May 2020.
  4. "Chap. 23. Redistribution of Seats Act, 1885". The Public General Acts of the United Kingdom passed in the forty-eighth and forty-ninth years of the reign of Queen Victoria. London: Eyre and Spottiswoode. 1885. pp.  111–198.
  5. Mayer, Sylvain (1918). Representation of the People Act 1918 and the Redistribution of Seats (Ireland) Act 1918. London: Waterlow and Sons Limited. p. 152.
  6. "The Parliamentary Constituencies (Blackburn, Chorley and Darwen) Order 1955", legislation.gov.uk , The National Archives, 5 January 1955, SI 1955/14, retrieved 6 February 2022
  7. "The Parliamentary Constituencies Order 2023". Schedule 1 Part 5 North West region.
  8. Could the election be won by fraud?, Robert Winnett and Abul Taher, The Sunday Times , 10 April 2005
  9. "Jack Straw has no plans to retire despite hitting 65". Lancashire Telegraph. 14 August 2011. Retrieved 5 August 2016.
  10. "Jack Straw to step down as Labour MP for Blackburn". BBC News. 25 October 2013. Retrieved 25 October 2013.
  11. 1 2 3 Leigh Rayment's Historical List of MPs – Constituencies beginning with "B" (part 3)
  12. Craig, FWS (1989) [1977]. British parliamentary election results 1832–1885 (2nd ed.). Chichester: Parliamentary Research Services. pp. 49–50. ISBN   0-900178-26-4.
  13. Craig, FWS (1989) [1974]. British parliamentary election results 1885–1918 (2nd ed.). Chichester: Parliamentary Research Services. p. 76. ISBN   0-900178-27-2.
  14. Craig, FWS (1983) [1969]. British parliamentary election results 1918–1949 (3rd ed.). Chichester: Parliamentary Research Services. p. 92. ISBN   0-900178-06-X.
  15. 1 2 3 4 5 6 7 8 Stooks Smith, Henry. (1973) [1844-1850]. Craig, FWS (ed.). The parliaments of England, from 1715 to 1847 (2nd ed.). Chichester: Parliamentary Research Services. pp.  175–176. ISBN   0-900178-13-2 via Archive.org.
  16. 1 2 Churton, Edward (1838). The Assembled Commons or Parliamentary Biographer: 1838. p. 88.
  17. 1 2 Dutton, HI; King, JE (1981). Ten Per Cent and No Surrender: The Preston Strike 1853–1854. Cambridge: Cambridge University Press. p. 92. ISBN   0-521-23620-7.
  18. "Scandal gripped the nation". Lancashire Telegraph. 19 June 2003. Retrieved 27 October 2018.
  19. Lewis, Brian (2001). The Middlemost and the Milltowns: Bourgeois Culture and Politics in Early Industrial England. Stanford: Stanford University Press. p. 544. ISBN   0-8047-4174-3.
  20. 1 2 3 Pink, William Dumcombe; Beavan, Alfred B. (1889). The Parliamentary Representation of Lancashire (County and Borough) 1258-1885 with Biographical and Genealogical Notices of the Members. London: Henry Gray. p. 317. Retrieved 14 April 2018.
  21. "The General Election". The Spectator. 31 July 1847. p. 2. Retrieved 14 April 2018.(subscription required)
  22. "The Diary of Charles Tiplady". Cotton Town. Retrieved 14 April 2018.
  23. "Ex-Hyndburn MP and veteran Rossendale councillor chosen by Labour". Lancashire Telegraph. Retrieved 31 January 2024.
  24. "Liberal Democrat Prospective Parliamentary Candidates". Mark Pack . Retrieved 31 January 2024.
  25. "GENERAL ELECTION CANDIDATES". SDP . Retrieved 31 January 2024.
  26. "Craig Murray selected for Blackburn". Workers Party of Britain . Retrieved 21 March 2024.
  27. "Blackburn Parliamentary constituency". BBC News. BBC. Retrieved 24 November 2019.
  28. 1 2 3 4 5 6 7 8 9 10 11 12 13 14 15 16 17 "Blackburn parliamentary constituency". BBC News.
  29. 1 2 3 4 5 6 Craig, FWS, ed. (1974). British Parliamentary Election Results: 1885-1918. London: Macmillan Press. ISBN   9781349022984.
  30. "Edwin Hamer, Mayor of Blackburn 1899-1900". Cotton Town. Blackburn with Darwen. Retrieved 30 October 2020.
  31. "Late 19th Century". Cotton Town. Blackburn with Darwen Council. Retrieved 21 November 2017.
  32. 1 2 British Parliamentary Election Results 1885–1918, FWS Craig
  33. The Liberal Year Book, 1907
  34. Debrett's House of Commons & Judicial Bench, 1886
  35. "Blackburn". Preston Herald. 2 January 1886. p. 3. Retrieved 24 November 2017.
  36. 1 2 3 4 5 6 7 8 9 10 11 12 13 14 15 Craig, F. W. S., ed. (1977). British Parliamentary Election Results 1832-1885 (e-book) (1st ed.). London: Macmillan Press. ISBN   978-1-349-02349-3.
  37. "Blackburn Election" . Jersey Independent and Daily Telegraph. 2 October 1875 via British Newspaper Archive.
  38. "Election of Blackburn" . Preston Herald. 25 September 1875. p. 3. Retrieved 27 December 2017 via British Newspaper Archive.
  39. "The General Election" . Western Daily Mercury. 28 January 1874. p. 3. Retrieved 27 December 2017 via British Newspaper Archive.
  40. "Election Intelligence. Blackburn". The Times. London. 31 March 1869. p. 4, col F.
  41. "Blackburn Election Petition" . Preston Chronicle. 20 March 1869. p. 2. Retrieved 28 January 2018 via British Newspaper Archive.
  42. "Representation of Blackburn" . Preston Chronicle. 23 April 1859. p. 5. Retrieved 14 April 2018 via British Newspaper Archive.
  43. "Blackburn Election" . Manchester Courier and Lancashire General Advertiser. 26 March 1853. p. 5. Retrieved 14 April 2018 via British Newspaper Archive.
  44. "Durham Chronicle" . 6 August 1847. p. 6. Retrieved 27 October 2018 via British Newspaper Archive.
  45. "Blackburn Election" . Preston Chronicle. 24 July 1847. pp. 6–7. Retrieved 27 October 2018 via British Newspaper Archive.
  46. "Blackburn" . Bell's Weekly Messenger. 31 July 1847. p. 2. Retrieved 27 October 2018 via British Newspaper Archive.