Burnley | |
---|---|
Borough constituency for the House of Commons | |
County | Lancashire |
Population | 87,059 (2011 census) [1] |
Electorate | 64,338 (December 2018) [2] |
Major settlements | Burnley |
Current constituency | |
Created | 1868 |
Member of Parliament | Antony Higginbotham (Conservative) |
Seats | One |
Created from | North Lancashire |
Burnley is a constituency [n 1] centred on the town of Burnley in Lancashire which has been represented since 2019 by Antony Higginbotham, a Conservative. [n 2]
The seat was created in 1868. From World War II until 2010 it was won by Labour candidates, generally on safe, large majorities; Ann Widdecombe failed to take the seat from the Labour Party in 1979. The closest second place was to a Conservative Party candidate, Ian Bruce, who came 787 votes (1.6%) short of taking the seat in 1983. [3]
Burnley saw strong opposition support for the Liberal Democrats in 2005 who moved into second place; meanwhile a local independent pushed Yousuf Miah, a Conservative into fourth position. Following controversy regarding outgoing Labour MP Kitty Ussher's personal expenses, Gordon Birtwistle, who first contested the seat in 1992, gained the seat in 2010 with a heavy swing of 9.6%.
However, Birtwistle was one of the many casualties faced by the Liberal Democrats in the 2015 election, losing the seat to Julie Cooper, who had also stood as Labour's candidate in 2010, although the 6.2% swing away from Birtwistle was less than half the 15.2% national swing against his party. As in 2005, the Conservatives came fourth, behind UKIP, as well as Labour and the Lib Dems this time.
At the 2017 election, Labour held the seat with an increased majority. Birtwistle stood again, but saw his share of the vote halved; this was widely seen to be due to his party's stance on Brexit. This election saw one of the biggest increases in the share of the vote for the Conservatives in the whole country, who more than doubled their share of the vote. UKIP lost two-thirds of their vote from 2015, but did retain their deposit. This meant that Burnley was one of the few constituencies in England where four parties retained their deposits.
At the 2019 election, Antony Higginbotham won the seat for the Conservatives, thus becoming the first Conservative to represent Burnley in parliament for over 100 years. [4] The Conservative vote share increased by over 9% compared with the previous election, while the Labour vote share declined by about 10%. [5]
The review of parliamentary representation in Lancashire by the Boundary Commission for England in the 2000s proposed no change to the boundaries of the Burnley seat. The seat remains coterminous with the boundaries of the borough of Burnley (as it has been since 1983; before then, it was coterminous with the county borough of the same name). [6]
1868–1885: The townships of Burnley, and Habergham Eaves. [7]
1885–1918:
1918–1983: The County Borough of Burnley.
1983–1997: The Borough of Burnley.
1997–present: As 1983 but with redrawn boundaries, due to local government boundary changes in the mid-1980s.
Further to the 2023 Periodic Review of Westminster constituencies, enacted by the Parliamentary Constituencies Order 2023, from the next general election, due by January 2025, the constituency will be composed of the following (as they existed on 1 December 2020):
The constituency will be expanded to bring the electorate within the permitted range by transferring the community of Brierfield from the (to be abolished) constituency of Pendle.
Party | Candidate | Votes | % | ±% | |
---|---|---|---|---|---|
Conservative | Antony Higginbotham [11] | ||||
Labour | Oliver Ryan [12] | ||||
Liberal Democrats | Gordon Birtwistle [13] | ||||
Green | Scott Cunliffe [14] | ||||
Majority | |||||
Turnout | |||||
Swing | |||||
Party | Candidate | Votes | % | ±% | |
---|---|---|---|---|---|
Conservative | Antony Higginbotham | 15,720 | 40.3 | +9.3 | |
Labour | Julie Cooper | 14,368 | 36.9 | ―9.8 | |
Liberal Democrats | Gordon Birtwistle | 3,501 | 9.0 | ―6.0 | |
Brexit Party | Stewart Scott | 3,362 | 8.6 | New | |
BAPIP | Charlie Briggs | 1,162 | 3.0 | New | |
Green | Laura Fisk | 739 | 1.9 | +0.8 | |
Independent | Karen Entwistle | 132 | 0.3 | New | |
Majority | 1,352 | 3.4 | N/A | ||
Turnout | 38,984 | 60.6 | ―1.6 | ||
Conservative gain from Labour | Swing | +9.5 | |||
Party | Candidate | Votes | % | ±% | |
---|---|---|---|---|---|
Labour | Julie Cooper | 18,832 | 46.7 | +9.1 | |
Conservative | Paul White | 12,479 | 31.0 | +17.5 | |
Liberal Democrats | Gordon Birtwistle | 6,046 | 15.0 | ―14.5 | |
UKIP | Tom Commis | 2,472 | 6.1 | ―11.2 | |
Green | Laura Fisk | 461 | 1.1 | ―1.0 | |
Majority | 6,353 | 15.7 | +7.6 | ||
Turnout | 40,290 | 62.2 | +0.6 | ||
Labour hold | Swing | ||||
Party | Candidate | Votes | % | ±% | |
---|---|---|---|---|---|
Labour | Julie Cooper | 14,951 | 37.6 | +6.3 | |
Liberal Democrats | Gordon Birtwistle | 11,707 | 29.5 | ―6.2 | |
UKIP | Tom Commis | 6,864 | 17.3 | +15.1 | |
Conservative | Sarah Cockburn-Price | 5,374 | 13.5 | ―3.1 | |
Green | Mike Hargreaves | 850 | 2.1 | New | |
Majority | 3,244 | 8.1 | N/A | ||
Turnout | 39,746 | 61.6 | ―1.2 | ||
Labour gain from Liberal Democrats | Swing | +6.3 | |||
Party | Candidate | Votes | % | ±% | |
---|---|---|---|---|---|
Liberal Democrats | Gordon Birtwistle | 14,932 | 35.7 | +12.0 | |
Labour | Julie Cooper | 13,114 | 31.3 | ―7.2 | |
Conservative | Richard Ali | 6,950 | 16.6 | +5.8 | |
BNP | Sharon Wilkinson | 3,747 | 9.0 | ―1.3 | |
Independent | Andrew Brown | 1,876 | 4.5 | New | |
UKIP | John Wignall | 929 | 2.2 | +1.2 | |
Independent | Andrew Hennessey | 287 | 0.7 | New | |
Majority | 1,818 | 4.3 | N/A | ||
Turnout | 41,845 | 62.8 | +3.6 | ||
Liberal Democrats gain from Labour | Swing | +9.6 | |||
2010s – 2000s – 1990s – 1980s – 1970s – 1960s – 1950s – 1940s – 1930s – 1920s – 1910s – 1900s – 1890s – 1880s – 1870s – 1860s – Back to Top |
Party | Candidate | Votes | % | ±% | |
---|---|---|---|---|---|
Labour | Kitty Ussher | 14,999 | 38.5 | ―10.8 | |
Liberal Democrats | Gordon Birtwistle | 9,221 | 23.7 | +7.5 | |
Burnley First Independent | Harry Brooks | 5,786 | 14.8 | New | |
Conservative | Yousuf Miah | 4,206 | 10.8 | ―10.1 | |
BNP | Len Starr | 4,003 | 10.3 | ―1.0 | |
Independent | Jeff Slater | 392 | 1.0 | New | |
UKIP | Robert McDowell | 376 | 1.0 | ―1.3 | |
Majority | 5,778 | 14.8 | -13.6 | ||
Turnout | 38,983 | 59.2 | +3.5 | ||
Labour hold | Swing | ―9.2 [n 3] | |||
Party | Candidate | Votes | % | ±% | |
---|---|---|---|---|---|
Labour | Peter Pike | 18,195 | 49.3 | ―8.6 | |
Conservative | Robert Frost | 7,697 | 20.9 | +0.7 | |
Liberal Democrats | Paul Wright | 5,975 | 16.2 | ―1.2 | |
BNP | Steve Smith | 4,151 | 11.3 | New | |
UKIP | Richard Buttrey | 866 | 2.3 | New | |
Majority | 10,498 | 28.4 | -9.3 | ||
Turnout | 36,884 | 55.7 | ―11.2 | ||
Labour hold | Swing | ―4.6 | |||
2010s – 2000s – 1990s – 1980s – 1970s – 1960s – 1950s – 1940s – 1930s – 1920s – 1910s – 1900s – 1890s – 1880s – 1870s – 1860s – Back to Top |
Party | Candidate | Votes | % | ±% | |
---|---|---|---|---|---|
Labour | Peter Pike | 26,210 | 57.9 | +4.9 | |
Conservative | Bill Wiggin | 9,148 | 20.2 | ―10.4 | |
Liberal Democrats | Gordon Birtwistle | 7,877 | 17.4 | +1.0 | |
Referendum | Richard Oakley | 2,010 | 4.4 | New | |
Majority | 17,062 | 37.7 | +15.3 | ||
Turnout | 45,245 | 66.9 | ―7.3 | ||
Labour hold | Swing | +7.65 | |||
Party | Candidate | Votes | % | ±% | |
---|---|---|---|---|---|
Labour | Peter Pike | 27,184 | 53.0 | +4.6 | |
Conservative | Brenda Binge | 15,693 | 30.6 | ―3.2 | |
Liberal Democrats | Gordon Birtwistle | 8,414 | 16.4 | ―1.4 | |
Majority | 11,491 | 22.4 | +7.8 | ||
Turnout | 51,291 | 74.2 | ―4.6 | ||
Labour hold | Swing | +3.9 | |||
2010s – 2000s – 1990s – 1980s – 1970s – 1960s – 1950s – 1940s – 1930s – 1920s – 1910s – 1900s – 1890s – 1880s – 1870s – 1860s – Back to Top |
Party | Candidate | Votes | % | ±% | |
---|---|---|---|---|---|
Labour | Peter Pike | 25,140 | 48.4 | +8.6 | |
Conservative | Harold Elletson | 17,583 | 33.8 | ―4.4 | |
SDP | Ronals Baker | 9,241 | 17.8 | ―2.2 | |
Majority | 7,557 | 14.6 | +13.0 | ||
Turnout | 51,964 | 78.8 | +2.5 | ||
Labour hold | Swing | +6.5 | |||
Party | Candidate | Votes | % | ±% | |
---|---|---|---|---|---|
Labour | Peter Pike | 20,178 | 39.8 | ―11.0 | |
Conservative | Ian Bruce | 19,391 | 38.2 | +2.8 | |
Liberal | Michael Steed | 11,191 | 20.0 | +7.2 | |
Majority | 787 | 1.6 | ―13.8 | ||
Turnout | 50,760 | 76.3 | |||
Labour hold | Swing | ―6.9 | |||
2010s – 2000s – 1990s – 1980s – 1970s – 1960s – 1950s – 1940s – 1930s – 1920s – 1910s – 1900s – 1890s – 1880s – 1870s – 1860s – Back to Top |
Party | Candidate | Votes | % | ±% | |
---|---|---|---|---|---|
Labour | Dan Jones | 20,172 | 50.8 | ―4.0 | |
Conservative | Ann Widdecombe | 14,062 | 35.4 | +10.7 | |
Liberal | Michael Steed | 5,091 | 12.8 | ―7.7 | |
Independent Democrat | F. Tyrrall | 352 | 0.9 | New | |
Majority | 6,110 | 15.4 | ―14.7 | ||
Turnout | 39,677 | ||||
Labour hold | Swing | ||||
Party | Candidate | Votes | % | ±% | |
---|---|---|---|---|---|
Labour | Dan Jones | 21,642 | 54.8 | +4.4 | |
Conservative | A. Pickup | 9,766 | 24.7 | ―2.3 | |
Liberal | S.P. Mews | 8,119 | 20.5 | ―2.1 | |
Majority | 11,876 | 30.1 | +6.7 | ||
Turnout | 39,527 | 79.7 | 0.0 | ||
Labour hold | Swing | +3.3 | |||
Party | Candidate | Votes | % | ±% | |
---|---|---|---|---|---|
Labour | Dan Jones | 21,108 | 50.4 | ―6.6 | |
Conservative | A. Pickup | 11,268 | 27.0 | ―7.9 | |
Liberal | S. Mews | 9,471 | 22.6 | +14.5 | |
Majority | 9,840 | 23.4 | +1.3 | ||
Turnout | 41,847 | 79.7 | +4.0 | ||
Labour hold | Swing | ||||
Party | Candidate | Votes | % | ±% | |
---|---|---|---|---|---|
Labour | Dan Jones | 24,200 | 57.0 | ―3.4 | |
Conservative | John Birch | 14,846 | 34.9 | +7.2 | |
Liberal | George Brownbill | 3,446 | 8.11 | ―3.8 | |
Majority | 9,354 | 22.1 | ―10.7 | ||
Turnout | 39,046 | 75.7 | ―4.3 | ||
Labour hold | Swing | ||||
2010s – 2000s – 1990s – 1980s – 1970s – 1960s – 1950s – 1940s – 1930s – 1920s – 1910s – 1900s – 1890s – 1880s – 1870s – 1860s – Back to Top |
Party | Candidate | Votes | % | ±% | |
---|---|---|---|---|---|
Labour | Dan Jones | 25,583 | 60.43 | ||
Conservative | Albert S Royse | 11,710 | 27.66 | ||
Liberal | Mary R Mason | 5,045 | 11.92 | ||
Majority | 13,873 | 32.77 | |||
Turnout | 42,338 | 79.96 | |||
Labour hold | Swing | ||||
Party | Candidate | Votes | % | ±% | |
---|---|---|---|---|---|
Labour | Dan Jones | 25,244 | 56.80 | ||
Conservative | Tom Mitchell | 12,365 | 27.82 | ||
Liberal | Mary R Mason | 6,833 | 15.38 | New | |
Majority | 12,879 | 28.98 | |||
Turnout | 44,442 | 81.68 | |||
Labour hold | Swing | ||||
2010s – 2000s – 1990s – 1980s – 1970s – 1960s – 1950s – 1940s – 1930s – 1920s – 1910s – 1900s – 1890s – 1880s – 1870s – 1860s – Back to Top |
Party | Candidate | Votes | % | ±% | |
---|---|---|---|---|---|
Labour | Dan Jones | 27,675 | 56.97 | ||
Conservative | Edward Brooks | 20,902 | 43.03 | ||
Majority | 6,773 | 13.94 | |||
Turnout | 48,577 | 83.77 | |||
Labour hold | Swing | ||||
Party | Candidate | Votes | % | ±% | |
---|---|---|---|---|---|
Labour | Wilfrid Burke | 27,865 | 55.63 | ||
Conservative | Edward Brooks | 22,229 | 44.37 | ||
Majority | 5,636 | 11.26 | |||
Turnout | 50,094 | 83.46 | |||
Labour hold | Swing | ||||
Party | Candidate | Votes | % | ±% | |
---|---|---|---|---|---|
Labour | Wilfrid Burke | 31,261 | 56.53 | ||
Conservative | Donald P Dunkley | 24,034 | 43.37 | ||
Majority | 7,227 | 13.16 | |||
Turnout | 55,295 | 88.86 | |||
Labour hold | Swing | ||||
Party | Candidate | Votes | % | ±% | |
---|---|---|---|---|---|
Labour | Wilfrid Burke | 30,685 | 55.65 | ||
Conservative | F.H. Wilson | 23,636 | 42.86 | ||
Communist | Bill Whittaker [34] | 526 | 0.95 | New | |
Ind. Labour Party | Dan Carradice | 295 | 0.53 | New | |
Majority | 7,049 | 12.79 | |||
Turnout | 55,142 | 89.56 | |||
Labour hold | Swing | ||||
2010s – 2000s – 1990s – 1980s – 1970s – 1960s – 1950s – 1940s – 1930s – 1920s – 1910s – 1900s – 1890s – 1880s – 1870s – 1860s – Back to Top |
Party | Candidate | Votes | % | ±% | |
---|---|---|---|---|---|
Labour | Wilfrid Burke | 32,122 | 63.54 | ||
National Liberal | Herbert Monckton Milnes | 18,431 | 36.46 | ||
Majority | 13,691 | 27.08 | |||
Turnout | 50,553 | 80.44 | |||
Labour hold | Swing | ||||
2010s – 2000s – 1990s – 1980s – 1970s – 1960s – 1950s – 1940s – 1930s – 1920s – 1910s – 1900s – 1890s – 1880s – 1870s – 1860s – Back to Top |
Party | Candidate | Votes | % | ±% | |
---|---|---|---|---|---|
Labour | Wilfrid Burke | 31,160 | 53.61 | ||
National Liberal | Gordon Campbell | 26,965 | 46.39 | ||
Majority | 4,195 | 7.22 | N/A | ||
Turnout | 58,125 | 87.36 | |||
Labour gain from National Liberal | Swing | ||||
Party | Candidate | Votes | % | ±% | |
---|---|---|---|---|---|
National | Gordon Campbell | 35,126 | 56.15 | ||
Labour | Arthur Henderson | 26,917 | 43.03 | ||
Communist | J. Rushton | 512 | 0.82 | New | |
Majority | 8,209 | 13.12 | N/A | ||
Turnout | 62,555 | 91.85 | |||
National gain from Labour | Swing | ||||
2010s – 2000s – 1990s – 1980s – 1970s – 1960s – 1950s – 1940s – 1930s – 1920s – 1910s – 1900s – 1890s – 1880s – 1870s – 1860s – Back to Top |
Party | Candidate | Votes | % | ±% | |
---|---|---|---|---|---|
Labour | Arthur Henderson | 28,091 | 46.2 | +0.8 | |
Unionist | Ian Fairbairn | 20,137 | 33.2 | −2.4 | |
Liberal | Aneurin Edwards | 12,502 | 20.6 | +1.6 | |
Majority | 7,954 | 13.0 | +3.2 | ||
Turnout | 60,730 | 89.6 | +1.2 | ||
Registered electors | 67,781 | ||||
Labour hold | Swing | +1.6 | |||
Party | Candidate | Votes | % | ±% | |
---|---|---|---|---|---|
Labour | Arthur Henderson | 20,549 | 45.4 | +7.6 | |
Unionist | Ian Fairbairn | 16,084 | 35.6 | +3.8 | |
Liberal | James Whitehead | 8,601 | 19.0 | −11.4 | |
Majority | 4,465 | 9.8 | +3.8 | ||
Turnout | 45,954 | 88.4 | +1.1 | ||
Registered electors | 51,162 | ||||
Labour hold | Swing | +1.9 | |||
Party | Candidate | Votes | % | ±% | |
---|---|---|---|---|---|
Labour | Arthur Henderson | 24,571 | 58.4 | +20.6 | |
Conservative | Harold Edward Joscelyn Camps | 17,534 | 41.6 | +9.8 | |
Majority | 7,037 | 16.8 | +10.8 | ||
Turnout | 42,105 | 82.4 | −4.9 | ||
Registered electors | 51,086 | ||||
Labour hold | Swing | +5.4 | |||
Party | Candidate | Votes | % | ±% | |
---|---|---|---|---|---|
Labour | Dan Irving | 16,848 | 37.8 | −1.3 | |
Unionist | Harold Edward Joscelyn Camps | 14,197 | 31.8 | −1.3 | |
Liberal | James Whitehead | 13,543 | 30.4 | +2.6 | |
Majority | 2,651 | 6.0 | 0.0 | ||
Turnout | 44,588 | 87.3 | −1.4 | ||
Registered electors | 51,086 | ||||
Labour hold | Swing | 0.0 | |||
Party | Candidate | Votes | % | ±% | |
---|---|---|---|---|---|
Labour | Dan Irving | 17,385 | 39.1 | −2.8 | |
Unionist | Harold Edward Joscelyn Camps | 14,731 | 33.1 | −0.7 | |
Liberal | Walter Layton | 12,339 | 27.8 | +3.5 | |
Majority | 2,654 | 6.0 | −2.1 | ||
Turnout | 44,455 | 88.7 | +17.3 | ||
Registered electors | 50,111 | ||||
Labour hold | Swing | −1.1 | |||
2010s – 2000s – 1990s – 1980s – 1970s – 1960s – 1950s – 1940s – 1930s – 1920s – 1910s – 1900s – 1890s – 1880s – 1870s – 1860s – Back to Top |
Party | Candidate | Votes | % | ±% | |
---|---|---|---|---|---|
Labour | Dan Irving | 15,217 | 41.9 | New | |
C | Unionist | Henry Mulholland | 12,289 | 33.8 | -3.7 |
Liberal | John Howarth Grey | 8,825 | 24.3 | -14.3 | |
Majority | 2,928 | 8.1 | N/A | ||
Turnout | 21,114 | 71.4 | −22.7 | ||
Labour gain from Liberal | Swing | +16.2 | |||
Cindicates candidate endorsed by the coalition government. |
A General Election was due to take place by the end of 1915. By the summer of 1914, the following candidates had been adopted to contest that election. Due to the outbreak of war, the election never took place.
Party | Candidate | Votes | % | ±% | |
---|---|---|---|---|---|
Liberal | Philip Morrell | 6,177 | 38.7 | +4.1 | |
Conservative | Gerald Arbuthnot | 6,004 | 37.5 | +2.3 | |
Social Democratic Federation | Henry Hyndman | 3,810 | 23.8 | -6.4 | |
Majority | 173 | 1.2 | N/A | ||
Turnout | 15,991 | 94.1 | −2.4 | ||
Registered electors | 16,992 | ||||
Liberal gain from Conservative | Swing | +0.9 | |||
Party | Candidate | Votes | % | ±% | |
---|---|---|---|---|---|
Conservative | Gerald Arbuthnot | 5,776 | 35.2 | +2.5 | |
Lib-Lab | Fred Maddison | 5,681 | 34.6 | −0.2 | |
Social Democratic Federation | Henry Hyndman | 4,948 | 30.2 | −2.3 | |
Majority | 95 | 0.6 | N/A | ||
Turnout | 16,405 | 96.5 | +1.5 | ||
Registered electors | 16,992 | ||||
Conservative gain from Lib-Lab | Swing | +1.4 | |||
2010s – 2000s – 1990s – 1980s – 1970s – 1960s – 1950s – 1940s – 1930s – 1920s – 1910s – 1900s – 1890s – 1880s – 1870s – 1860s – Back to Top |
Party | Candidate | Votes | % | ±% | |
---|---|---|---|---|---|
Lib-Lab | Fred Maddison | 5,288 | 34.8 | −12.9 | |
Conservative | Gerald Arbuthnot | 4,964 | 32.7 | −19.6 | |
Social Democratic Federation | Henry Hyndman | 4,932 | 32.5 | New | |
Majority | 324 | 2.1 | N/A | ||
Turnout | 15,184 | 95.0 | +5.1 | ||
Registered electors | 15,983 | ||||
Lib-Lab gain from Conservative | Swing | +3.4 | |||
Party | Candidate | Votes | % | ±% | |
---|---|---|---|---|---|
Conservative | William Mitchell | 6,773 | 52.3 | +9.8 | |
Liberal | Philip Stanhope | 6,173 | 47.7 | +2.6 | |
Majority | 600 | 4.6 | N/A | ||
Turnout | 12,946 | 89.9 | −0.6 | ||
Registered electors | 14,393 | ||||
Conservative gain from Liberal | Swing | +3.6 | |||
2010s – 2000s – 1990s – 1980s – 1970s – 1960s – 1950s – 1940s – 1930s – 1920s – 1910s – 1900s – 1890s – 1880s – 1870s – 1860s – Back to Top |
Party | Candidate | Votes | % | ±% | |
---|---|---|---|---|---|
Liberal | Philip Stanhope | 5,454 | 45.1 | −11.1 | |
Conservative | William Alexander Lindsay [41] | 5,133 | 42.5 | −1.3 | |
Social Democratic Federation | Henry Hyndman | 1,498 | 12.4 | New | |
Majority | 321 | 2.6 | −9.8 | ||
Turnout | 12,085 | 90.5 | −0.5 | ||
Registered electors | 13,360 | ||||
Liberal hold | Swing | −4.9 | |||
Party | Candidate | Votes | % | ±% | |
---|---|---|---|---|---|
Liberal | Philip Stanhope | 6,199 | 53.0 | −3.2 | |
Conservative | William Alexander Lindsay [41] | 5,506 | 47.0 | +3.2 | |
Majority | 693 | 6.0 | −6.4 | ||
Turnout | 11,705 | 91.3 | +0.3 | ||
Registered electors | 12,826 | ||||
Liberal hold | Swing | −3.2 | |||
Party | Candidate | Votes | % | ±% | |
---|---|---|---|---|---|
Liberal | Jabez Balfour | 6,450 | 56.2 | +6.5 | |
Liberal Unionist | Edwin Lawrence | 5,035 | 43.8 | −6.5 | |
Majority | 1,415 | 12.4 | N/A | ||
Turnout | 11,485 | 91.0 | +4.1 | ||
Registered electors | 12,619 | ||||
Liberal gain from Liberal Unionist | Swing | +6.5 | |||
2010s – 2000s – 1990s – 1980s – 1970s – 1960s – 1950s – 1940s – 1930s – 1920s – 1910s – 1900s – 1890s – 1880s – 1870s – 1860s – Back to Top |
Party | Candidate | Votes | % | ±% | |
---|---|---|---|---|---|
Liberal | Jabez Balfour | Unopposed | |||
Liberal gain from Liberal Unionist |
Party | Candidate | Votes | % | ±% | |
---|---|---|---|---|---|
Liberal | John Slagg | 5,026 | 52.9 | +3.2 | |
Conservative | John Thursby [42] | 4,481 | 47.1 | −3.2 | |
Majority | 545 | 5.8 | N/A | ||
Turnout | 9,507 | 94.9 | +8.0 | ||
Registered electors | 10,020 | ||||
Liberal gain from Liberal Unionist | Swing | +3.2 | |||
Party | Candidate | Votes | % | ±% | |
---|---|---|---|---|---|
Liberal Unionist | Peter Rylands | 4,209 | 50.3 | +4.0 | |
Liberal | James Greenwood [43] | 4,166 | 49.7 | −4.0 | |
Majority | 43 | 0.6 | N/A | ||
Turnout | 8,375 | 86.9 | −7.2 | ||
Registered electors | 9,638 | ||||
Liberal Unionist gain from Liberal | Swing | +4.0 | |||
Party | Candidate | Votes | % | ±% | |
---|---|---|---|---|---|
Liberal | Peter Rylands | 4,866 | 53.7 | −1.4 | |
Conservative | Henry Herbert Wainwright | 4,199 | 46.3 | +1.4 | |
Majority | 667 | 7.4 | −2.8 | ||
Turnout | 9,065 | 94.1 | +0.1 | ||
Registered electors | 9,638 | ||||
Liberal hold | Swing | −1.4 | |||
Party | Candidate | Votes | % | ±% | |
---|---|---|---|---|---|
Liberal | Peter Rylands | 3,943 | 55.1 | −0.1 | |
Conservative | Edmund Talbot | 3,217 | 44.9 | +0.1 | |
Majority | 726 | 10.2 | −0.2 | ||
Turnout | 7,160 | 94.0 | +9.9 | ||
Registered electors | 7,614 | ||||
Liberal hold | Swing | −0.1 | |||
2010s – 2000s – 1990s – 1980s – 1970s – 1960s – 1950s – 1940s – 1930s – 1920s – 1910s – 1900s – 1890s – 1880s – 1870s – 1860s – Back to Top |
Party | Candidate | Votes | % | ±% | |
---|---|---|---|---|---|
Liberal | Peter Rylands | 3,520 | 53.4 | −1.8 | |
Conservative | William Alexander Lindsay [47] | 3,077 | 46.6 | +1.8 | |
Majority | 433 | 6.8 | −3.6 | ||
Turnout | 6,597 | 92.6 | +8.5 | ||
Registered electors | 7,127 | ||||
Liberal hold | Swing | −1.8 | |||
Party | Candidate | Votes | % | ±% | |
---|---|---|---|---|---|
Liberal | Richard Shaw | 3,065 | 55.2 | +1.3 | |
Conservative | William Alexander Lindsay [47] | 2,490 | 44.8 | −1.3 | |
Majority | 575 | 10.4 | +2.6 | ||
Turnout | 5,555 | 84.1 | +8.4 | ||
Registered electors | 6,607 | ||||
Liberal hold | Swing | +1.3 | |||
2010s – 2000s – 1990s – 1980s – 1970s – 1960s – 1950s – 1940s – 1930s – 1920s – 1910s – 1900s – 1890s – 1880s – 1870s – 1860s – Back to Top |
Party | Candidate | Votes | % | ±% | |
---|---|---|---|---|---|
Liberal | Richard Shaw | 2,620 | 53.9 | ||
Conservative | James Yorke Scarlett | 2,238 | 46.1 | ||
Majority | 382 | 7.8 | |||
Turnout | 4,858 | 75.7 | |||
Registered electors | 6,417 | ||||
Liberal win (new seat) |
Southampton, Itchen is a constituency represented in the House of Commons of the UK Parliament since 2015 by Royston Smith, a Conservative member of parliament. Discounting the Speaker returned in the early 1970s in two elections, local voters have elected the MP from only two parties alternately for various periods, with one party reaffiliation (defection) between elections when the Labour Party split in the 1980s.
Spelthorne is a constituency in Surrey represented in the House of Commons of the UK Parliament since 2010 by Kwasi Kwarteng, a Conservative, who served as Chancellor of the Exchequer for 38 days in September and October 2022.
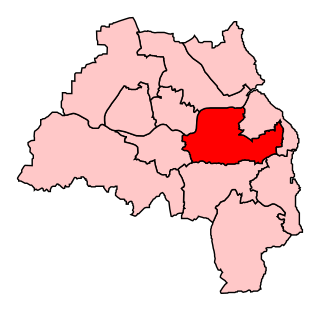
Battersea is a constituency in the London Borough of Wandsworth. It has been represented since 2017 by Marsha de Cordova of the Labour Party.
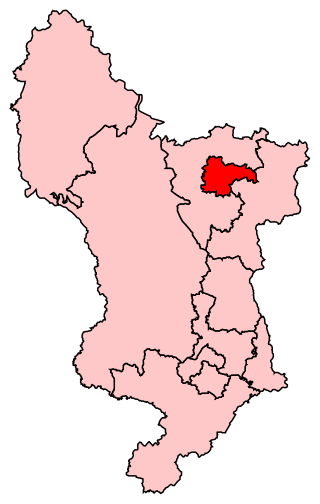
Chesterfield is a constituency represented in the House of Commons of the UK Parliament since 2010 by Toby Perkins of the Labour Party.
Chorley is a constituency in Lancashire represented in the House of Commons of the UK Parliament since 1997 by Lindsay Hoyle. Hoyle was originally elected for the Labour Party, but in 2019 became the Speaker, making him unaffiliated.
Fylde has been a constituency in Lancashire which is represented in the House of Commons of the UK Parliament since 2010 by Mark Menzies, formerly of the Conservative Party, but now an Independent after the whip was withdrawn in April 2024, with allegations he misused campaign funds.
Preston is a constituency represented in the House of Commons of the UK Parliament since 2000 by Sir Mark Hendrick, a member of the Labour Party and Co-operative Party.
Barrow and Furness, formerly known as Barrow-in-Furness, is a constituency in Cumbria which has been represented in the House of Commons of the UK Parliament by Simon Fell of the Conservative Party since 2019.
Bootle is a constituency which has been represented in the House of Commons of the UK Parliament, since 2015 by Peter Dowd of the Labour Party.
Hyndburn is a constituency in Lancashire represented in the House of Commons of the UK Parliament since 2019 by Sara Britcliffe of the Conservative Party.
Liverpool, Walton is a constituency represented in the House of Commons of the UK Parliament since 2017 by Dan Carden of the Labour Party. Carden won the highest percentage share of the vote in June 2017 of 650 constituencies, 85.7%. It is the safest Labour seat in the United Kingdom, and the safest seat in the country having been won by 85% of the vote in the most recent election in 2019.
Southport is a constituency in Merseyside which has been represented in the House of Commons of the UK Parliament since 2017 by Damien Moore of the Conservative Party.
Jarrow is a constituency represented in the House of Commons of the UK Parliament since 2019 by Kate Osborne of the Labour Party.
Eastbourne is a constituency for the House of Commons of the UK Parliament. It was created as one of nine in Sussex in 1885, since when it has reduced in geographic size reflecting the growth of its main settlement, Eastbourne.
Keighley is a constituency in West Yorkshire created in 1885 represented in the House of Commons of the UK Parliament since 2019 by Robbie Moore of the Conservative Party.
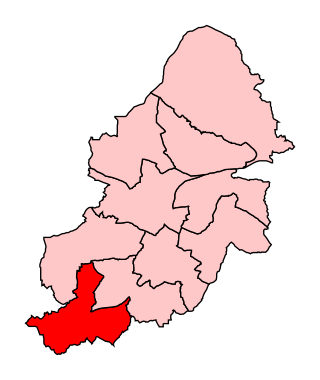
Birmingham Northfield is a constituency represented in the House of Commons of the UK Parliament since 2019 by Gary Sambrook, a Conservative. It represents the southernmost part of the city of Birmingham.
Christchurch is a constituency in Dorset represented in the House of Commons of the UK Parliament since 1997 by Sir Christopher Chope of the Conservative Party.
Hendon is a constituency in Greater London represented in the House of Commons of the UK Parliament since 2010 by Matthew Offord of the Conservative Party, who announced in May 2023 that he would stand down at the next general election. It was created for the 1997 general election; an earlier version of the seat existed between 1918 and 1945.
Bristol East is a constituency recreated in 1983 covering the eastern part of the City of Bristol, represented in the House of Commons of the UK Parliament since 2005 by Kerry McCarthy of the Labour Party.
Crawley is a constituency in West Sussex represented in the House of Commons of the UK Parliament since 2010 by Henry Smith of the Conservative Party.
{{cite web}}
: CS1 maint: archived copy as title (link)