Energy policy of Australia

Last updated

Australian oil and gas infrastructure Australian oil and gas facilities map-en.svg
Australian oil and gas infrastructure
Renewable power plants in Australia Australian renewable power plants map-en.svg
Renewable power plants in Australia

The energy policy of Australia is subject to the regulatory and fiscal influence of all three levels of government in Australia,[ citation needed ] although only the State and Federal levels determine policy for primary industries such as coal. [1] Federal policies for energy in Australia continue to support the coal mining and natural gas industries through subsidies for fossil fuel use and production. [2] Australia is the 10th most coal-dependent country in the world. [3] Coal and natural gas, along with oil-based products, are currently the primary sources of Australian energy usage and the coal industry produces over 30% of Australia's total greenhouse gas emissions. [4] In 2018 Australia was the 8th highest emitter of greenhouse gases per capita in the world. [5]

Contents

Australia's energy policy features a combination of coal power stations and hydro electricity plants. The Australian government has decided not to build nuclear power plants, [6] although it is one of the world's largest producers of uranium.

Australia has one of the fastest deployment rates of renewable energy worldwide. The country has deployed 5.2 GW of solar and wind power in 2018 alone and at this rate, is on track to reach 50% renewable electricity in 2024 and 100% in 2032. [7] However, Australia may be one of the leading major economies in terms of renewable deployments, but it is one of the least prepared at a network level to make this transition, being ranked 28th out of the list of 32 advanced economies on the World Economic Forum's 2019 Energy Transition Index. [8]

Electricity generation

Australia electricity production by source Australia electricity production.svg
Australia electricity production by source

History and governance

After World War II, New South Wales and Victoria started connecting the formerly small and self-contained local and regional power grids into statewide grids run centrally by public statutory authorities. Similar developments occurred in other states. Both of the industrially large states cooperated with the Commonwealth in the development and interconnection of the Snowy Mountains Scheme.

Rapid economic growth led to large and expanding construction programs of coal-fired power stations such as black coal in New South Wales and brown coal in Victoria. By the 1980s complex policy questions had emerged involving the massive requirements for investment, land and water.

Between 1981 and 1983 a cascade of blackouts and disruptions was triggered in both states, resulting from generator design failures in New South Wales, industrial disputes in Victoria, and drought in the storages of the Snowy system (which provided essential peak power to the State systems). Wide political controversy arose from this and from proposals to the New South Wales Government from the Electricity Commission of New South Wales for urgent approval to build large new stations at Mardi and Olney on the Central Coast, and at other sites later.

The Commission of Enquiry into Electricity Generation Planning in New South Wales was established, reporting in mid-1985. This was the first independent enquiry directed from outside the industry into the Australian electricity system. It found, among other matters, that existing power stations were very inefficient, that plans for four new stations, worth then about $12 billion, should be abandoned, and that if the sector were restructured there should be sufficient capacity for normal purposes until the early years of the 21st century. This forecast was achieved. The Commission also recommended enhanced operational coordination of the adjoining State systems and the interconnection in eastern Australia of regional power markets. [9]

The New South Wales Enquiry marked the beginning of the end of the centralised power utility monopolies and established the direction of a new trajectory in Australian energy policy, towards decentralisation, interconnection of States and the use of markets for coordination. Similar enquiries were subsequently established in Victoria (by the Parliament) and elsewhere, and during the 1990s the industry was comprehensively restructured in southeastern Australia and subsequently corporatised.

Following the report by the Industry Commission on the sector [10] moves towards a national market developed. The impetus towards system-wide competition was encouraged by the Hilmer recommendations. [11] The establishment of the National Electricity Market in 1997 was the first major accomplishment of the new Federal/State cooperative arrangements under the Council of Australian Governments. [12] The governance provisions included a National Electricity Code, the establishment in 1996 of a central market manager, the National Electricity Market Management Company (NEMMCO), and a regulator, National Electricity Code Administrator (NECA).

Following several years experience with the new system and several controversies [13] an energy market reform process was conducted by the Ministerial Council on Energy. [14] As a result, beginning in 2004, a broader national arrangement, including electricity and gas and other forms of energy, was established. These arrangements are administered by a national regulator, the Australian Energy Regulator (AER), and a market rule-making body, the Australian Energy Market Commission (AEMC), and a market operator, the Australian Energy Market Operator (AEMO).

Over the 10 years from 1998–99 to 2008–09, Australia's electricity use increased at an average rate of 2.5% a year. [15] In 2008–09, a total of 261 terawatt-hours (940 PJ) of electricity (including off-grid electricity) was generated in Australia. Between 2009 and 2013 NEM energy usage had decreased by 4.3% or almost 8 terawatt-hours (29 PJ). [16]

Coal-fired power

Electricity generation from renewable sources in Australia, 2015-16 Renewable Electricity Generation Australia 2015-16.png
Electricity generation from renewable sources in Australia, 2015-16
Electricity generation from renewable sources in Australia, 2010 Graph RE Australia 2010.svg
Electricity generation from renewable sources in Australia, 2010

The main source of Australia's electricity generation is coal. In 2003, coal-fired plants produced 58.4% of the total capacity, followed by hydropower (19.1%, of which 17% is pumped storage), natural gas (13.5%), liquid/gas fossil fuel-switching plants (5.4%), oil products (2.9%), wind power (0.4%), biomass (0.2%) and solar (0.1%). [17] In 2003, coal-fired power plants generated 77.2% of the country's total electricity production, followed by natural gas (13.8%), hydropower (7.0%), oil (1.0%), biomass (0.6%) and solar and wind combined (0.3%). [18]

The total generating capacity from all sources in 2008-9 was approximately 51 gigawatts (68,000,000 hp) with average capacity utilisation of 52%. Coal-fired plants constituted a majority of generating capacity which in 2008-9 was 29.4 gigawatts (39,400,000 hp). In 2008–9, a total of 143.2 terawatt-hours (516 PJ) of electricity was produced from black coal and 56.9 terawatt-hours (205 PJ) from brown coal. Depending on the cost of coal at the power station, the long-run marginal cost of coal-based electricity at power stations in eastern Australia is between 7 and 8 cents per kWh, which is around $79 per MWh.

Hydroelectric power

Talbingo Dam is part of the Snowy Mountains Scheme. SnowyMountainsNSWTalbingoDam20050423a.JPG
Talbingo Dam is part of the Snowy Mountains Scheme.

Hydroelectricity accounts for 6.5–7% of NEM electricity generation. [18] [19] The massive Snowy Mountains Scheme is the largest producer of hydro-electricity in eastern Victoria and southern New South Wales.

Wind power

By 2015, there were 4,187 MW of installed wind power capacity, with another 15,284 MW either being planned or under construction. [20] In the year to October 2015, wind power accounted for 4.9% of Australia's total electricity demand and 33.7% of total renewable energy supply. [21] As at October 2015, there were 76 wind farms in Australia, most of which had turbines from 1.5 to 3 MW.

Solar power

Solar energy is used to heat water, in addition to its role in producing electricity through photovoltaics (PV).

In 2014/15, PV accounted for 2.4% of Australia's electrical energy production. [22] The installed PV capacity in Australia has increased 10-fold between 2009 and 2011, and quadrupled between 2011 and 2016.

Wave power

The Australian government says new technology harnessing wave energy could be important for supplying electricity to most of the country's major capital cities. The Perth Wave Energy Project near Fremantle in Western Australia operates through several submerged buoys, creating energy as they move with passing waves. The Australian government has provided more than $US600,000 in research funding for the technology developed by Carnegie, a Perth company. [23]

Nuclear power

Jervis Bay Nuclear Power Plant was a proposed nuclear power reactor in the Jervis Bay Territory on the south coast of New South Wales. It would have been Australia's first nuclear power plant, and was the only proposal to have received serious consideration as of 2005. Some environmental studies and site works were completed, and two rounds of tenders were called and evaluated, but the Australian government decided not to proceed with the project.

Queensland introduced legislation to ban nuclear power development on 20 February 2007. [24] Tasmania has also banned nuclear power development. [25] Both laws were enacted in response to a pro-nuclear position, by John Howard in 2006.

John Howard went to the November 2007 election with a pro-nuclear power platform but his government was soundly defeated by Labor, which is opposed to nuclear power for Australia. [26] [27]

Geothermal

There are vast deep-seated granite systems, mainly in central Australia, that have high temperatures at depth and these are being drilled by 19 companies across Australia in 141 areas. They are spending A$654 million on exploration programs. South Australia has been described as "Australia's hot rock haven" and this emissions-free and renewable energy form could provide an estimated 6.8% of Australia's baseload power needs by 2030. According to an estimate by the Centre for International Economics, Australia has enough geothermal energy to contribute electricity for 450 years. [28]

The 2008 federal budget allocated $50 million through the Renewable Energy Fund to assist with 'proof-of-concept' projects in known geothermal areas. [29]

Biomass

Biomass power plants use crops and other vegetative by-products to produce power similar to the way coal-fired power plants work. Another product of biomass is extracting ethanol from sugar mill by-products. The GGAP subsidies for biomass include ethanol extraction with funds of $7.4M and petrol/ethanol fuel with funds of $8.8 million. The total $16.2M subsidy is considered a renewable energy source subsidy.[ citation needed ]

Biodiesel

Biodiesel is an alternative to fossil fuel diesel that can be used in cars and other internal combustion engine vehicles. It is produced from vegetable or animal fats and is the only other type of fuel that can run in current unmodified vehicle engines.

Subsidies given to ethanol oils totaled $15 million in 2003–2004, $44 million in 2004–2005, $76 million in 2005–2006 and $99 million in 2006–2007. The cost for establishing these subsidies were $1 million in 2005–2006 and $41 million in 2006–2007. [30]

However, with the introduction of the Fuel Tax Bill, grants and subsidies for using biodiesel have been cut leaving the public to continue using diesel instead. [31] The grants were cut by up to 50% by 2010–2014. Previously the grants given to users of ethanol-based biofuels were $0.38 per litre, which were reduced to $0.19 in 2010–2014. [32] [33]

Fossil fuels

In 2003, Australian total primary energy supply (TPES) was 112.6 million tonnes of oil equivalent (Mtoe) and total final consumption (TFC) of energy was 72.3 Mtoe. [34]

Coal

Australia had a fixed carbon price of A$23 ($23.78) a tonne on the top 500 polluters from July 2012 to July 2014. [35] [36]

Coal mine near Collie, Western Australia, 2010 Collie coal mining.jpg
Coal mine near Collie, Western Australia, 2010

Australia is the fourth-largest coal producing country in the world. Newcastle is the largest coal export port in the world. In 2005, Australia mined 301 million tonnes of hard coal (which converted to at least 692.3 million tonnes of co2 emitted [37] ) and 71 million tonnes of brown coal (which converted to at least 78.1 million tonnes of co2). [37] ) Coal is mined in every state of Australia. It provides about 85% of Australia's electricity production and is Australia's largest export commodity. [38] 75% of the coal mined in Australia is exported, mostly to eastern Asia. In 2005, Australia was the largest coal exporter in the world with 231 million tonnes of hard coal. [39] Australian black coal exports are expected by some to increase by 2.6% per year to reach 438 million tonnes by 2029–30, but the possible introduction of emissions trading schemes in customer countries as provided for under the Kyoto protocol may affect these expectations in the medium term.

Coal mining in Australia has become more controversial because of the strong link between the effects of global warming on Australia and burning coal, including exported coal, and climate change, global warming and sea level rise. Coal mining in Australia will as a result have direct impacts on agriculture in Australia, health and natural environment including the Great Barrier Reef. [40]

The IPCC AR4 Working Group III Report "Mitigation of Climate Change" states that under Scenario A (stabilisation at 450ppm) Annex 1 countries (including Australia) will need to reduce greenhouse gas emissions by 25% to 40% by 2020 and 80% to 95% by 2050. [41] Many environmental groups around the world, including those represented in Australia, are taking direct action for the dramatic reduction in the use of coal as carbon capture and storage is not expected to be ready before 2020 if ever commercially viable. [42]

Natural gas

In 2002, the Howard government announced the finalisation of negotiations for a $25 billion contract with China for LNG. [43] The contract was to supply 3 million tonnes of LNG a year [43] from the North West Shelf Venture off Western Australia, and was worth between $700 million and $1 billion a year for 25 years. The members of the consortium which operates the North West Shelf Venture are Woodside Petroleum, BHP, BP, Chevron, Shell and Japan Australia LNG. [44] The price was guaranteed not to increase until 2031, and by 2015 China was paying "one-third the price for Australian gas that Australian consumers themselves had to pay." [43]

In 2007, there was another LNG deal with China worth $35 billion. [45] [43] The agreement was for the potential sale of 2 to 3 million tonnes of LNG a year for 15 to 20 years from the Browse LNG project, off Western Australia, of which Woodside is the operator. The agreement was expected to bring in total revenues of $35 billion to $45 billion. [45]

Succeeding governments oversaw other contracts with China, Japan and South Korea, but none have required exporters to set aside supplies to meet Australia's needs. [43] The price of LNG has historically been linked to oil prices, [46] but the true price, costs and supply levels are presently too difficult to determine. [47]

Santos GLNG Operations, Shell and Origin Energy are major gas producers in Australia. [48] Australia Pacific LNG (APLNG), led by Origin Energy, is the largest producer of natural gas in eastern Australia and a major exporter of liquefied natural gas to Asia. [49] Santos is Australia's second-largest independent oil and gas producer. [50] According to the Australian Competition & Consumer Commission (ACCC), the demand for gas in the domestic east coast market is about 700 petajoules a year. [50] Australia is expected to become the world's biggest LNG exporter by 2019, hurting supplies in the domestic market and driving up gas and power prices. [50]

In 2017 the Australian government received a report from the Australian Energy Market Operator and one from the ACCC showing expected gas shortages in the east coast domestic market over the next two years. [51] [48] The expected gas shortfall is 54 petajoules in 2018 and 48 petajoules in 2019. [52] The federal government considered imposing export controls on gas to ensure adequate domestic supplies. The companies agreed to make sufficient supplies available to the domestic market until the end of 2019. [48] On 7 September Santos pledged to divert 30 petajoules of gas from its Queensland-based Gladstone LNG plant slated for export into Australia's east coast market in 2018 and 2019. [50] On 26 October 2017, APLNG agreed to increase gas to Origin Energy by 41 petajoules over 14 months, increasing APLNG's total commitment to 186 PJ for 2018, representing almost 30% of Australian east coast domestic gas market. [53]

The price at which these additional supplies are to be made available has not been disclosed. [54] On 24 August 2017, Orica chief executive Alberto Calderon described gas prices in Australia as ridiculous, saying that prices in Australia were more than double of what was being paid in China or Japan, adding that Australian producers could buy gas overseas (at much lower world prices) to free up domestic gas to sell at the same profit margin. [55]

Transport subsidies

Petrol

In the transport sector, fuel subsidies reduce petrol prices by $0.38/L.[ citation needed ] This is very significant, given current petrol prices in Australia of around $1.30/L. The acceptable petrol prices hence result in Australia's petroleum consumption at 28.9 GL every year. [56]

According to Greenpeace, removal of this subsidy would make petrol prices rise to around $1.70/L and thus could make certain alternative fuels competitive with petroleum on cost. The 32% price increase associated with subsidy removal would be expected to correspond to an 18% reduction in petrol demand and a Greenhouse Gases emission reduction of 12.5 Mt CO2-e. [57] The Petroleum Resource Rent Tax keeps oil prices low and encourages investment in the 'finite' supplies of oil, at the same time considering alternatives. [58]

Diesel

The subsidies for the Oil-Diesel fuel rebate program are worth about $2 billion, which are much more than the grants devoted to renewable energy. Whilst renewable energy is out of scope at this stage, an alternative diesel–renewable hybrid system is highly recommended. If the subsidies for diesel were bounded with the renewable subsidies, remote communities could adapt hybrid electric generation systems. [59] The Energy Grants Credit Scheme (EGCS), an off-road component is a rebate program for diesel and diesel-like fuels.

Federal Government

Australia introduced a national energy rating label in 1992. The system allows consumers to compare the energy efficiency between similar appliances.

Institutions

The responsible governmental agencies for energy policy are the Council of Australian Governments (COAG), the Ministerial Council on Energy (MCE), the Ministerial Council on Mineral and Petroleum Resources (MCMPR), the Commonwealth Department of Resources; Energy and Tourism (DRET), the Department of Environment and Heritage (DEH), the Australian Greenhouse Office (AGO), the Department of Transport and Regional Services, the Australian Competition and Consumer Commission (ACCC), the Australian Energy Market Commission, the Australian Energy Regulator and the Australian Energy Market Operator.

Energy strategy

In the 2004 White Paper Securing Australia's Energy Future, several initiatives were announced to achieve the Australian Government's energy objectives. These include:

Criticisms

  1. On a net basis this is a tax on the top 40% of income earners which will then be used largely to subsidise the coal industry in attempts to develop carbon capture and storage in Australia, clean coal.
  2. Deforestation is not included in the scheme where there will be reforestation despite the significant timing differences, the uncertainty of reforestation and the effect of leaving old-growth forests vulnerable.
  3. It is unclear what level of a carbon price will be sufficient to reduce demand for coal-fired power and increase demand for low emissions electricity like wind or solar.
  4. No commitment to maintain Mandatory Renewable Energy Target. [61]
  5. The scheme fails to address climate change caused by burning of coal exported from Australia.

Energy market reform

Power lines in South Australia Power lines in the dawn light - globe derby - 1.jpg
Power lines in South Australia

On 11 December 2003, the Ministerial Council on Energy released a document entitled "Reform of Energy Markets". [62] The overall purpose of this initiative was the creation of national electricity and natural gas markets rather than the state-based provision of both. As a result, two federal-level institutions, the Australian Energy Market Commission (AEMC) and the Australian Energy Regulator (AER), were created. [63]

State policies

Queensland

Victoria

Yallourn Power Station is the third-largest power station in Victoria Yallourn-w-power-station-australia.jpg
Yallourn Power Station is the third-largest power station in Victoria

In 2006, Victoria became the first state to have a renewable energy target of 10% by 2016. [64] In 2010 the target was increased to 25% by 2020. [65]

New South Wales

As of 2008 New South Wales had a renewable energy target of 20% by 2020. [66]

Western Australia

In some remote areas of Western Australia, the use of fossil fuels is expensive, thus making renewable energy supplies commercially competitive. [67]

Australian Capital Territory

The ACT Government's Sustainable Energy Policy establishes the key objective of achieving a more sustainable energy supply as the territory moves to carbon neutrality by 2060.[ citation needed ]

Tasmania

Tasmania's electricity grid is largely powered by hydroelectric generation.[ citation needed ]

Renewable energy targets

In 2001, the federal government introduced a Mandatory Renewable Energy Target (MRET) of 9,500 GWh of new generation, with the scheme running until at least 2020. [68] This represents an increase of new renewable electricity generation of about 4% of Australia's total electricity generation and a doubling of renewable generation from 1997 levels. Australia's renewable energy target does not cover heating or transport energy like Europe's or China's, Australia's target is therefore equivalent to approximately 5% of all energy from renewable sources.

The Commonwealth and the states agreed in December 2007, at a Council of Australian Governments (COAG) meeting, to work together from 2008, to combine the Commonwealth scheme with the disparate state schemes, into a single national scheme. The initial report on progress and an implementation plan was considered at a March 2008 COAG meeting. In May 2008, the Productivity Commission, the government's independent research and advisory body on a range of economic, social and environmental issues, claimed the MRET would drive up energy prices and would do nothing to cut greenhouse gas emissions. [69] The Productivity Commission submission to the climate change review, stated that energy generators have warned that big coal-fired power stations are at risk of "crashing out of the system", and leaving huge supply gaps and price spikes if the transition is not carefully managed.[ citation needed ] This forecast has been described as a joke because up to A$20 billion compensation is proposed to be paid under the Carbon Pollution Reduction Scheme.[ citation needed ] In addition, in Victoria where the highest emitting power stations are located, the state government has emergency powers enabling it to take over and run the generating assets. [70] The final design was presented for consideration at the September 2008 COAG meeting. [71] [72]

On 20 August 2009, the Expanded Renewable Energy Target increased the 2020 MRET from 9,500 to 45,000 gigawatt-hours, and continued until 2030. This will ensure that renewable energy reaches a 20% share of the electricity supply in Australia by 2020. [73] After 2020, the proposed Emissions Trading Scheme and improved efficiencies from innovation and manufacturing were expected to allow the MRET to be phased out by 2030.[ citation needed ] The target was criticised as unambitious and ineffective in reducing Australia's fossil fuel dependency, as it only applied to generated electricity, but not to the 77% of energy production exported, nor to energy sources which are not used for electricity generation, such as the oil used in transportation. Thus 20% renewable energy in electricity generation would represent less than 2% of total energy production in Australia. [74]

Computer modelling by the National Generators Forum has signalled the price on greenhouse emissions will need to rise from $20 a tonne in 2010 to $150 a tonne by 2050 if the federal government is to deliver its promised cuts. Generators of Australia's electricity warned of blackouts and power price spikes if the federal government moved too aggressively to put a price on greenhouse emissions. [75]

South Australia achieved its target of 20% of renewable supply by 2014 three years ahead of schedule (i.e. in 2011). In 2008 it set a new target of 33% by 2020. [76] [77] New South Wales and Victoria have renewable energy targets of 20% [66] and 25% [65] respectively by 2020. Tasmania has had 100% renewable energy for a long time.

In 2011 the 'expanded MRET' was split into two schemes: a 41,000 GWh Large-scale Renewable Energy Target (LRET) for utility-scale renewable generators, and an uncapped Small-scale Renewable Energy Scheme for small household and commercial-scale generators.

The MRET requires wholesale purchasers of electricity (such as electricity retailers or industrial operations) to purchase renewable energy certificates (RECs), created through the generation of electricity from renewable sources, including wind, hydro, landfill gas and geothermal, as well as solar PV and solar thermal. The objective is to provide a stimulus and additional revenue for these technologies. [78] Since 1 January 2011, RECs were split into small-scale technology certificates (STCs) and large-scale generation certificates (LGCs). RECs are still used as a general term covering both STCs and LGCs.

In 2014, the Abbott government initiated the Warburton Review and subsequently held negotiations with the Labor Opposition. In June 2015, the 2020 LRET was reduced to 33,000 GWh. [79] [80] This will result in more than 23.5% of Australia's electricity being derived from renewable sources by 2020. The required gigawatt-hours of renewable source electricity from 2017 to 2019 were also adjusted to reflect the new target. [81]

Greenhouse gas emissions reduction targets

Coal is the most carbon-intensive energy source releasing the highest levels of carbon dioxide into the atmosphere.

Low Emissions Technology Demonstration Fund (LETDF)

Currently has funded six projects to help reduce GHG emissions, which are summarised below

ProjectDetailsFunding [Mio. $]
Chevron – CO2 injection programnatural gas extraction, carbon capture and underground storage60
CS Energy – Callide A Oxy-fuel Demonstration Projectblack coal power with carbon capture and underground storage50
Fairview Power – Project Zero Carbon from Coal Seamsgas power station with seam injection of CO275
Solar Systems Australia – Large Scale Solar Concentratorconcentrated sunlight solar power75
International Power -Hazelwood 2030 A Clean Coal Futuredrying of brown coal, carbon capture and underground storage50
HRL Limited -Loy Yang IDGCC projectcombined drying coal systems100
Total410

82% of subsidies are concentrated in the Australian Government's 'Clean Coal Technology', with the remaining 18% of funds allocated to the renewable energy 'Project Solar Systems Australia' $75 million. The LETDF is a new subsidy scheme aimed at fossil fuel energy production started in 2007. [82]

Feed-in tariffs

Between 2008 and 2012 most states and territories in Australia implemented various feed-in tariff arrangements to promote uptake of renewable electricity, primarily in the form of rooftop solar PV systems. As system costs fell uptake accelerated rapidly (in conjunction with the assistance provided through the national-level Small-scale Renewable Energy Scheme (SRES)) and these schemes were progressively wound back.

Public opinion

The Australian results from the 1st Annual World Environment Review, published on 5 June 2007 revealed that: [83]

See also

Related Research Articles

<span class="mw-page-title-main">Energy in Japan</span> Overview of the production, consumption, import and export of energy and electricity in Japan

Japan is a major consumer of energy, ranking fifth in the world by primary energy use. Fossil fuels accounted for 88% of Japan's primary energy in 2019. Japan imports most of its energy due to scarce domestic resources. As of 2022, the country imports 97% of its oil and is the larger LNG importer globally.

<span class="mw-page-title-main">Energy in Taiwan</span>

In 2022, 79.6% of Taiwan's electricity generation came from fossil fuels, 9.1% from nuclear, 8.6% from renewables, and 1.2% from hydro. Taiwan relies on imports for almost 98% of its energy, which leaves the island's energy supply vulnerable to external disruption. In order to reduce this dependence, the Ministry of Economic Affairs' Bureau of Energy has been actively promoting energy research at several universities since the 1990s.

<span class="mw-page-title-main">Energy in the United Kingdom</span> Overview of the energy use of the United Kingdom

Energy in the United Kingdom came mostly from fossil fuels in 2021. Total energy consumption in the United Kingdom was 142.0 million tonnes of oil equivalent in 2019. In 2014, the UK had an energy consumption per capita of 2.78 tonnes of oil equivalent compared to a world average of 1.92 tonnes of oil equivalent. Demand for electricity in 2014 was 34.42 GW on average coming from a total electricity generation of 335.0 TWh.

<span class="mw-page-title-main">Energy policy of the United Kingdom</span> United Kingdom legislation

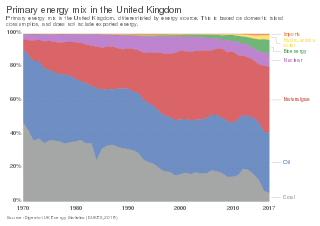
The energy policy of the United Kingdom refers to the United Kingdom's efforts towards reducing energy intensity, reducing energy poverty, and maintaining energy supply reliability. The United Kingdom has had success in this, though energy intensity remains high. There is an ambitious goal to reduce carbon dioxide emissions in future years, but it is unclear whether the programmes in place are sufficient to achieve this objective. Regarding energy self-sufficiency, UK policy does not address this issue, other than to concede historic energy security is currently ceasing to exist.

The energy policy of India is to increase the locally produced energy in India and reduce energy poverty, with more focus on developing alternative sources of energy, particularly nuclear, solar and wind energy. Net energy import dependency was 40.9% in 2021-22.

<span class="mw-page-title-main">Wind power in Australia</span> Renewable energy source (Australia)

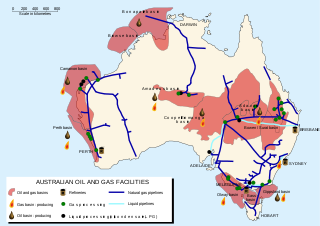
Wind power, a form of renewable energy harnessed through wind turbines, stands as a pivotal contributor to Australia's energy landscape. With a total installed wind capacity reaching approximately 9,100 megawatts (MW), as of October 2023, wind power constitutes a significant portion, representing 5% of Australia's total primary energy supply and a substantial 35% of its renewable energy supply. Australia's geographic disposition favors the proliferation of wind energy infrastructure, particularly in the southern regions of the nation and along the slopes of the Great Dividing Range in the east. Approximately half of Australia's wind farms are located near coastal regions.

<span class="mw-page-title-main">Energy in France</span> Overview of the production, consumption, import and export of energy and electricity in France

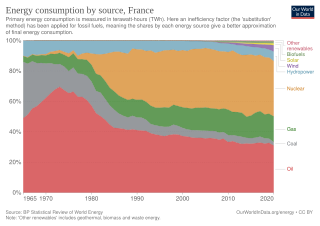
According to the International Energy Agency, France has historically generated a very low level of carbon dioxide emissions compared to other G7 economies due to its reliance on nuclear energy. Energy in France was generated from five primary sources: nuclear power, natural gas, liquid fuels, renewables and coal. In 2020, nuclear power made up the largest portion of electricity generation, at around 78%. Coal energy is declining and due to cease. Renewables accounted for 19.1% of energy consumption in 2020. France has the largest share of nuclear electricity in the world. The country is also among the world's biggest net exporters of electricity. The country is increasingly investing in renewable energy and has set a target of 32% by 2030.

<span class="mw-page-title-main">Renewable energy in Australia</span>

Renewable energy in Australia is mainly based on biomass, solar, wind, and hydro generation. Over a third of electricity is generated from renewables, and is increasing, with a target to phase out coal power before 2040. Wind energy and rooftop solar have particularly grown since 2010. The growth has been stimulated by government energy policy in order to limit the rate of climate change in Australia that has been brought about by the use of fossil fuels. Pros and cons of various types of renewable energy are being investigated, and more recently there have been trials of green hydrogen and wave power.

<span class="mw-page-title-main">Energy policy of China</span> Energy sources used and produced by China

China is both the world's largest energy consumer and the largest industrial country, and ensuring adequate energy supply to sustain economic growth has been a core concern of the Chinese Government since the founding of the People's Republic of China in 1949. Since the country's industrialization in the 1960s, China is currently the world's largest emitter of greenhouse gases, and coal in China is a major cause of global warming. However, from 2010 to 2015 China reduced energy consumption per unit of GDP by 18%, and CO2 emissions per unit of GDP by 20%. On a per-capita basis, China was only the world's 51st largest emitter of greenhouse gases in 2016. China is also the world's largest renewable energy producer, and the largest producer of hydroelectricity, solar power and wind power in the world. The energy policy of China is connected to its industrial policy, where the goals of China's industrial production dictate its energy demand managements.  

<span class="mw-page-title-main">Energy in Queensland</span> Overview of the production, consumption, import and export of energy and electricity in Queensland

Queensland's energy policy is based on the year 2000 document called the Queensland Energy Policy: A Cleaner Energy Strategy. The Queensland Government assists energy development through the Department of Energy and Water Supply. The state is noted for its significant contribution to coal mining in Australia. The primary fuel for electricity generation in the state is coal with coal seam gas becoming a significant fuel source. Queensland has 98% of Australia's reserves of coal seam gas. An expansion of energy-intensive industries such as mining, economic growth and population growth have created increased demand for energy in Queensland.

Mandatory renewable energy targets are part of government legislated schemes which require electricity merchandisers to source-specific amounts of aggregate electricity sales from renewable energy sources according to a fixed time frame. The objective of these schemes is to promote renewable energy and decrease dependency on fossil fuels. If this results in an additional expenditure of electricity, the additional cost is distributed across most customers by increases in other tariffs. The cost of this measure is therefore not funded by the government budgets, except for costs of establishing and monitoring the scheme and any audit and enforcement actions. As the cost of renewable energy has become cheaper than other sources, meeting and exceeding a renewable energy target will also reduce the expenditure of electricity to consumers.

The environmental effects of transport in Australia are considerable. Australia subsidizes fossil fuel energy, keeping prices artificially low and raising greenhouse gas emissions due to the increased use of fossil fuels as a result of the subsidies. The Australian Energy Regulator and state agencies such as the New South Wales' Independent Pricing and Regulatory Tribunal set and regulate electricity prices, thereby lowering production and consumer cost.

<span class="mw-page-title-main">Greenhouse gas emissions by Australia</span> Release of gases from Australia which contribute to global warming

Greenhouse gas emissions by Australia totalled 533 million tonnes CO2-equivalent based on greenhouse gas national inventory report data for 2019; representing per capita CO2e emissions of 21 tons, three times the global average. Coal was responsible for 30% of emissions. The national Greenhouse Gas Inventory estimates for the year to March 2021 were 494.2 million tonnes, which is 27.8 million tonnes, or 5.3%, lower than the previous year. It is 20.8% lower than in 2005. According to the government, the result reflects the decrease in transport emissions due to COVID-19 pandemic restrictions, reduced fugitive emissions, and reductions in emissions from electricity; however, there were increased greenhouse gas emissions from the land and agriculture sectors.

<span class="mw-page-title-main">Energy in Switzerland</span> Overview of energy in Switzerland

Energy in Switzerland is transitioning towards sustainability, targeting net zero emissions by 2050 and a 50% reduction in greenhouse gas emissions by 2030.

<span class="mw-page-title-main">Energy in Australia</span> Overview of the production, consumption, import and export of energy and electricity in Australia

Energy in Australia is the production in Australia of energy and electricity, for consumption or export. Energy policy of Australia describes the politics of Australia as it relates to energy.

<span class="mw-page-title-main">Energy in Portugal</span> Energy and electricity production in Portugal

Energy in Portugal describes energy and electricity production, consumption and import in Portugal. Energy policy of Portugal will describe the politics of Portugal related to energy more in detail. Electricity sector in Portugal is the main article of electricity in Portugal.

<span class="mw-page-title-main">Energy in Turkey</span> Energy used and produced in Turkey

Energy consumption per person in Turkey is similar to the world average, and over 85 per cent is from fossil fuels. From 1990 to 2017 annual primary energy supply tripled, but then remained constant to 2019. In 2019, Turkey's primary energy supply included around 30 per cent oil, 30 per cent coal, and 25 per cent gas. These fossil fuels contribute to Turkey's air pollution and its above average greenhouse gas emissions. Turkey mines its own lignite but imports three-quarters of its energy, including half the coal and almost all the oil and gas it requires, and its energy policy prioritises reducing imports.

A carbon pricing scheme in Australia was introduced by the Gillard Labor minority government in 2011 as the Clean Energy Act 2011 which came into effect on 1 July 2012. Emissions from companies subject to the scheme dropped 7% upon its introduction. As a result of being in place for such a short time, and because the then Opposition leader Tony Abbott indicated he intended to repeal "the carbon tax", regulated organizations responded rather weakly, with very few investments in emissions reductions being made. The scheme was repealed on 17 July 2014, backdated to 1 July 2014. In its place the Abbott government set up the Emission Reduction Fund in December 2014. Emissions thereafter resumed their growth evident before the tax.

<span class="mw-page-title-main">Renewable energy in New Zealand</span>

Approximately 44% of primary energy is from renewable energy sources in New Zealand. Approximately 87% of electricity comes from renewable energy, primarily hydropower and geothermal power.

<span class="mw-page-title-main">Greenhouse gas emissions by China</span> Emissions of gases harmful to the climate from China

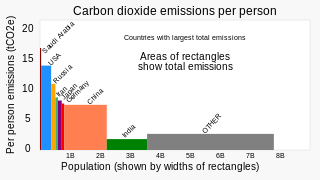
China's greenhouse gas emissions are the largest of any country in the world both in production and consumption terms, and stem mainly from coal burning, including coal power, coal mining, and blast furnaces producing iron and steel. When measuring production-based emissions, China emitted over 14 gigatonnes (Gt) CO2eq of greenhouse gases in 2019, 27% of the world total. When measuring in consumption-based terms, which adds emissions associated with imported goods and extracts those associated with exported goods, China accounts for 13 gigatonnes (Gt) or 25% of global emissions.

References

  1. "Australia's energy strategies and frameworks | energy.gov.au". www.energy.gov.au. Retrieved 24 October 2021.
  2. "Australian fossil fuel subsidies hit $10.3 billion in 2020-21". The Australia Institute. 25 April 2021. Retrieved 24 October 2021.
  3. World Coal Consumption by Country
  4. Cave, Damien (21 October 2021). "In Australia, It's 'Long Live King Coal'". The New York Times. ISSN   0362-4331 . Retrieved 24 October 2021.
  5. See Oak Ridge National Laboratory
  6. "Nuclear power in Australia: is it a good idea?". cosmosmagazine.com. 5 October 2021. Retrieved 18 June 2022.
  7. "An Australian model for the renewable-energy transition". www.lowyinstitute.org. Archived from the original on 8 July 2019. Retrieved 8 July 2019.
  8. "Fostering Effective Energy Transition 2019". Fostering Effective Energy Transition 2019. Archived from the original on 23 November 2021. Retrieved 8 July 2019.
  9. Reports of the Commission of Enquiry into Electricity Generation Planning in NSW, 4 vols, Sydney 1985.
  10. Industry Commission, Energy Generation and Distribution, 2 volumes, Canberra, 1991
  11. Hilmer Committee on National Competition Policy, 1995
  12. COAG, Canberra
  13. G Hodge et al, Power Progress: an Audit of Australia's Electricity Reform Experiment , Australian Scholarly Publishing, Melbourne, 2004.
  14. National Energy Market Reform Archived 1 June 2011 at the Wayback Machine . Department of Resources, Energy and Tourism.
  15. "Archived copy" (PDF). Archived from the original (PDF) on 16 December 2011. Retrieved 4 December 2011.{{cite web}}: CS1 maint: archived copy as title (link)
  16. Why is electricity consumption decreasing in Australia?
  17. OECD/IEA, p. 96
  18. 1 2 OECD/IEA, p. 95
  19. (17 April 2007). How solar ran out of puff. Sydney Morning Herald.
  20. IEA Wind Annual Report 2011. Boulder, Colorado, United States: IEA Wind. 2012. p. 186. ISBN   978-0-9786383-6-8. Archived from the original on 6 May 2013. Retrieved 23 February 2013.
  21. "Clean Energy Australia Report 2011". Clean Energy Council. Retrieved 23 February 2013.
  22. "2016 Australian energy statistics update" (PDF). Archived from the original (PDF) on 11 March 2018. Retrieved 23 October 2017.
  23. Australia looks to future with wave energy
  24. Queensland bans nuclear facilities Aleens Arthur Robinson Client Update: Energy. 1 March 2007. Retrieved 19 April 2007.
  25. Australias States React Strongly to Switkowski Report Hieros Gamos Worldwide Legal Directories 10 December 2006. Retrieved 19 April 2007.
  26. Support for Nuclear Power falls
  27. "Rudd romps to historic win". The Age . 25 November 2007. Archived from the original on 23 October 2012.
  28. "Scientists get hot rocks off over green nuclear power". The Sydney Morning Herald . 12 April 2007. Archived from the original on 24 September 2015.
  29. "Clean Coal and Renewable Energy". Martin Ferguson Press Release. 20 May 2008. Archived 26 May 2008 at the Wayback Machine
  30. "Energy Grants (Cleaner Fuels) Scheme Bill 2003". Archived from the original on 11 September 2006.{{cite journal}}: Cite journal requires |journal= (help)
  31. Biodiesel – fuel tax credits and fuel grant entitlements Archived 30 September 2007 at the Wayback Machine . Australian Taxation Office.
  32. "Biodiesel industry fearful of future after subsidy cuts". Australian Broadcasting Corporation.{{cite journal}}: Cite journal requires |journal= (help)
  33. "Alternative Fuels and Energy – Biodiesel Newsletter #6" (PDF). Archived from the original (PDF) on 29 August 2007.{{cite journal}}: Cite journal requires |journal= (help)
  34. OECD/IEA, pp. 24, 26
  35. Senate passes carbon tax [ dead link ] Guardian 8.11.2011
  36. "What the carbon tax repeal means for consumers". ABC News. 17 July 2014.
  37. 1 2 "Engineering Calculator". Basic Engineering Calculator.
  38. "The Importance of Coal in the Modern World – Australia". Gladstone Centre for Clean Coal. Archived from the original on 8 February 2007. Retrieved 17 March 2007.
  39. "Key World Energy Statistics – 2006 Edition" (PDF). International Energy Agency. 2006. Archived from the original (PDF) on 9 July 2007. Retrieved 11 July 2007.
  40. CSIRO's Climate Change Impacts on Australia and the Benefits of Early Action to Reduce Global Greenhouse Gas Emissions" "Archived copy" (PDF). Archived from the original (PDF) on 25 February 2009. Retrieved 25 January 2009.{{cite web}}: CS1 maint: archived copy as title (link)
  41. "at page 776" (PDF). Archived from the original (PDF) on 11 June 2017. Retrieved 13 May 2008.
  42. Nonviolent direct actions against coal – SourceWatch
  43. 1 2 3 4 5 How Australia blew its future gas supplies The Age 30 September 2017
  44. smh.com.au, 9 August 2002, Gas boom as China signs $25bn deal Sydney Morning Herald
  45. 1 2 Woodside signs China to biggest export deal yet Sydney Morning Herald
  46. The Age, 17 October 2015, Oils ain't oils, gas contracts ain't gas contracts The Age
  47. smh.com.au, 12 October 2015, East coast gas market has all the hallmarks of a cartel Sydney Morning Herald
  48. 1 2 3 Prime Minister Malcolm Turnbull meets gas producers over predicted shortfalls The Age
  49. "Index | Australia Pacific LNG".
  50. 1 2 3 4 "Santos diverts some gas slated for exports to shore up Australian supply". The Age . 7 September 2017. Archived from the original on 28 October 2017.
  51. ACCC, Gas inquiry 2017-2020
  52. Gas agreement struck, but transparency still a concern
  53. "APLNG joint venture to boost gas supply to east coast". The Age . 26 October 2017. Archived from the original on 27 October 2017.
  54. Energy supplies: When a solution is just a breakdown in logic
  55. Australians now paying 'desperation price' for gas, Orica boss says
  56. Cuevas-Cubria, Clara; Riwoe, Damien (December 2006). Australian Energy Projections 2029–30 (PDF). Australian Bureau of Agricultural and Resource Economics. ISBN   1-920925-81-3. ISSN   1447-817X. OCLC   814246018. OL   24814521M. Archived from the original (PDF) on 13 July 2009.{{cite book}}: |journal= ignored (help)
  57. Chris Riedy. "Energy And Transport Subsidies in Australia" (PDF). Institute for Sustainable Futures, University of Technology Sydney Report, 2007, for Greenpeace Australia Pacific. Archived from the original (PDF) on 24 July 2008. Retrieved 7 May 2007.
  58. Richard Webb (6 February 2001). The Petroleum Resource Rent Tax Archived 20 September 2006 at the Wayback Machine
  59. "Subsidies to Fossil Fuels are Undermining a Sustainable Future" (PDF). Archived from the original (PDF) on 29 August 2007.{{cite journal}}: Cite journal requires |journal= (help)
  60. "Securing Australia's Energy Future" (PDF). Archived from the original (PDF) on 30 October 2006. Retrieved 15 February 2007.
  61. Byrnes, L.; Brown, C.; Foster, J.; Wagner, L. (December 2013). "Australian renewable energy policy: Barriers and challenges". Renewable Energy. 60: 711–721. doi:10.1016/j.renene.2013.06.024.
  62. "Reform of Energy Markets" (PDF). Report to the Council of Australian Governments. 11 December 2003. Retrieved 16 April 2014.
  63. OECD/IEA, p. 31
  64. (17 July 2006). Victoria Leads Nation On Renewable Energy Target Archived 30 September 2011 at the Wayback Machine . Media Release from the Minister for the Environment, Minister For Energy And Resources.
  65. 1 2 (21 July 2010). Victoria targets solar energy as a new report shows renewable energy potential
  66. 1 2 (23 November 2008). NSW to introduce solar feed-in tariff Archived 5 July 2009 at the Wayback Machine . The Age. Fairfax Media.
  67. Byrnes, L.; Brown, C.; Wagner, L.; Foster, J. (June 2016). "Reviewing the viability of renewable energy in community electrification: The case of remote Western Australian communities" (PDF). Renewable and Sustainable Energy Reviews. 59: 470–481. doi:10.1016/j.rser.2015.12.273. hdl: 10072/99375 . S2CID   109833130.
  68. Office of the Renewable Energy Regulator: "Mandatory Renewable Energy Target" Archived 26 August 2010 at the Wayback Machine 24 February 2009
  69. Kevin Rudd's energy strategy 'flawed' says Productivity Commission Archived 25 May 2008 at the Wayback Machine "The Australian" 23 May 2008
  70. Davidson, Kenneth (29 November 2009). "Power giants crying foul? What a joke!". Fairfax Newspapers - Age, SMH, Brisbane Times. Retrieved 29 November 2009.
  71. http://www.greenhouse.gov.au/renewabletarget/index.html Archived 20 July 2008 at the Wayback Machine accessed 10 May 2008
  72. http://www.orer.gov.au/publications/pubs/mret-overview-feb08.pdf Archived 24 October 2009 at the Wayback Machine accessed 10 May 2008
  73. Australian Government: Office of the Renewable Energy Regulator Archived 2011-10-26 at the Wayback Machine
  74. Guy Pearse: Renewable Energy, in The Monthly, February 2011
  75. Power producers warn on emission targets Archived 26 May 2008 at the Wayback Machine "The Australian" 24 May 2008
  76. "A Renewable Energy Plan for South Australia" (PDF). RenewablesSA. Government of South Australia. 19 October 2011. Archived from the original (PDF) on 9 April 2013. Retrieved 9 March 2013.
  77. Renewable Energy News, retrieved 2009-11-02
  78. Australian Government: Office of the Renewable Energy Regulator Archived 26 October 2011 at the Wayback Machine
  79. Renewable Energy (Electricity) Amendment Bill 2015
  80. "Renewable Energy Target - History of the scheme". www.cleanenergyregulator.gov.au. 30 November 2016. Retrieved 26 July 2016.
  81. Annual statement—progress towards the 2020 target
  82. "ENERGY AND TRANSPORT SUBSIDIES IN AUSTRALIA" (PDF). Greenpeace. Archived from the original (PDF) on 24 July 2008.{{cite journal}}: Cite journal requires |journal= (help)
  83. First Annual World Environment Review Poll Reveals Countries Want Governments to Take Strong Action on Climate Change Archived 22 October 2013 at the Wayback Machine , GMI , published 2007-06-05, accessed 9 May 2007

Further reading