Observational error

Last updated

Observational error (or measurement error) is the difference between a measured value of a quantity and its unknown true value. [1] Such errors are inherent in the measurement process; for example lengths measured with a ruler calibrated in whole centimeters will have a measurement error of several millimeters. The error or uncertainty of a measurement can be estimated, and is specified with the measurement as, for example, 32.3 ± 0.5 cm. (A mistake or blunder in the measurement process will give an incorrect value, rather than one subject to known measurement error.)

Contents

Measurement errors can be divided into two components: random and systematic. [2] Random errors are errors in measurement that lead to measurable values being inconsistent when repeated measurements of a constant attribute or quantity are taken. Systematic errors are errors that are not determined by chance but are introduced by repeatable processes inherent to the system. [3] Systematic error may also refer to an error with a non-zero mean, the effect of which is not reduced when observations are averaged.[ citation needed ] For example, length measurements with a ruler accurately calibrated in whole centimeters will be subject to random error; a ruler incorrectly calibrated will also produce systematic error.

Measurement errors can be summarized in terms of accuracy and precision. Measurement error should not be confused with measurement uncertainty.

Science and experiments

When either randomness or uncertainty modeled by probability theory is attributed to such errors, they are "errors" in the sense in which that term is used in statistics; see errors and residuals in statistics.

Every time a measurement is repeated, slightly different results are ontained. The common statistical model used is that the error has two additive parts:

  1. Systematic error which always occurs, with the same value, when we use the instrument in the same way and in the same case.
  2. Random error which may vary from observation to another.

Systematic error is sometimes called statistical bias. It may often be reduced with standardized procedures. Part of the learning process in the various sciences is learning how to use standard instruments and protocols so as to minimize systematic error.

Distribution of measurements of known true value, with both constant systematic error and normally distributed random error. Measurement distribution with systematic and random errors.svg
Distribution of measurements of known true value, with both constant systematic error and normally distributed random error.

Random error (or random variation) is due to factors that cannot or will not be controlled. One possible reason to forgo controlling for these random errors is that it may be too expensive to control them each time the experiment is conducted or the measurements are made. Other reasons may be that whatever we are trying to measure is changing in time (see dynamic models), or is fundamentally probabilistic (as is the case in quantum mechanics — see Measurement in quantum mechanics). Random error often occurs when instruments are pushed to the extremes of their operating limits. For example, it is common for digital balances to exhibit random error in their least significant digit. Three measurements of a single object might read something like 0.9111g, 0.9110g, and 0.9112g.

Characterization

Measurement errors can be divided into two components: random error and systematic error. [2]

Random error is always present in a measurement. It is caused by inherently unpredictable fluctuations in the readings of a measurement apparatus or in the experimenter's interpretation of the instrumental reading. Random errors show up as different results for ostensibly the same repeated measurement. They can be estimated by comparing multiple measurements and reduced by averaging multiple measurements.

Systematic error is predictable and typically constant or proportional to the true value. If the cause of the systematic error can be identified, then it usually can be eliminated. Systematic errors are caused by imperfect calibration of measurement instruments or imperfect methods of observation, or interference of the environment with the measurement process, and always affect the results of an experiment in a predictable direction. Incorrect zeroing of an instrument is an example of systematic error in instrumentation.

The Performance Test Standard PTC 19.1-2005 "Test Uncertainty", published by the American Society of Mechanical Engineers (ASME), discusses systematic and random errors in considerable detail. In fact, it conceptualizes its basic uncertainty categories in these terms.

Random error can be caused by unpredictable fluctuations in the readings of a measurement apparatus, or in the experimenter's interpretation of the instrumental reading; these fluctuations may be in part due to interference of the environment with the measurement process. The concept of random error is closely related to the concept of precision. The higher the precision of a measurement instrument, the smaller the variability (standard deviation) of the fluctuations in its readings.

Sources

Sources of systematic error

Imperfect calibration

Sources of systematic error may be imperfect calibration of measurement instruments (zero error), changes in the environment which interfere with the measurement process and sometimes imperfect methods of observation can be either zero error or percentage error. If you consider an experimenter taking a reading of the time period of a pendulum swinging past a fiducial marker: If their stop-watch or timer starts with 1 second on the clock then all of their results will be off by 1 second (zero error). If the experimenter repeats this experiment twenty times (starting at 1 second each time), then there will be a percentage error in the calculated average of their results; the final result will be slightly larger than the true period.

Distance measured by radar will be systematically overestimated if the slight slowing down of the waves in air is not accounted for. Incorrect zeroing of an instrument is an example of systematic error in instrumentation.

Systematic errors may also be present in the result of an estimate based upon a mathematical model or physical law. For instance, the estimated oscillation frequency of a pendulum will be systematically in error if slight movement of the support is not accounted for.

Quantity

Systematic errors can be either constant, or related (e.g. proportional or a percentage) to the actual value of the measured quantity, or even to the value of a different quantity (the reading of a ruler can be affected by environmental temperature). When it is constant, it is simply due to incorrect zeroing of the instrument. When it is not constant, it can change its sign. For instance, if a thermometer is affected by a proportional systematic error equal to 2% of the actual temperature, and the actual temperature is 200°, 0°, or −100°, the measured temperature will be 204° (systematic error = +4°), 0° (null systematic error) or −102° (systematic error = −2°), respectively. Thus the temperature will be overestimated when it will be above zero and underestimated when it will be below zero.

Drift

Systematic errors which change during an experiment (drift) are easier to detect. Measurements indicate trends with time rather than varying randomly about a mean. Drift is evident if a measurement of a constant quantity is repeated several times and the measurements drift one way during the experiment. If the next measurement is higher than the previous measurement as may occur if an instrument becomes warmer during the experiment then the measured quantity is variable and it is possible to detect a drift by checking the zero reading during the experiment as well as at the start of the experiment (indeed, the zero reading is a measurement of a constant quantity). If the zero reading is consistently above or below zero, a systematic error is present. If this cannot be eliminated, potentially by resetting the instrument immediately before the experiment then it needs to be allowed by subtracting its (possibly time-varying) value from the readings, and by taking it into account while assessing the accuracy of the measurement.

If no pattern in a series of repeated measurements is evident, the presence of fixed systematic errors can only be found if the measurements are checked, either by measuring a known quantity or by comparing the readings with readings made using a different apparatus, known to be more accurate. For example, if you think of the timing of a pendulum using an accurate stopwatch several times you are given readings randomly distributed about the mean. Hopings systematic error is present if the stopwatch is checked against the 'speaking clock' of the telephone system and found to be running slow or fast. Clearly, the pendulum timings need to be corrected according to how fast or slow the stopwatch was found to be running.

Measuring instruments such as ammeters and voltmeters need to be checked periodically against known standards.

Systematic errors can also be detected by measuring already known quantities. For example, a spectrometer fitted with a diffraction grating may be checked by using it to measure the wavelength of the D-lines of the sodium electromagnetic spectrum which are at 600 nm and 589.6 nm. The measurements may be used to determine the number of lines per millimetre of the diffraction grating, which can then be used to measure the wavelength of any other spectral line.

Constant systematic errors are very difficult to deal with as their effects are only observable if they can be removed. Such errors cannot be removed by repeating measurements or averaging large numbers of results. A common method to remove systematic error is through calibration of the measurement instrument.

Sources of random error

The random or stochastic error in a measurement is the error that is random from one measurement to the next. Stochastic errors tend to be normally distributed when the stochastic error is the sum of many independent random errors because of the central limit theorem. Stochastic errors added to a regression equation account for the variation in Y that cannot be explained by the included Xs.

Surveys

The term "observational error" is also sometimes used to refer to response errors and some other types of non-sampling error. [1] In survey-type situations, these errors can be mistakes in the collection of data, including both the incorrect recording of a response and the correct recording of a respondent's inaccurate response. These sources of non-sampling error are discussed in Salant and Dillman (1994) and Bland and Altman (1996). [4] [5]

These errors can be random or systematic. Random errors are caused by unintended mistakes by respondents, interviewers and/or coders. Systematic error can occur if there is a systematic reaction of the respondents to the method used to formulate the survey question. Thus, the exact formulation of a survey question is crucial, since it affects the level of measurement error. [6] Different tools are available for the researchers to help them decide about this exact formulation of their questions, for instance estimating the quality of a question using MTMM experiments. This information about the quality can also be used in order to correct for measurement error. [7] [8]

Effect on regression analysis

If the dependent variable in a regression is measured with error, regression analysis and associated hypothesis testing are unaffected, except that the R2 will be lower than it would be with perfect measurement.

However, if one or more independent variables is measured with error, then the regression coefficients and standard hypothesis tests are invalid. [9] This is known as attenuation bias. [10]

See also

Related Research Articles

<span class="mw-page-title-main">Measurement</span> Process of assigning numbers to objects or events

Measurement is the quantification of attributes of an object or event, which can be used to compare with other objects or events. In other words, measurement is a process of determining how large or small a physical quantity is as compared to a basic reference quantity of the same kind. The scope and application of measurement are dependent on the context and discipline. In natural sciences and engineering, measurements do not apply to nominal properties of objects or events, which is consistent with the guidelines of the International vocabulary of metrology published by the International Bureau of Weights and Measures. However, in other fields such as statistics as well as the social and behavioural sciences, measurements can have multiple levels, which would include nominal, ordinal, interval and ratio scales.

<span class="mw-page-title-main">Statistics</span> Study of the collection, analysis, interpretation, and presentation of data

Statistics is the discipline that concerns the collection, organization, analysis, interpretation, and presentation of data. In applying statistics to a scientific, industrial, or social problem, it is conventional to begin with a statistical population or a statistical model to be studied. Populations can be diverse groups of people or objects such as "all people living in a country" or "every atom composing a crystal". Statistics deals with every aspect of data, including the planning of data collection in terms of the design of surveys and experiments.

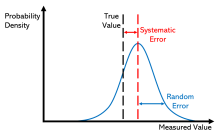
Accuracy and precision are two measures of observational error. Accuracy is how close a given set of measurements are to their true value, while precision is how close the measurements are to each other.

<span class="mw-page-title-main">Uncertainty</span> Situations involving imperfect or unknown information

Uncertainty or Incertitude refers to epistemic situations involving imperfect or unknown information. It applies to predictions of future events, to physical measurements that are already made, or to the unknown. Uncertainty arises in partially observable or stochastic environments, as well as due to ignorance, indolence, or both. It arises in any number of fields, including insurance, philosophy, physics, statistics, economics, finance, medicine, psychology, sociology, engineering, metrology, meteorology, ecology and information science.

<span class="mw-page-title-main">Vernier scale</span> Auxiliary scale of a measurement device, used to increase precision

A vernier scale, named after Pierre Vernier, is a visual aid to take an accurate measurement reading between two graduation markings on a linear scale by using mechanical interpolation, thereby increasing resolution and reducing measurement uncertainty by using vernier acuity to reduce human estimation error. It may be found on many types of instrument measuring linear or angular quantities, but in particular on a vernier caliper, which measures internal and external diameters.

Significant figures, also referred to as significant digits or sig figs, are specific digits within a number written in positional notation that carry both reliability and necessity in conveying a particular quantity. When presenting the outcome of a measurement, if the number of digits exceeds what the measurement instrument can resolve, only the number of digits within the resolution's capability are dependable and therefore considered significant.

<span class="mw-page-title-main">Dependent and independent variables</span> Concept in mathematical modeling, statistical modeling and experimental sciences

A variable is considered dependent if it depends on a independent variable. Dependent variables are studied under the supposition or demand that they depend, by some law or rule, on the values of other variables. Independent variables, in turn, are not seen as depending on any other variable in the scope of the experiment in question. In this sense, some common independent variables are time, space, density, mass, fluid flow rate, and previous values of some observed value of interest to predict future values.

In statistics and optimization, errors and residuals are two closely related and easily confused measures of the deviation of an observed value of an element of a statistical sample from its "true value". The error of an observation is the deviation of the observed value from the true value of a quantity of interest. The residual is the difference between the observed value and the estimated value of the quantity of interest. The distinction is most important in regression analysis, where the concepts are sometimes called the regression errors and regression residuals and where they lead to the concept of studentized residuals. In econometrics, "errors" are also called disturbances.

<span class="mw-page-title-main">Calibration curve</span> Method for determining the concentration of a substance in an unknown sample

In analytical chemistry, a calibration curve, also known as a standard curve, is a general method for determining the concentration of a substance in an unknown sample by comparing the unknown to a set of standard samples of known concentration. A calibration curve is one approach to the problem of instrument calibration; other standard approaches may mix the standard into the unknown, giving an internal standard. The calibration curve is a plot of how the instrumental response, the so-called analytical signal, changes with the concentration of the analyte.

In statistics, imputation is the process of replacing missing data with substituted values. When substituting for a data point, it is known as "unit imputation"; when substituting for a component of a data point, it is known as "item imputation". There are three main problems that missing data causes: missing data can introduce a substantial amount of bias, make the handling and analysis of the data more arduous, and create reductions in efficiency. Because missing data can create problems for analyzing data, imputation is seen as a way to avoid pitfalls involved with listwise deletion of cases that have missing values. That is to say, when one or more values are missing for a case, most statistical packages default to discarding any case that has a missing value, which may introduce bias or affect the representativeness of the results. Imputation preserves all cases by replacing missing data with an estimated value based on other available information. Once all missing values have been imputed, the data set can then be analysed using standard techniques for complete data. There have been many theories embraced by scientists to account for missing data but the majority of them introduce bias. A few of the well known attempts to deal with missing data include: hot deck and cold deck imputation; listwise and pairwise deletion; mean imputation; non-negative matrix factorization; regression imputation; last observation carried forward; stochastic imputation; and multiple imputation.

<span class="mw-page-title-main">Regression dilution</span> Statistical bias in linear regressions

Regression dilution, also known as regression attenuation, is the biasing of the linear regression slope towards zero, caused by errors in the independent variable.

Instrument error refers to the error of a measuring instrument, or the difference between the actual value and the value indicated by the instrument. There can be errors of various types, and the overall error is the sum of the individual errors.

In metrology, measurement uncertainty is the expression of the statistical dispersion of the values attributed to a measured quantity. All measurements are subject to uncertainty and a measurement result is complete only when it is accompanied by a statement of the associated uncertainty, such as the standard deviation. By international agreement, this uncertainty has a probabilistic basis and reflects incomplete knowledge of the quantity value. It is a non-negative parameter.

<span class="mw-page-title-main">Least count</span> Smallest value a measuring instrument can measure

In the science of measurement, the least count of a measuring instrument is the smallest value in the measured quantity that can be resolved on the instrument's scale. The least count is related to the precision of an instrument; an instrument that can measure smaller changes in a value relative to another instrument, has a smaller "least count" value and so is more precise. Any measurement made by the instrument can be considered repeatable to no less than the resolution of the least count. The least count of an instrument is inversely proportional to the precision of the instrument.

Experimental uncertainty analysis is a technique that analyses a derived quantity, based on the uncertainties in the experimentally measured quantities that are used in some form of mathematical relationship ("model") to calculate that derived quantity. The model used to convert the measurements into the derived quantity is usually based on fundamental principles of a science or engineering discipline.

<span class="mw-page-title-main">Errors-in-variables models</span> Regression models accounting for possible errors in independent variables

In statistics, errors-in-variables models or measurement error models are regression models that account for measurement errors in the independent variables. In contrast, standard regression models assume that those regressors have been measured exactly, or observed without error; as such, those models account only for errors in the dependent variables, or responses.

Industrial process data validation and reconciliation, or more briefly, process data reconciliation (PDR), is a technology that uses process information and mathematical methods in order to automatically ensure data validation and reconciliation by correcting measurements in industrial processes. The use of PDR allows for extracting accurate and reliable information about the state of industry processes from raw measurement data and produces a single consistent set of data representing the most likely process operation.

In statistics, linear regression is a linear approach for modelling a predictive relationship between a scalar response and one or more explanatory variables, which are measured without error. The case of one explanatory variable is called simple linear regression; for more than one, the process is called multiple linear regression. This term is distinct from multivariate linear regression, where multiple correlated dependent variables are predicted, rather than a single scalar variable. If the explanatory variables are measured with error then errors-in-variables models are required, also known as measurement error models.

References

  1. 1 2 Dodge, Y. (2003) The Oxford Dictionary of Statistical Terms, OUP. ISBN   978-0-19-920613-1
  2. 1 2 John Robert Taylor (1999). An Introduction to Error Analysis: The Study of Uncertainties in Physical Measurements. University Science Books. p. 94, §4.1. ISBN   978-0-935702-75-0.
  3. "Systematic error". Merriam-webster.com. Retrieved 2016-09-10.
  4. Salant, P.; Dillman, D. A. (1994). How to conduct your survey . New York: John Wiley & Sons. ISBN   0-471-01273-4.
  5. Bland, J. Martin; Altman, Douglas G. (1996). "Statistics Notes: Measurement Error". BMJ. 313 (7059): 744. doi:10.1136/bmj.313.7059.744. PMC   2352101 . PMID   8819450.
  6. Saris, W. E.; Gallhofer, I. N. (2014). Design, Evaluation and Analysis of Questionnaires for Survey Research (Second ed.). Hoboken: Wiley. ISBN   978-1-118-63461-5.
  7. DeCastellarnau, A. and Saris, W. E. (2014). A simple procedure to correct for measurement errors in survey research. European Social Survey Education Net (ESS EduNet). Available at: http://essedunet.nsd.uib.no/cms/topics/measurement Archived 2019-09-15 at the Wayback Machine
  8. Saris, W. E.; Revilla, M. (2015). "Correction for measurement errors in survey research: necessary and possible" (PDF). Social Indicators Research. 127 (3): 1005–1020. doi:10.1007/s11205-015-1002-x. hdl: 10230/28341 . S2CID   146550566.
  9. Hayashi, Fumio (2000). Econometrics. Princeton University Press. p. 187. ISBN   978-0-691-01018-2.
  10. Angrist, Joshua David; Pischke, Jörn-Steffen (2015). Mastering 'metrics : the path from cause to effect. Princeton, New Jersey: Princeton University Press. p. 221. ISBN   978-0-691-15283-7. OCLC   877846199. The bias generated by this sort of measurement error in regressors is called attenuation bias.

Further reading