South Pacific tropical cyclone

Last updated

A South Pacific tropical cyclone is a non-frontal, low pressure system that has developed, within an environment of warm sea surface temperatures and little vertical wind shear aloft in the South Pacific Ocean. [1] Within the Southern Hemisphere there are officially three areas where tropical cyclones develop on a regular basis, these areas are the South-West Indian Ocean between Africa and 90°E, the Australian region between 90°E and 160°E and the South Pacific basin between 160°E and 120°W. The South Pacific basin between 160°E and 120°W is officially monitored by the Fiji Meteorological Service and New Zealand's MetService, while others like the Australian Bureau of Meteorology and the United States National Oceanic and Atmospheric Administration also monitor the basin. Each tropical cyclone year within this basin starts on July 1 and runs throughout the year, encompassing the tropical cyclone season which runs from November 1 and lasts until April 30 each season. Within the basin, most tropical cyclones have their origins within the South Pacific Convergence Zone or within the Northern Australian monsoon trough, both of which form an extensive area of cloudiness and are dominant features of the season. Within this region a tropical disturbance is classified as a tropical cyclone, when it has 10-minute sustained wind speeds of more than 65 km/h (40 mph), that wrap halfway around the low-level circulation centre, while a severe tropical cyclone is classified when the maximum 10-minute sustained wind speeds are greater than 120 km/h (75 mph).

Contents

Basin history

Tropical cyclones have occurred over the southern Pacific Ocean since prehistoric times, with Polynesians and other ancient mariners having some knowledge of them. [2] These mariners were keen observers of nature with their knowledge of these systems, reflected by traditional myths and legends. [2] When Europeans started to settle and colonise the South Pacific, they realised that the region was not free of hurricanes were the first to publish accounts about the systems. [2] During 1853, Thomas Dobson subsequently became the first person to collect information about these systems, in order to attempt to understand and explain the characteristics of 24 tropical cyclones. [2] However, these descriptions were vague and of little value, because he only had a small amount of data and no synoptic weather charts. [2]

Over the next 40 years various reports, journals and logbooks on the storms were published, before E. Knipping consolidated some of these reports and extended Dobson's list out to 120 tropical cyclones during 1893. [2] During the 1920s Stephen Sargent Visher did some research into tropical cyclones in the Pacific and visited several island nations, including Fiji, Japan and the Philippines, to obtain information on potential systems. [3] He also consulted various journals and reports as well as Dobson's and Knipping's work, before he authored a number of papers on tropical cyclones in the Pacific. [3] These papers contained information about 259 tropical storms in the South Pacific between 160°E and 140°W, two of which occurred during 1789 and 1819, while the rest occurred between 1830 and 1923. [2] Visher also tried to estimate how many systems were occurring on an annual basis in each area, but overcompensated for his incomplete records and came up with a figure of 12 severe tropical cyclones per year. [2] [3]

In the years building up to World War II, Visher's work became the primary source for information about tropical cyclones in the South Pacific. However, there was not enough information available to allow for an accurate depiction of tropical cyclone tracks

During Visher's time and until the start of World War II, there was not enough. [2] However, in the build-up to and during World War II, meteorological operations in the Pacific were greatly expanded, to meet the needs of international aviation and military operations. [2] [4] As a result, J W Hutchings decided to write a paper on 43 tropical cyclones between 1940 and 1951, using data that had been collected from the tropics by the New Zealand Meteorological Service in the area between the 150°E and 150°W. [4] In the paper, systems were only included if they had a wind speed on the Beaufort scale of Force 9 or above (corresponding to a medium Category 1 on the Australian cyclone scale), while located between the Equator and 30°S. [4] Hutchings also examined where tropical cyclones originated from in the South Pacific and claimed that the place where most tropical cyclones develop could be accurately determined. [2] [4] The paper also drew attention to a marked difference in the tracks of South Pacific tropical cyclones and systems in other basins. [4] This work was subsequently extended in 1956, by the then director of the New Zealand Meteorological Service: John Fletcher Gabites, to cover the seasons between 1952–53 and 1955–56. [5] Gabites subsequently wrote a series of papers during 1963 on various aspects of South Pacific tropical cyclones including on the wide variety of tracks that occur over the Pacific. [2]

At the start of the 1980s, geostationary satellite imagery became available, which allowed meteorologists to closely monitor any developments and lowered the chances of missing a well developed tropical cyclone to nil. During June 1995, the Fiji Meteorological Service's Nadi — Tropical Cyclone Centre, was designated as a Regional Specialized Meteorological Center by the World Meteorological Organization.

Seasons

Before 1970

1970s

SeasonTotal
TDs
Total
TCs
Total
STCs
Strongest
storm
DeathsDamagesNotes and
References
1969–70 772Dolly and Emma65 million (USD) [6] [7] [8]
1970–71 880LenaUnknownUnknown [9]
1971–72 996CarlottaUnknownUnknown [10]
1972–73 882Bebe25$20 million (USD) [11]
1973–74 10102PamUnknownUnknown [9]
1974–75 553Val and AlisonUnknownUnknown [12] [10]
1975–76 663DavidUnknownUnknown [9]
1976–77 992RobertUnknownUnknown [7] [8]
1977–78 773Bob and CharlesUnknownUnknown [8]
1978–79 962MeliUnknownUnknown [13]
1979–80 872Peni and SinaUnknownUnknown [6] [8]

1980s

During the 1980s there were three major Southern Oscillation episodes; two El Niño's (1982–83 and 1986/87) when the Southern Oscillation Index (SOI) was negative and one La Nina when the SOI was positive. [14]

SeasonTotal
TDs
Total
TCs
Total
STCs
Strongest
storm
DeathsDamagesNotes and
References
1980–81 12124Freda [13] [14]
1981–82 665Gyan [15] [16]
1982–83 14149Oscar [14] [17]
1983–84 751Beti [18] [14]
1984–85 995Hina [14] [15] [19] [10]
1985–86 773Ima>150 [16]
1986–87 13126Uma50 [12] [11] [8] [14] [20]
1987–88 653Anne [6] [14] [17]
1988–89 14146Harry [14]
1989–90 1152Ofa8 [14]
Totals1039446Hina

1990s

SeasonTotal
TDs
Total
TCs
Total
STCs
Strongest
storm
DeathsDamagesRetired
names
Notes and
References
1990–91 421 Sina NoneSina [13]
1991–92 13117 Fran 21 Tia, Wasa, Val, Betsy, Esau, Fran [6] [17]
1992–93 12106Joni and PremaNoneJoni, Kina, Nina [6] [13]
1993–94 754TheodoreNone Rewa [9] [13]
1994–95 431VioletNoneWilliam [7] [21] [22]
1995–96 751Beti2Beti [18] [19] [23]
1996–97 14126 Gavin 27Drena, Gavin, Hina, Keli [note 1] [15]
1997–98 20167 Ron and Susan 50 Martin, Osea, Ron, Susan, Tui, Ursula, Veli [11] [17] [26]
1998–99 2784DaniCora, Frank [26] [27]
1999–2000 2564Kim1Kim [26] [28]
Totals1348041Ron/Susan101

2000s

During the 2000s, activity was generally below the long term average, with 60 tropical cyclones developing out of 160 tropical disturbances and tropical depressions. However activity during the 2002–03, 2004–05 and 2009–10 seasons all experienced activity, near the long term average of about 8 - 9 tropical cyclones.

SeasonTotal
TDs
Total
TCs
Total
STCs
Strongest
storm
DeathsDamages
(USD)
Retired namesNotes and
References
2000–01 1651 Paula 7 Paula, Sose [10]
2001–02 1652 Waka 1 Trina, Waka [15] [13]
2002–03 18107 Zoe 50 Zoe, Ami, Beni, Cilla [7] [26] [29]
2003–04 1532 Heta 16 Heta, Ivy [13]
2004–05 1895 Percy 2Meena, Nancy, Olaf, Percy [6] [7] [8] [26] [30]
2005–06 1553WatiNoneNone [12] [18] [31]
2006–07 1562 Xavier 4 Cliff [7] [8] [26]
2007–08 1643 Daman 8 Daman, Funa, Gene [26] [32]
2008–09 1560 Lin 11None [12] [18] [19] [10] [33]
2009–10 1585 Ului 12Mick, Oli, Pat, Tomas, Ului [6] [8] [17] [26]
Totals1596030Zoe111

2010s

SeasonTotal
TDs
Total
TCs
Total
STCs
Strongest
storm
DeathsDamages
(USD)
Retired namesNotes and
References
2010–11 1775 Wilma 4 Vania, Wilma, Yasi, Atu [26] [34] [note 2]
2011–12 2031 Jasmine 13None [18] [19] [10] [37]
2012–13 2254 Sandra 17 Evan, Freda [18] [13]
2013–14 2062 Ian 12 Ian, Lusi [16] [18] [13] [38]
2014–15 1662 Pam 16> Pam [39]
2015–16 1885 Winston 50 Ula, Winston [note 3] [41] [17]
2016–17 2242 Donna 3 Cook, Donna [18] [19]
2017–18 1463 Gita 11 Gita, Josie, Keni [10]
2018–19 1252PolaNonePola
2019–20 1284 Harold 5Sarai, Tino
Totals1665328Winston131≥ $2.25 billion

2020s

SeasonTotal
TDs
Total
TCs
Total
STCs
Strongest
storm
DeathsDamages
(USD)
Retired namesNotes and
References
2020–21 1383 Yasa 7>$246.7 million Yasa, Ana [19]
2021–22 1162 Dovi 2>$105 million Cody
2022–23 753 Kevin 16≥$9.42 billionJudy, Kevin Featuring the costliest tropical cyclone ever recorded in the basin, Gabrielle
2023–24 842 Lola 0>$0
Totals39239Kevin25>$9.717 billion

See also

Notes

  1. During the 1996–97 South Pacific cyclone season, 11 tropical cyclones formed within the FMS's area of responsibility, while one formed within the subtropics and TCWC Wellington's area of responsibility. [15] [13] [24] [25]
  2. Number of tropical cyclones excludes Tropical Cyclone Anthony, which was considered to have weakened into a tropical low before moving into the South Pacific basin by the Australian Bureau of Meteorology during post analysis. [35] [36]
  3. Number of tropical disturbances excludes Tropical Cyclone Raquel, which was considered by the Australian Bureau of Meteorology to be a Category 1 tropical cyclone within the 2014–15 year. [35] [40]

Related Research Articles

<span class="mw-page-title-main">Regional Specialized Meteorological Centre</span>

A Regional Specialized Meteorological Centre (RSMC) is responsible for the distribution of information, advisories, and warnings regarding the specific program they have a part of, agreed by consensus at the World Meteorological Organization as part of the World Weather Watch.

<span class="mw-page-title-main">2007–08 South Pacific cyclone season</span> Tropical cyclone season

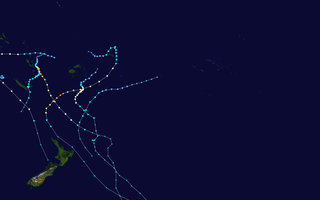
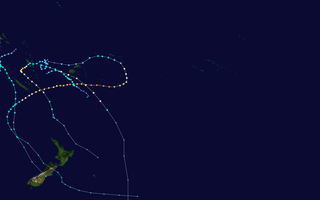
The 2007–08 South Pacific cyclone season was one of the least active South Pacific tropical cyclone seasons on record, with only four tropical cyclones occurring within the South Pacific basin to the east of 160°E. The season officially ran from November 1, 2007, until April 30, 2008, although the first cyclone, Tropical Depression 01F, developed on October 17. The most intense tropical cyclone of the season was Severe Tropical Cyclone Daman, which reached a minimum pressure of 925 hPa (27.32 inHg) as it affected Fiji. After the season had ended, the names Daman, Funa, and Gene were retired from the tropical cyclone naming lists.

<span class="mw-page-title-main">2006–07 South Pacific cyclone season</span> Tropical cyclone season

The 2006–07 South Pacific cyclone season was an event in the annual cycle of tropical cyclone formation. It began on November 1, 2006 and ended on April 30, 2007. These dates conventionally delimit the period of each year when most tropical cyclones form in the southern Pacific Ocean east of 160°E. Additionally, the regional tropical cyclone operational plan defines a tropical cyclone year separately from a tropical cyclone season, and the "tropical cyclone year" runs from July 1, 2006 to June 30, 2007.

<span class="mw-page-title-main">2003–04 South Pacific cyclone season</span> Tropical cyclone season

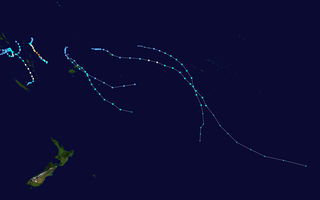
The 2003–04 South Pacific cyclone season was a below-average season with only three tropical cyclones occurring within the South Pacific to the east of 160°E. The season officially ran from November 1, 2003 to April 30, 2004 with the first disturbance of the season forming on December 4 and the last disturbance dissipating on April 23. This is the period of the year when most tropical cyclones form within the South Pacific Ocean.

<span class="mw-page-title-main">2002–03 South Pacific cyclone season</span> Tropical cyclone season

The 2002–03 South Pacific cyclone season was the most active and longest tropical cyclone season since 1997–98, with ten tropical cyclones occurring within the South Pacific basin between 160°E and 120°W. The season started earlier than normal, with two systems developing before the official start of the season on November 1, 2002, while the final system dissipated on June 9, 2003, after the season had officially ended on April 30. During the season, tropical cyclones were officially monitored by the Regional Specialized Meteorological Centre (RSMC) in Nadi, Fiji and the Tropical Cyclone Warning Centres in Brisbane, Australia and Wellington, New Zealand. The United States Armed Forces through the Joint Typhoon Warning Center (JTWC), also monitored the basin and issued unofficial warnings for American interests. RSMC Nadi attaches a number and an F suffix to tropical disturbances that occur within the basin, while the JTWC designates significant tropical cyclones with a number and a P suffix. RSMC Nadi, TCWC Wellington and TCWC Brisbane all use the Australian Tropical Cyclone Intensity Scale and estimate windspeeds over a ten-minute period, while the JTWC estimates sustained winds over a one-minute period, which are subsequently compared to the Saffir–Simpson Hurricane Scale (SSHS).

<span class="mw-page-title-main">2008–09 South Pacific cyclone season</span> Tropical cyclone season

The 2008–09 South Pacific cyclone season was a below average tropical cyclone season, which featured six named tropical cyclones compared to an average of about nine. Ahead of the season officially starting on November 1, 2008, the Island Climate Update tropical cyclone outlook predicted that the season, would feature an average risk of tropical cyclones impacting the South Pacific between 160°E and 120°W. The first tropical disturbance of the season developed to the northeast of the Samoan Islands on December 1, however, it remained weak and was last noted during the next day.

<span class="mw-page-title-main">Cyclone Gene</span> Category 3 South Pacific cyclone in 2008

Severe Tropical Cyclone Gene was the deadliest storm as well as the most damaging tropical cyclone of the 2007–08 South Pacific cyclone season east of 160ºE. RSMC Nadi monitored Gene as the 12th tropical disturbance, as well as the fourth tropical cyclone and the third severe tropical cyclone to form west of 160ºE during the 2007–08 South Pacific cyclone season. Gene was also recognised by RSMC Nadi as the fifth tropical cyclone and fourth severe tropical cyclone to form within the South Pacific Ocean during the 2007-08 season.

<span class="mw-page-title-main">2009–10 South Pacific cyclone season</span> Tropical cyclone season

The 2009–10 South Pacific cyclone season began on December 3, 2009 with the formation of Tropical Disturbance 01F, 32 days after the cyclone season had officially begun on November 1, 2009. The season ended on April 30, 2010. These dates conventionally delimit the period of each year when most tropical cyclones form in the southern Pacific Ocean east of 160°E. Additionally, the regional tropical cyclone operational plan defines a tropical cyclone year separately from a tropical cyclone season; the "tropical cyclone year" began on July 1, 2009 and ended on June 30, 2010. Tropical cyclones between 160°E and 120°W and north of 25°S are monitored by the Fiji Meteorological Service. Those that move south of 25°S are monitored by the Tropical Cyclone Warning Centre in Wellington, New Zealand. The first tropical disturbance of the season formed on December 3, about 1015 km (700 mi) to the north of Suva, Fiji and later intensified into Tropical Cyclone Mick. The last system, 15F, dissipated on April 5 of the following year.

<span class="mw-page-title-main">2010–11 South Pacific cyclone season</span> Tropical cyclone season

The 2010–11 South Pacific cyclone season was an average tropical cyclone season, with seven tropical cyclones and five severe tropical cyclones developing during the season. The season ran from November 1, 2010 until April 30, 2011, though if any tropical cyclones had developed between July 1, 2010 and June 30, 2011, the official tropical cyclone year, they would have been counted towards the season's total. Within the South Pacific basin tropical cyclones were officially monitored by the Fiji Meteorological Service's Regional Specialized Meteorological Center in Nadi, Fiji, north of 25°S, and to the south the Meteorological Service of New Zealand's Tropical Cyclone Warning Center in Wellington, New Zealand. Any disturbances forming in the region were designated with a sequential number suffixed by the letter F. In addition, the United States Military's Joint Typhoon Warning Center unofficially monitored parts of the basin during the season, where any systems judged to have achieved tropical storm strength or greater received a number suffixed with the letter P. RSMC Nadi and TCWC Wellington both use the Australian Tropical Cyclone Intensity Scale, and measure wind speeds over a period of ten minutes, while the JTWC measures sustained winds over a period of one minute which can be applied to the Saffir–Simpson hurricane scale. Seven named storms formed or moved into the South Pacific basin during the 2010–11 season, the strongest of which was Severe Tropical Cyclone Wilma in late January.

<span class="mw-page-title-main">2011–12 South Pacific cyclone season</span> Tropical cyclone season

The 2011–12 South Pacific cyclone season was one of the least active South Pacific tropical cyclone seasons on record, with only three tropical cyclones occurring during the season. The season ran from November 1, 2011, to April 30, 2012, however, any tropical cyclones that form before June 30, 2012, would have fallen within the 2011–12 tropical cyclone year and would have counted towards the season total. The strongest and only severe tropical cyclone that occurred during the season was Severe Tropical Cyclone Jasmine, which tracked in from out of the South Pacific basin. Within the basin, tropical cyclones are monitored by the Regional Specialized Meteorological Center (RSMC) in Nadi, Fiji, and the Tropical Cyclone Warning Center (TCWC) in Wellington, New Zealand. RSMC Nadi attaches an F designation to tropical disturbances that form in or move into the South Pacific. The United States Joint Typhoon Warning Center (JTWC) issues unofficial warnings within the South Pacific, designating tropical storm-equivalent or greater tropical cyclones with a number and a P suffix. RSMC Nadi and TCWC Wellington both use the Australian Tropical Cyclone Intensity Scale, and measure windspeeds over a period of ten minutes, while the JTWC measures sustained winds over a period of one minute and uses the Saffir–Simpson hurricane scale.

<span class="mw-page-title-main">2012–13 South Pacific cyclone season</span> Tropical cyclone season

The 2012–13 South Pacific cyclone season was a below average tropical cyclone season, with five tropical cyclones occurring within the basin between 160°E and 120°W. The season officially ran from November 1, 2012, to April 30, 2013, however the last tropical disturbance was last noted on May 1, as it moved into the subtropics. During the season, tropical cyclones were officially monitored by the Fiji Meteorological Service (FMS), Australian Bureau of Meteorology (BoM) and New Zealand's MetService. The United States Joint Typhoon Warning Center (JTWC) and other national meteorological services including Météo-France and NOAA also monitored the basin during the season. During the season there were 22 significant tropical disturbances assigned a number and a F suffix by the FMS's Regional Specialized Meteorological Center in Nadi, Fiji (RSMC Nadi), including Severe Tropical Cyclone Sandra which moved into the basin from the Australian region on March 9. The BoM, MetService and RSMC Nadi all estimated sustained wind speeds over a period of 10-minutes and used the Australian tropical cyclone intensity scale, while the JTWC estimated sustained winds over a 1-minute period, which are subsequently compared to the Saffir–Simpson hurricane wind scale (SSHS).

<span class="mw-page-title-main">Cyclone Vania</span>

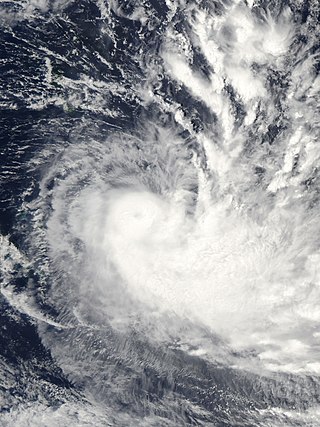
Tropical Cyclone Vania was the third depression and first tropical cyclone of the 2010–11 South Pacific cyclone season.

<span class="mw-page-title-main">1995–96 South Pacific cyclone season</span> Tropical cyclone season

The 1995–96 South Pacific cyclone season was a below average South Pacific tropical cyclone season's on record, with only five tropical cyclones occurring within the South Pacific Ocean to the east of 160°E. The season officially ran from November 1, 1995, until April 30, 1996. The first storm developed on January 12, while the last one dissipated on April 2. During the season the most intense tropical cyclone was Severe Tropical Cyclone Beti, which reached a minimum pressure of 935 hPa (27.61 inHg) as it affected New Caledonia. After the season ended Beti's name was the only name to be retired from the tropical cyclone naming lists and was replaced with Bune, after it inflicted over 5.6 million (USD) worth of damage to Australia, Vanuatu, New Caledonia and New Zealand.

<span class="mw-page-title-main">2013–14 South Pacific cyclone season</span> Tropical cyclone season

The 2013–14 South Pacific cyclone season was a slightly below average tropical cyclone season, with six tropical cyclones occurring within the basin between 160°E and 120°W. The season ran from November 1, 2013, to April 30, 2014, however, the first four tropical disturbances occurred during October 2013 and were included as a part of the season. During the season, tropical cyclones were officially monitored by the Fiji Meteorological Service (FMS), Australian Bureau of Meteorology (BoM) and New Zealand's MetService. The United States Joint Typhoon Warning Center (JTWC) and other national meteorological services including Météo-France and NOAA also monitored the basin during the season. During the season there were 21 significant tropical disturbances were assigned a number and an "F" suffix by the FMS's Regional Specialized Meteorological Center in Nadi, Fiji (RSMC Nadi), including the remnants of Tropical Cyclone Hadi from the Australian region. The BoM, MetService and RSMC Nadi all estimated sustained wind speeds over a period of 10-minutes and used the Australian tropical cyclone intensity scale, while the JTWC estimated sustained winds over a 1-minute period, which are subsequently compared to the Saffir–Simpson hurricane wind scale (SSHS).

<span class="mw-page-title-main">2014–15 South Pacific cyclone season</span> Tropical cyclone season

The 2014–15 South Pacific cyclone season was a slightly-below average tropical cyclone season, with five tropical cyclones occurring within the basin between 160°E and 120°W. The season officially ran from November 1, 2014, to April 30, 2015. During the season, tropical cyclones were officially monitored by the Regional Specialized Meteorological Center (RSMC) in Nadi, Fiji and the Tropical Cyclone Warning Centers in Brisbane, Australia and Wellington, New Zealand. The United States Armed Forces through the Joint Typhoon Warning Center (JTWC) also monitored the basin and issued unofficial warnings for American interests. RSMC Nadi attaches a number and an F suffix to tropical disturbances that form in or move into the basin while the JTWC designates significant tropical cyclones with a number and a P suffix. RSMC Nadi, TCWC Wellington and TCWC Brisbane all use the Australian Tropical Cyclone Intensity Scale and estimate windspeeds over a period of ten minutes, while the JTWC estimated sustained winds over a 1-minute period, which are subsequently compared to the Saffir–Simpson hurricane wind scale (SSHWS).

<span class="mw-page-title-main">2015–16 South Pacific cyclone season</span> Tropical cyclone season

The 2015–16 South Pacific cyclone season was one of the most disastrous South Pacific tropical cyclone seasons on record, with a total of 50 deaths and $1.405 billion in damage. Throughout the season, 8 systems attained tropical cyclone status, whilst 5 became severe tropical cyclones. The most notable cyclone of the season by far was Winston, which attained a minimum pressure of 884 hPa, and maximum ten-minute sustained winds of 175 mph (280 km/h), making it the most intense tropical cyclone on record in the Southern Hemisphere. Winston went on to devastate Fiji, causing $1.4 billion in damage and 44 deaths across the country.

<span class="mw-page-title-main">2016–17 South Pacific cyclone season</span> Tropical cyclone season

The 2016–17 South Pacific cyclone season was the least active South Pacific cyclone season since the 2011–12 season, with only four tropical cyclones occurring within the South Pacific Ocean to the east of 160°E. Two of the four systems developed into severe tropical cyclones on the Australian tropical cyclone intensity scale. The season officially ran from November 1, 2016 until April 30, 2017. However, May featured two post-season systems: Donna and Ella, of which the former was the strongest post-season South Pacific tropical cyclone ever recorded in that month. Overall, 22 tropical disturbances were monitored by a combination of the Fiji Meteorological Service (FMS), Australian Bureau of Meteorology (BoM) and New Zealand's MetService.

<span class="mw-page-title-main">2017–18 South Pacific cyclone season</span> Tropical cyclone season

The 2017–18 South Pacific cyclone season was a slightly below-average season that produced 6 tropical cyclones, 3 of which became severe tropical cyclones. The season officially began on November 1, 2017, and ended on April 30, 2018; however, a tropical cyclone could form at any time between July 1, 2017, and June 30, 2018, and would count towards the season total. During the season, tropical cyclones were officially monitored by the Fiji Meteorological Service, MetService and the Australian Bureau of Meteorology, while the United States Joint Typhoon Warning Center (JTWC) also monitored the basin and issued warnings for American interests. The FMS attaches a number and an F suffix to significant tropical disturbances that form in or move into the basin, while the JTWC designates significant tropical cyclones with a number and a P suffix. The BoM, FMS and MetService all use the Australian Tropical Cyclone Intensity Scale and estimate wind speeds over a period of ten minutes, while the JTWC estimates sustained winds over a 1-minute period, which are subsequently compared to the Saffir–Simpson hurricane wind scale (SSHWS).

<span class="mw-page-title-main">2018–19 South Pacific cyclone season</span> Tropical cyclone season

The 2018–19 South Pacific cyclone season was a below-average season that produced 5 tropical cyclones, 2 of which became severe tropical cyclones. The season officially runs from November 1, 2018, to April 30, 2019; however, a tropical cyclone could have formed at any time between July 1, 2018, and June 30, 2019, and would count towards the season total. During the season, tropical cyclones were officially monitored by the Fiji Meteorological Service, Australian Bureau of Meteorology, and New Zealand's MetService. The United States Armed Forces through the Joint Typhoon Warning Center (JTWC) also monitored the basin and issued warnings for American interests. RSMC Nadi attaches a number and an F suffix to tropical disturbances that form in or move into the basin, while the JTWC designates significant tropical cyclones with a number and a P suffix. The FMS, the BoM and MetService all use the Australian Tropical Cyclone Intensity Scale and estimate wind speeds over a period of ten minutes, while the JTWC estimates sustained winds over a 1-minute period, which are subsequently compared to the Saffir–Simpson hurricane wind scale (SSHWS).

<span class="mw-page-title-main">Cyclone Lusi</span>

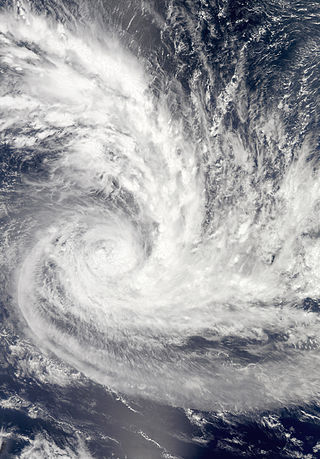
Severe Tropical Cyclone Lusi was the second severe tropical cyclone of the 2013–14 season and affected Fiji, Vanuatu and New Zealand.

References

  1. RA V Tropical Cyclone Committee (2023). Tropical Cyclone Operational Plan for the South-East Indian Ocean and the Southern Pacific Ocean 2023 (PDF) (Report). World Meteorological Organization. Retrieved October 23, 2023.
  2. 1 2 3 4 5 6 7 8 9 10 11 12 Kerr, Ian S (March 1, 1976). "Tropical Storms and Hurricanes in the Southwest Pacific: November 1939 to May 1969" (PDF). pp. 23–28. Archived (PDF) from the original on April 13, 2014. Retrieved August 11, 2013.
  3. 1 2 3 Visher, Stephen Sargent (June 1922). "Tropical Cyclones in Australia and the South Pacific and Indian Oceans" (PDF). Monthly Weather Review. 50 (6): 288–295. Bibcode:1922MWRv...50..288V. doi: 10.1175/1520-0493(1922)50<288:TCIAAT>2.0.CO;2 .
  4. 1 2 3 4 5 Hutchings, J.W (April 1953). "Tropical Cyclones in the Southwest Pacific". New Zealand Geographer. 9 (1): 37–57. doi:10.1111/j.1745-7939.1953.tb01823.x.
  5. http://docs.niwa.co.nz/library/public/nzmstic107.pdf [ bare URL PDF ]
  6. 1 2 3 4 5 6 7 RSMC Nadi – Tropical Cyclone Centre (October 18, 2012). "2012/13 Tropical Cyclone Season Outlook in the Regional Specialised Meteorological Centre Nadi – Tropical Cyclone Centre Area of Responsibility" (PDF). Fiji Meteorological Service. p. 2. Archived (PDF) from the original on October 19, 2012. Retrieved October 18, 2012.
  7. 1 2 3 4 5 6 RSMC Nadi – Tropical Cyclone Centre (October 15, 2014). "2014/15 Tropical Cyclone Season Outlook in the Regional Specialised Meteorological Centre Nadi – Tropical Cyclone Centre Area of Responsibility" (PDF). Fiji Meteorological Service. p. 2. Archived (PDF) from the original on October 27, 2014. Retrieved October 27, 2014.
  8. 1 2 3 4 5 6 7 8 "2018–19 Tropical Cyclone Season Outlook [in the] Regional Specialised Meteorological Centre Nadi – Tropical Cyclone Centre (RSMC Nadi – TCC) Area of Responsibility (AOR)" (PDF). Fiji Meteorological Service. October 23, 2018. Archived (PDF) from the original on October 23, 2018. Retrieved October 23, 2018.
  9. 1 2 3 4 Climate Services Division (October 26, 2010). Tropical Cyclone Guidance for Season 2010/11 for the Fiji and the Southwest Pacific (PDF) (Report). Fiji Meteorological Service. Archived (PDF) from the original on May 19, 2024. Retrieved May 19, 2024.
  10. 1 2 3 4 5 6 7 2022–23 Tropical Cyclone Season Outlook in the Regional Specialised Meteorological Centre Nadi – Tropical Cyclone Centre (RSMC Nadi – TCC) Area of Responsibility (AOR) (PDF) (Report). Fiji Meteorological Service. October 13, 2022. Archived (PDF) from the original on October 21, 2022. Retrieved February 28, 2023.
  11. 1 2 3 "2015–16 Tropical Cyclone Season Outlook in the Regional Specialised Meteorological Centre Nadi – Tropical Cyclone Centre (RSMC Nadi – TCC) Area of Responsibility (AOR)" (PDF). Fiji Meteorological Service. October 22, 2015. Archived from the original (PDF) on November 23, 2015. Retrieved October 22, 2015.
  12. 1 2 3 4 RSMC Nadi — Tropical Cyclone Centre (October 27, 2011). "2011–12 Tropical Cyclone Season Outlook in the Regional Specialised Meteorological Centre Nadi – Tropical Cyclone Centre (RSMC Nadi – TCC) Area of Responsibility (AOR)" (PDF). Fiji Meteorological Service. Archived from the original (PDF) on October 28, 2011. Retrieved October 28, 2011.
  13. 1 2 3 4 5 6 7 8 9 10 "2019–20 Tropical Cyclone Season Outlook [in the] Regional Specialised Meteorological Centre Nadi – Tropical Cyclone Centre (RSMC Nadi – TCC) Area of Responsibility (AOR)" (PDF). Fiji Meteorological Service. October 11, 2019. Archived (PDF) from the original on October 11, 2019. Retrieved October 11, 2019.
  14. 1 2 3 4 5 6 7 8 9 Thompson, Craig; Ready, Stephen; Zheng, Xiaogu (1992). Tropical Cyclones in the Southwest Pacific: November 1979 – May 1989 (PDF). New Zealand Meteorological Service, (Meteorological Service of New Zealand Limited, National Institute of Water and Atmospheric Research). ISBN   0-477-07346-8. Archived (PDF) from the original on July 2, 2015. Retrieved May 10, 2012.
  15. 1 2 3 4 5 RSMC Nadi – Tropical Cyclone Centre (October 11, 2013). "2013/14 Tropical Cyclone Season Outlook in the Regional Specialised Meteorological Centre Nadi – Tropical Cyclone Centre Area of Responsibility" (PDF). Fiji Meteorological Service. p. 2. Archived (PDF) from the original on October 21, 2013. Retrieved October 15, 2013.
  16. 1 2 3 "2016–17 Tropical Cyclone Season Outlook in the Regional Specialised Meteorological Centre Nadi – Tropical Cyclone Centre (RSMC Nadi – TCC) Area of Responsibility (AOR)" (PDF). Fiji Meteorological Service. October 14, 2016. Archived (PDF) from the original on October 30, 2016. Retrieved October 29, 2016.
  17. 1 2 3 4 5 6 "Regional Specialised Meteorological Centre Nadi – Tropical Cyclone Centre (RSMC Nadi – TCC) Tropical Cyclone Seasonal Outlook 2023–24 Detailed Outlook" (PDF). Fiji Meteorological Service. October 12, 2023. Archived (PDF) from the original on October 12, 2023. Retrieved October 12, 2023.
  18. 1 2 3 4 5 6 7 8 "2017–18 Tropical Cyclone Season Outlook in the Regional Specialised Meteorological Centre Nadi – Tropical Cyclone Centre (RSMC Nadi – TCC) Area of Responsibility (AOR)" (PDF). Fiji Meteorological Service. October 11, 2017. Archived (PDF) from the original on October 11, 2017. Retrieved October 11, 2017.
  19. 1 2 3 4 5 6 "2021/22 Regional Specialized Meteorological Centre Nadi: Tropical Cyclone Seasonal Outlook" (PDF). Fiji Meteorological Service. October 13, 2021. Archived (PDF) from the original on October 13, 2021. Retrieved October 14, 2021.
  20. Revell, Cliff G (1987). "The 1986/87 Hurricane Season in the South Pacific" (PDF). Weather and Climate. 7 (2). The Meteorological Society of New Zealand: 38–54. doi:10.2307/44279737. JSTOR   44279737. Archived from the original (PDF) on 2013-12-03.
  21. Shepherd, I.J; Bates, P.W (June 2, 1997). "The South Pacific and Southeast Indian Ocean Tropical Cyclone Season 1994–95" (PDF). Australian Meteorological Magazine (46). Australian Bureau of Meteorology: 143–151. Retrieved May 14, 2011.
  22. Barr, Joe (September 17, 2008). "Event Information: Tropical Cyclone William". Pacific Disaster.Net. Archived from the original on April 22, 2012. Retrieved June 2, 2011.
  23. Callaghan, Jeff (December 4, 1997). "The South Pacific and Southeast Indian Ocean Tropical Cyclone Season 1995–96" (PDF). Australian Meteorological and Oceanographic Journal. 46. Australian Bureau of Meteorology: 325–339. Archived (PDF) from the original on March 21, 2012. Retrieved July 25, 2012.
  24. TCWC Wellington; TCWC Brisbane (May 22, 2009). "RSMC Nadi — Tropical Cyclone Centre Best Track Data for 1996/97 Cyclone Season". Fiji Meteorological Service, Meteorological Service of New Zealand Limited, Australian Bureau of Meteorology. United States: International Best Track Archive for Climate Stewardship. Retrieved January 31, 2013.
  25. "Matt Megan's World". The Manawatu Standard. Palmerston North, New Zealand. April 2, 1997. p. 3.  via Lexis Nexis (subscription required)
  26. 1 2 3 4 5 6 7 8 9 Padgett, Gary (1997–2011). "Monthly Global Tropical Cyclone Summaries". Archived from the original on December 30, 2019. Retrieved July 25, 2012. Alt URL
  27. RSMC Nadi Tropical Cyclone Seasonal Summary 1998–99 (PDF) (Report). Fiji Meteorological Service. 1999. Archived from the original (PDF) on August 1, 2010. Retrieved July 25, 2012.
  28. RSMC Nadi Tropical Cyclone Seasonal Summary 1999–2000 (PDF) (Report). Fiji Meteorological Service. 2000. Archived from the original (PDF) on February 19, 2012. Retrieved July 25, 2012.
  29. "Tropical Cyclone Seasonal Summary 2002–03" (PDF). Fiji Meteorological Service. Archived from the original (PDF) on October 1, 2008. Retrieved June 27, 2010.
  30. Tropical Cyclone Summary 2004 — 2005 Season (PDF) (Report). Fiji Meteorological Service. Archived from the original (PDF) on February 25, 2009. Retrieved April 16, 2012.
  31. "Tropical Cyclone Season Summary: 2005–2006 Season" (PDF). Fiji Meteorological Service. Archived from the original (PDF) on October 1, 2008. Retrieved May 12, 2009.
  32. Fiji Meteorological Service (2008). Tropical Cyclone Seasonal Summary 2007–08 (Report). World Meteorological Organization. Retrieved February 26, 2012.
  33. RSMC Nadi – Tropical Cyclone Centre (September 24, 2012). Tropical Cyclone Season Summary 2008–09. Fiji Meteorological Service (Report). World Meteorological Organization's Tropical Cyclone Project. Retrieved October 21, 2012.
  34. Climate Services Division (May 11, 2012). Fiji Islands Climate Summary April 2011 Volume 32 Issue 04 (PDF) (Report). Fiji Meteorological Service. Archived from the original (PDF) on February 17, 2012. Retrieved March 3, 2012.
  35. 1 2 "Australian Tropical Cyclone Database" (CSV). Australian Bureau of Meteorology. 2023-06-30. Retrieved 2023-06-30. A guide on how to read the database is available here.
  36. Auden, Tony (June 21, 2011). Tropical Cyclone Anthony: January 23 – 31, 2011 (PDF) (Report). Australian Bureau of Meteorology's Brisbane Tropical Cyclone Warning Centre. Retrieved December 13, 2014.
  37. Young, Steve (January 14, 2013). "Southern Hemisphere 2011–2012 Tropical Cyclone Season Review". Australian Severe Weather. Archived from the original on April 13, 2014. Retrieved January 17, 2013.
  38. Young, Steve (July 24, 2014). "Southern Hemisphere 2013–2014 Tropical Cyclone Season Review". Australian Severe Weather. Archived from the original on November 5, 2014. Retrieved October 27, 2014.
  39. Climate Services Division (August 18, 2015). Fiji Annual Climate Summary: 2014 (PDF) (Report). Fiji Meteorological Service. Archived from the original (PDF) on March 4, 2016. Retrieved August 28, 2015.
  40. Queensland Regional Office (September 2015). Tropical Cyclone Raquel: January 23 – 31, 2011 (Report). Australian Bureau of Meteorology. Retrieved September 15, 2015.
  41. 2016/17 tropical cyclone season to officially end on April 30 (PDF) (Report). Fiji Meteorological Service. April 27, 2017. Archived from the original (PDF) on October 12, 2017. Retrieved May 3, 2017.