Climate of North Carolina

Last updated
Koppen climate types of North Carolina, using 1991-2020 climate normals. Koppen Climate Types North Carolina.png
Köppen climate types of North Carolina, using 1991-2020 climate normals.

North Carolina's climate varies from the Atlantic coast in the east to the Appalachian Mountain range in the west. The mountains often act as a "shield", blocking low temperatures and storms from the Midwest from entering the Piedmont of North Carolina. [1]

Contents

Most of the state has a humid subtropical climate (Köppen climate classification Cfa), except in the higher elevations of the Appalachians which have a subtropical highland climate (Köppen Cfb).

The USDA Hardiness Zones for the state range from Zone 5B (-15 °F to -10 °F) in the mountains to Zone 9A (20 °F to 25 °F) along the easternmost portions of the coast. [2] For most areas in the state, the temperatures in July during the daytime are approximately 90 °F (32 °C). In January, the average temperatures range near 50 °F (10 °C). [3]

Precipitation

There is an average of forty-five inches of rain a year (fifty inches in mountainous regions). July storms account for much of this precipitation. As much as 15% of the rainfall during the warm season in the Carolinas can be attributed to tropical cyclones. [4] Mountains usually see some snow in the fall and winter. [1] Moist winds from the southwest drop an average of 80 inches (2,000 mm) of precipitation on the western side of the mountains, while the northeast-facing slopes average less than half that amount. [5]

Average monthly precipitation
CityJanFebMarAprMayJunJulAugSepOctNovDecTotal
Asheville [6] 2.6 inches (66 mm)3.1 inches (79 mm)4 inches (100 mm)3.3 inches (84 mm)2.9 inches (74 mm)3.5 inches (89 mm)3.4 inches (86 mm)4 inches (100 mm)3.1 inches (79 mm)2.7 inches (69 mm)2.6 inches (66 mm)2.7 inches (69 mm)38.1 inches (970 mm)
Cape Hatteras [7] 5.6 inches (140 mm)4.1 inches (100 mm)4.6 inches (120 mm)3.2 inches (81 mm)3.8 inches (97 mm)4.2 inches (110 mm)4.9 inches (120 mm)6.4 inches (160 mm)5.3 inches (130 mm)5.3 inches (130 mm)4.9 inches (120 mm)4.5 inches (110 mm)56.9 inches (1,450 mm)
Charlotte [8] 3.7 inches (94 mm)3.7 inches (94 mm)4.6 inches (120 mm)3 inches (76 mm)3.6 inches (91 mm)3.5 inches (89 mm)3.8 inches (97 mm)4.1 inches (100 mm)3.3 inches (84 mm)3.2 inches (81 mm)3.1 inches (79 mm)3.3 inches (84 mm)43 inches (1,100 mm)
Greensboro [9] 3.1 inches (79 mm)3 inches (76 mm)3.7 inches (94 mm)3.6 inches (91 mm)3.4 inches (86 mm)3.7 inches (94 mm)4.5 inches (110 mm)3.9 inches (99 mm)4.2 inches (110 mm)3.1 inches (79 mm)3.1 inches (79 mm)3 inches (76 mm)42.2 inches (1,070 mm)
Raleigh [10] 3.5 inches (89 mm)3.5 inches (89 mm)3.7 inches (94 mm)2.8 inches (71 mm)3.8 inches (97 mm)3.6 inches (91 mm)4.4 inches (110 mm)4.4 inches (110 mm)3.1 inches (79 mm)3 inches (76 mm)2.9 inches (74 mm)3.1 inches (79 mm)41.8 inches (1,060 mm)
Wilmington [11] 3.6 inches (91 mm)3.5 inches (89 mm)4.3 inches (110 mm)2.9 inches (74 mm)4.3 inches (110 mm)5.4 inches (140 mm)7.9 inches (200 mm)7 inches (180 mm)5.6 inches (140 mm)3.3 inches (84 mm)3.3 inches (84 mm)3.5 inches (89 mm)55 inches (1,400 mm)

Snow

A downed tree in Asheville, North Carolina caused by snowfall from the 1993 Storm of the Century 1993 Storm of the Century Asheville, North Carolina snowfall.jpg
A downed tree in Asheville, North Carolina caused by snowfall from the 1993 Storm of the Century

Snow in North Carolina is seen on a regular basis in the mountains. North Carolina averages 5 inches (130 mm) of snow per winter season. However, this varies greatly across the state. Along the coast, most areas register less than 2 inches (51 mm) per year while the state capital, Raleigh, averages 6.0 inches (150 mm). Farther west in the Piedmont-Triad, the average grows to approximately 9 inches (230 mm). The Charlotte area averages approximately 5.0 inches (130 mm). The town of Boone, North Carolina, located at an elevation of 3,333 feet in the northwestern part of the state, averages approximately 45 inches of snow per winter season.[ citation needed ] The mountains in the west act as a barrier, preventing most snowstorms from entering the Piedmont. When snow does make it past the mountains, it is usually light and is seldom on the ground for more than two or three days. However, several storms have dropped 18 inches (460 mm) or more of snow within normally warm areas. The 1993 Storm of the Century that lasted from March 11 to March 15 affected locales from Canada to Central America, and brought exceptionally heavy snow to North Carolina. Newfound Gap received more than 36 inches (0.91 m) of snow with drifts more than 5 feet (1.5 m), while Mount Mitchell measured over 4 feet (1.2 m) of snow with drifts to 14 feet (4.3 m). [12] Most of the northwestern part of the state received somewhere between 2 feet (0.61 m) and 3 feet (0.91 m) of snow.

Another significant snowfall hit the Raleigh area in January 2000 when more than 20 inches (510 mm) of snow fell. [13] There was also a heavy snowfall totaling 18 inches (460 mm) that hit the Wilmington area on December 22–23, 1989. This storm affected only the Southeastern US coast, as far south as Savannah, Georgia, with little to no snow measured west of I-95. Most big snows that impact areas east of the mountains come from extratropical cyclones which approach from the south across Georgia and South Carolina and move off the coast of North or South Carolina. These storms typically throw Gulf or Atlantic moisture over cold Arctic air at ground level, usually propelled southward from Arctic high pressure over the Northeastern or New England states. If the storms track sufficiently far to the east, snow will be limited to the eastern part of the state (as with the December 22–23, 1989, storm, and the January 4, 2018, storm that dropped 4 inches at Cape Hatteras, but virtually no snow in inland North Carolina locations). If the cyclones travel close to the coast, warm air will get pulled into eastern North Carolina due to increasing flow off the milder Atlantic Ocean, bringing a rain/snow line well inland with heavy snow restricted to the Piedmont, foothills and mountains, as with the January 22, 1987, storm that dropped 6 inches at Charlotte. If the storm tracks inland into eastern North Carolina, the rain/snow line ranges between Raleigh and Greensboro. [14]

Average monthly snowfall
CityJanFebMarAprMayJunJulAugSepOctNovDecTotal
Asheville [6] 4.6 inches (12 cm)4.6 inches (12 cm)3 inches (7.6 cm)0.7 inches (1.8 cm)------0.7 inches (1.8 cm)2 inches (5.1 cm)15.6 inches (40 cm)
Cape Hatteras [7] 0.4 inches (1.0 cm)0.6 inches (1.5 cm)0.4 inches (1.0 cm)--------0.6 inches (1.5 cm)2 inches (5.1 cm)
Charlotte [8] 2 inches (5.1 cm)1.7 inches (4.3 cm)1.2 inches (3.0 cm)-------0.1 inches (0.25 cm)0.5 inches (1.3 cm)5.5 inches (14 cm)
Greensboro [9] 3.4 inches (8.6 cm)2.4 inches (6.1 cm)0.8 inches (2.0 cm)-------0.1 inches (0.25 cm)0.8 inches (2.0 cm)7.5 inches (19 cm)
Raleigh [10] 2.2 inches (5.6 cm)2.6 inches (6.6 cm)1.3 inches (3.3 cm)-------0.1 inches (0.25 cm)0.8 inches (2.0 cm)7 inches (18 cm)
Wilmington [11] 0.4 inches (1.0 cm)0.5 inches (1.3 cm)0.4 inches (1.0 cm)--------0.6 inches (1.5 cm)1.9 inches (4.8 cm)

Tropical cyclones

Hurricane Fran Hurricane Fran sept 1996.jpg
Hurricane Fran

Located along the Atlantic Coast, many hurricanes that come up from the Caribbean Sea make it up the coast of eastern America, passing by North Carolina.

Rainfall from Floyd Floyd1999 accumulations bilingual.gif
Rainfall from Floyd

On October 15, 1954, Hurricane Hazel struck North Carolina, at that time it was a category 4 hurricane within the Saffir-Simpson Hurricane Scale. Hazel caused significant damage due to its strong winds. A weather station at Oak Island reported maximum sustained winds of 140 miles per hour (230 km/h), while in Raleigh winds of 90 miles per hour (140 km/h) were measured. The hurricane caused 19 deaths and significant destruction. One person at Long Beach claimed that "of the 357 buildings that existed in the town, 352 were totally destroyed and the other five damaged". Hazel was described as "the most destructive storm in the history of North Carolina" in a 1989 report. [15]

In 1996, Hurricane Fran made landfall in North Carolina. As a category 3 hurricane, Fran caused a great deal of damage, mainly through winds. Fran's maximum sustained wind speeds were 115 miles per hour (185 km/h), while North Carolina's coast saw surges of 8 feet (2.4 m) to 12 feet (3.7 m) above sea level. The amount of damage caused by Fran ranged from $1.275 to $2 billion in North Carolina. [15]

Rain

Heavy rains accompany tropical cyclones and their remnants which move northeast from the Gulf of Mexico coastline, as well as inland from the western subtropical Atlantic Ocean. Over the past 30 years, the wettest tropical cyclone to strike the coastal plain was Hurricane Floyd of September 1999, which dropped over 24 inches (610 mm) of rainfall north of Southport. Unlike Hazel and Fran, the main force of destruction was from precipitation. Before Hurricane Floyd reached North Carolina, the state had already received large amounts of rain from Hurricane Dennis less than two weeks before Floyd. This saturated much of the Eastern North Carolina soil and allowed heavy rains from Hurricane Floyd to turn into floods. Over 35 people died from Floyd. [15] In the mountains, Hurricane Frances of September 2004 was nearly as wet, bringing over 23 inches (580 mm) of rainfall to Mount Mitchell. [16]

Tornado activity in the United States Tornado Alley.gif
Tornado activity in the United States

Severe weather

In most years, the greatest weather-related economic loss incurred in North Carolina is due to severe weather spawned by summer thunderstorms. These storms affect limited areas, with their hail and wind accounting for an average annual loss of over US$5 million. [17]

North Carolina averages 31 tornadoes a year with May seeing the most tornadoes on average a month with 5. June, July and August all have an average of 3 tornadoes with an increase to 4 average tornadoes a month in September. It is through September and into early November when North Carolina can typically expect to see that smaller, secondary, severe weather season. While severe weather season is technically from March through May, tornadoes have touched down in North Carolina in every month of the year. [18] On November 28, 1988, an early morning F4 tornado smashed across northwestern Raleigh, continuing 84 miles further, killing 4 and injuring 157. [19] On February 6, 2020, severe storms hit North Carolina, with a tornado beginning in Rowan County, north of Charlotte. as it travelled north, wind speeds picked up to 30 mph. [20] By 4pm, 100 000 people were without power and flash flood warnings were hitting areas in the North and Northwest with this flood watch staying in full effect until the following Thursday. [20]

Changes

Much of North Carolina's Outer and Inner Banks could be at or below sea level. NCOuterBanks-EO.jpg
Much of North Carolina's Outer and Inner Banks could be at or below sea level.

The North Carolina coastline is expected to rise between one and four feet in the next century due to a combination of warming oceans, melting ice, and land subsidence. [21] Temperatures in North Carolina have risen. Over the last 100 years, the average temperature in Chapel Hill has gone up 1.2 °F (0.7 °C) and precipitation in some parts of the state has increased by 5 percent. [22] Around the year 2080, "temperatures are likely to rise above 95°F approximately 20 to 40 days per year in most of the state, compared with about 10 days per year" in 2016. [21]

Seasonal conditions

Winter

In winter, North Carolina is somewhat protected by the Appalachian Mountains to the west. Cold fronts from Canada are typically reduced in intensity by the mountains. However, occasionally cold air can move from the north or northeast, east of the Appalachian Mountains, from Arctic high pressure systems that settle over the Northeastern or New England states. Other polar and Arctic outbreaks can cross the mountains and force temperatures to drop to about 12 °F (−11 °C) in central North Carolina. Still, temperatures below zero degrees Fahrenheit are extremely rare outside of the mountains. The coldest ever recorded temperature in North Carolina was −34 °F (−37 °C) on January 21, 1985, at Mount Mitchell. The winter temperatures on the coast are milder due to the warming influence of the Atlantic Ocean and the Gulf Stream. [23] The average ocean temperature in Southport in January is still higher than the average ocean temperature in Maine during July. [23] Snow is common in the mountains, although many ski resorts use snowmaking equipment to make sure there is always snow on their land. [23] North Carolina's relative humidity is highest in the winter. [23]

Spring

Tornadoes are most likely in the spring. Major tornado outbreaks affected parts of eastern North Carolina on March 28, 1984, and April 16, 2011. The month of May experiences the greatest rise in temperatures. During the spring, there are warm days and cool nights in the Piedmont. Temperatures are somewhat cooler in the mountains and warmer, particularly at night, near the coast. [23] North Carolina's humidity is lowest in the spring. [23]

Summer

Harris Lake in Highlands, North Carolina during fall Harris Lake Highlands.jpg
Harris Lake in Highlands, North Carolina during fall

North Carolina experiences high summer temperatures. Sometimes, cool, dry air from the north will invade North Carolina for brief periods of time, with temperatures quickly rebounding. [24] It remains colder at high elevations, with the average summer temperature in Mount Mitchell lying at 68 °F (20 °C). Morning temperatures are on average 20 °F (12 °C) lower than afternoon temperatures, except along the Atlantic Coast. [23] The largest economic loss from severe weather in North Carolina is due to severe thunderstorms in the summer, although they usually only hit small areas. [23] Tropical cyclones can impact the state during the summer as well. Fogs are also frequent in the summer.

Fall

Fall is the most rapidly changing season temperature wise, especially in October and November. [23] Tropical cyclones remain a threat until late in the season. The Appalachian Mountains are frequently visited at this time of year, due to the leaves changing color in the trees. [23]

Southern Oscillation

During El Niño events, winter and early spring temperatures are cooler than average with above average precipitation in the central and eastern parts of the state and drier weather in the western part. La Niña usually brings warmer than average temperatures with above average precipitation in the western part of the state while the central and coastal regions stay drier than average.

Climate data

Average monthly temperature (Fahrenheit) [3]
BuildingJanFebMarAprMayJunJulAugSepOctNovDec
Asheville 46/2650/2858/3566/4274/5180/5883/6382/6276/5567/4357/3549/29
Cape Hatteras 54/3955/3960/4468/5275/6082/6885/7385/7281/6873/5965/5057/43
Charlotte 51/3256/3464/4273/4980/5887/6690/7188/6982/6373/5163/4254/35
Greensboro 47/2852/3160/3870/4677/5584/6488/6886/6779/6070/4860/3951/31
Raleigh 50/3054/3262/3972/4679/5586/6489/6887/6781/6172/4862/4053/33
Wilmington 56/3660/3866/4474/5181/6086/6890/7288/7184/6676/5468/4560/38
Climate data for Charlotte (Köppen Cfa)
MonthJanFebMarAprMayJunJulAugSepOctNovDecYear
Record high °F (°C)79
(26)
82
(28)
91
(33)
96
(36)
98
(37)
104
(40)
104
(40)
104
(40)
104
(40)
99
(37)
85
(29)
80
(27)
104
(40)
Mean maximum °F (°C)70.6
(21.4)
73.6
(23.1)
81.6
(27.6)
85.9
(29.9)
90.4
(32.4)
94.7
(34.8)
97.0
(36.1)
96.1
(35.6)
92.0
(33.3)
85.6
(29.8)
77.8
(25.4)
71.2
(21.8)
98.0
(36.7)
Mean daily maximum °F (°C)52.3
(11.3)
56.6
(13.7)
64.2
(17.9)
73.2
(22.9)
80.1
(26.7)
86.9
(30.5)
90.3
(32.4)
88.6
(31.4)
82.8
(28.2)
73.3
(22.9)
62.9
(17.2)
54.9
(12.7)
72.2
(22.3)
Daily mean °F (°C)42.1
(5.6)
45.7
(7.6)
52.7
(11.5)
61.1
(16.2)
69.0
(20.6)
76.6
(24.8)
80.1
(26.7)
78.6
(25.9)
72.7
(22.6)
61.9
(16.6)
51.4
(10.8)
44.7
(7.1)
61.4
(16.3)
Mean daily minimum °F (°C)31.8
(−0.1)
34.9
(1.6)
41.2
(5.1)
49.1
(9.5)
58.0
(14.4)
66.2
(19.0)
69.9
(21.1)
68.7
(20.4)
62.6
(17.0)
50.4
(10.2)
39.8
(4.3)
34.5
(1.4)
50.6
(10.3)
Mean minimum °F (°C)14.8
(−9.6)
19.3
(−7.1)
23.7
(−4.6)
32.9
(0.5)
43.3
(6.3)
55.5
(13.1)
62.2
(16.8)
60.0
(15.6)
49.8
(9.9)
33.9
(1.1)
23.8
(−4.6)
19.6
(−6.9)
12.6
(−10.8)
Record low °F (°C)−5
(−21)
−5
(−21)
4
(−16)
21
(−6)
32
(0)
45
(7)
53
(12)
50
(10)
38
(3)
24
(−4)
11
(−12)
−5
(−21)
−5
(−21)
Average precipitation inches (mm)3.49
(89)
3.13
(80)
3.95
(100)
3.84
(98)
3.36
(85)
3.99
(101)
3.74
(95)
4.35
(110)
3.71
(94)
3.16
(80)
3.31
(84)
3.57
(91)
43.60
(1,107)
Average snowfall inches (cm)1.6
(4.1)
1.1
(2.8)
0.3
(0.76)
0.0
(0.0)
0.0
(0.0)
0.0
(0.0)
0.0
(0.0)
0.0
(0.0)
0.0
(0.0)
0.0
(0.0)
0.1
(0.25)
0.4
(1.0)
3.5
(8.9)
Average precipitation days (≥ 0.01 in)10.39.710.29.09.510.610.510.17.77.18.19.6112.4
Average snowy days (≥ 0.1 in)0.90.50.20.00.00.00.00.00.00.00.00.31.9
Average relative humidity (%)65.761.861.559.366.969.672.273.573.369.967.667.367.4
Average dew point °F (°C)27.3
(−2.6)
28.6
(−1.9)
36.3
(2.4)
43.5
(6.4)
54.9
(12.7)
63.0
(17.2)
67.1
(19.5)
66.7
(19.3)
61.2
(16.2)
49.5
(9.7)
39.6
(4.2)
31.3
(−0.4)
47.4
(8.6)
Mean monthly sunshine hours 173.3180.3234.8269.6292.1289.2290.0272.9241.4230.5178.4168.52,821
Percent possible sunshine 55596369676666656566585563
Average ultraviolet index 346891010985326
Source 1: NOAA (relative humidity and sun 1961–1990) [25] [26] [27]
Source 2: Weather Atlas [28] (UV index)
Climate data for Raleigh (Köppen Cfa)
MonthJanFebMarAprMayJunJulAugSepOctNovDecYear
Record high °F (°C)80
(27)
84
(29)
94
(34)
95
(35)
99
(37)
105
(41)
105
(41)
105
(41)
104
(40)
100
(38)
88
(31)
81
(27)
105
(41)
Mean maximum °F (°C)71.9
(22.2)
74.4
(23.6)
81.6
(27.6)
86.4
(30.2)
91.3
(32.9)
96.6
(35.9)
98.2
(36.8)
96.7
(35.9)
92.3
(33.5)
86.7
(30.4)
78.5
(25.8)
72.8
(22.7)
99.6
(37.6)
Mean daily maximum °F (°C)51.9
(11.1)
55.8
(13.2)
63.3
(17.4)
72.7
(22.6)
80.0
(26.7)
87.4
(30.8)
90.8
(32.7)
88.7
(31.5)
82.5
(28.1)
73.0
(22.8)
63.0
(17.2)
54.7
(12.6)
72.0
(22.2)
Daily mean °F (°C)41.9
(5.5)
45.0
(7.2)
51.8
(11.0)
60.8
(16.0)
68.8
(20.4)
76.7
(24.8)
80.5
(26.9)
78.8
(26.0)
72.6
(22.6)
61.7
(16.5)
51.5
(10.8)
44.6
(7.0)
61.2
(16.2)
Mean daily minimum °F (°C)31.8
(−0.1)
34.2
(1.2)
40.3
(4.6)
48.9
(9.4)
57.7
(14.3)
66.0
(18.9)
70.2
(21.2)
68.9
(20.5)
62.7
(17.1)
50.3
(10.2)
40.0
(4.4)
34.4
(1.3)
50.4
(10.2)
Mean minimum °F (°C)14.0
(−10.0)
19.2
(−7.1)
23.7
(−4.6)
32.2
(0.1)
42.8
(6.0)
54.2
(12.3)
61.0
(16.1)
58.7
(14.8)
48.7
(9.3)
33.2
(0.7)
24.4
(−4.2)
19.9
(−6.7)
12.1
(−11.1)
Record low °F (°C)−9
(−23)
−2
(−19)
11
(−12)
23
(−5)
29
(−2)
38
(3)
48
(9)
46
(8)
37
(3)
19
(−7)
11
(−12)
0
(−18)
−9
(−23)
Average precipitation inches (mm)3.43
(87)
2.78
(71)
4.10
(104)
3.53
(90)
3.58
(91)
3.89
(99)
5.02
(128)
4.71
(120)
5.15
(131)
3.37
(86)
3.32
(84)
3.39
(86)
46.07
(1,170)
Average snowfall inches (cm)2.6
(6.6)
1.4
(3.6)
0.3
(0.76)
0.0
(0.0)
0.0
(0.0)
0.0
(0.0)
0.0
(0.0)
0.0
(0.0)
0.0
(0.0)
0.0
(0.0)
0.1
(0.25)
0.8
(2.0)
5.2
(13)
Average precipitation days (≥ 0.01 in)10.19.310.79.59.911.211.710.79.07.68.29.7117.6
Average snowy days (≥ 0.1 in)1.21.20.40.00.00.00.00.00.00.00.10.53.4
Average relative humidity (%)66.564.163.061.771.173.676.077.977.173.369.168.570.2
Average dew point °F (°C)26.8
(−2.9)
28.2
(−2.1)
35.8
(2.1)
43.3
(6.3)
55.2
(12.9)
63.5
(17.5)
67.8
(19.9)
67.5
(19.7)
61.5
(16.4)
49.3
(9.6)
39.4
(4.1)
31.1
(−0.5)
47.5
(8.6)
Mean monthly sunshine hours 163.8173.1228.9250.7258.4267.7259.5239.6217.6215.4174.0157.62,606.3
Percent possible sunshine 53576264596158575862565259
Average ultraviolet index 346791010985326
Source 1: NOAA (relative humidity, dew point, and sun 1961–1990) [29] [30] [31]
Source 2: Weather Atlas (UV Index) [32]

See also

Related Research Articles

<span class="mw-page-title-main">Climate of Virginia</span> Overview of the climate of the U.S. state of Virginia

The climate of Virginia, a state on the east coast of the United States, is mild compared to more northern areas of the United States such as New England and the Midwest. Most of Virginia east of the Blue Ridge mountains, the southern part of the Shenandoah Valley, and the Roanoke Valley, has a humid subtropical climate. In the mountainous areas west of the Blue Ridge, the climate is warm-summer humid continental or oceanic climate. Severe weather, in the form of tornadoes, tropical cyclones, and winter storms, impacts the state on a regular basis. Central Virginia received significant snowfall of 20 inches in December 2009.

<span class="mw-page-title-main">Hurricane Kyle (2002)</span> Category 1 Atlantic hurricane in 2002

Hurricane Kyle was the fifth-longest-lived Atlantic tropical or subtropical cyclone on record. The eleventh named storm and third hurricane of the 2002 Atlantic hurricane season, Kyle developed as a subtropical cyclone on September 20 to the east-southeast of Bermuda. Looping westward, it transitioned into a tropical cyclone and became a hurricane on September 25. For the next two weeks, Kyle tracked generally westward, oscillating in strength several times because of fluctuations in environmental conditions. On October 11, the cyclone turned northeastward and made landfalls near Charleston, South Carolina, and Long Beach, North Carolina, at tropical storm status. After lasting as a cyclone for 22 days, Kyle dissipated on October 12 as it was absorbed by an approaching cold front.

<span class="mw-page-title-main">Climate of Puerto Rico</span> Predominantly tropical rainforest in the Köppen climate classification

The climate of Puerto Rico in the Köppen climate classification is predominantly tropical rainforest. Temperatures throughout the year are warm to hot, averaging near 85 °F (29 °C) in lower elevations and 70 °F (21 °C) in the mountains. Easterly trade winds pass across the island year round while the rainy season stretches from April into November. The relatively cool trade winds are blocked by the mountains of the Cordillera Central which causes rain shadows and sharp variations in the temperature and wind speed over short distances. About a quarter of the average annual rainfall for Puerto Rico occurs during tropical cyclones, which are more frequent during La Niña years.

The climate of San Diego, California is classified as a hot-summer Mediterranean climate. The basic climate features hot, sunny, and dry summers, and cooler, wetter winters. However, San Diego is much more arid than typical Mediterranean climates, and winters are still dry compared with most other zones with this type of climate. The climate at San Diego International Airport, the location for official weather reports for San Diego, as well as the climate at most beach areas, straddles the border between BSh and BSk due to the mild winters and cool summers in these locations.

<span class="mw-page-title-main">United States rainfall climatology</span> Characteristics of weather in U.S.

The characteristics of United States rainfall climatology differ significantly across the United States and those under United States sovereignty. Summer and early fall bring brief, but frequent thundershowers and tropical cyclones which create a wet summer and drier winter in the eastern Gulf and lower East Coast. During the winter, and spring, Pacific storm systems bring Hawaii and the western United States most of their precipitation. Low pressure systems moving up the East Coast and through the Great Lakes, bring cold season precipitation to from the Midwest to New England, as well as Great Salt Lake. The snow to liquid ratio across the contiguous United States averages 13:1, meaning 13 inches (330 mm) of snow melts down to 1 inch (25 mm) of water.

The climate of Houston is classified as a humid subtropical climate, with tropical influences. August normally ranks as the warmest month at an average temperature of 84.6 °F (29.2 °C) and January the coldest month at an average temperature of 53.1 °F (11.7 °C).

<span class="mw-page-title-main">Climate of Florida</span> Climate

The climate of the north and central parts of the U.S. state of Florida is humid subtropical. South Florida has a tropical climate. There is a defined rainy season from May through October when air mass thundershowers that build in the heat of the day drop heavy but brief summer rainfall.

<span class="mw-page-title-main">Climate of Texas</span> Overview of the climate of the U.S. state of Texas

Texas' weather varies widely, from arid in the west to humid in the east. The huge expanse of Texas encompasses several regions with distinctly different climates: Northern Plains, Trans-Pecos Region, Texas Hill Country, Piney Woods, and South Texas. Generally speaking, the part of Texas that lies to the east of Interstate 35 is subtropical, while the portion that lies to the west of Interstate 35 is arid desert.

<span class="mw-page-title-main">Climate of Georgia (U.S. state)</span> Overview of the climate of the U.S. state of Georgia

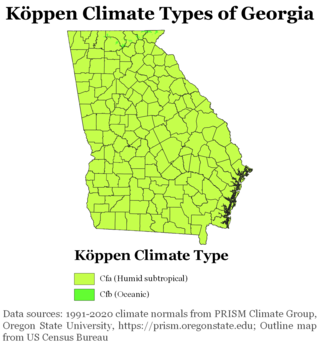
The climate of Georgia is a humid subtropical climate, with most of the state having short, mild winters and long, hot summers. The Atlantic Ocean on the east coast of Georgia and the hill country in the north impact the state's climate. Also, the Chattahoochee River divides Georgia into separate climatic regions with the mountain region to the northwest being cooler than the rest of the state; the average temperatures for the mountain region in January and July are 39 °F (4 °C) and 78 °F (26 °C) respectively. Winter in Georgia is characterized by mild temperatures and little snowfall around the state, with the potential for snow and ice increasing in the northern parts of the state. Summer daytime temperatures in Georgia often exceed 95 °F (35 °C). The state experiences widespread precipitation. Tornadoes and tropical cyclones are common.

<span class="mw-page-title-main">Climate of the United States</span> Varies due to changes in latitude, and a range of geographic features

The climate of the United States varies due to changes in latitude, and a range of geographic features, including mountains and deserts. Generally, on the mainland, the climate of the U.S. becomes warmer the further south one travels, and drier the further west, until one reaches the West Coast.

<span class="mw-page-title-main">Climate of Illinois</span>

The Climate of Illinois describes the weather conditions, and extremes, noted within the state of Illinois, United States, over time.

<span class="mw-page-title-main">Climate of South Carolina</span> Overview of the climate of the U.S. state of South Carolina

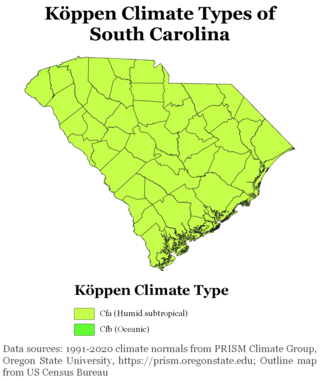
South Carolina has a humid subtropical climate, with hot summers throughout most of the state. But, an exception does occur in the Blue Ridge Mountains, as outlier pockets of an Oceanic Climate do exist. Mild winters predominate in the eastern and southern part of the state, but cool to occasionally cold winters are the standard in the northwestern area of the state, especially areas at or above 600 feet in elevation. On average, between 40 and 80 inches of precipitation falls annually across the state, potentially even in excess of 100 inches in portions of the Appalachian temperate rainforest. Tropical cyclones, and afternoon thunderstorms due to hot and humid conditions, contribute to precipitation during the summer and sometimes fall months, while extratropical cyclones contribute to precipitation during the fall, winter, and spring months. The coast experiences nearly all of their tropical weather impacts from storms coming directly from the Atlantic coast. The northwestern area of the state can receive impacts from both Atlantic basin storms moving westward from the coast and also occasionally very heavy rainfall and flooding from storms originating from the Gulf of Mexico that move inland towards the northeast after making landfall from the Florida Panhandle to Louisiana.

<span class="mw-page-title-main">Climate of New York (state)</span> Overview of the climate of the U.S. state of New York

The climate of New York (state) is generally humid continental, while the extreme southeastern portion of the state lies in the warmer humid subtropical climate zone. Winter temperatures average below freezing during January and February in much of the state of New York, but several degrees above freezing along the Atlantic coastline, including New York City.

<span class="mw-page-title-main">Climate of Massachusetts</span> Overview of the climate of Massachusetts

The climate of Massachusetts' is mainly a humid continental climate, with hot, humid summers, cold, snowy winters and abundant precipitation. Massachusetts is a states located in the New England region of the northeastern United States. Most of its population of 7.;million live in the Boston metropolitan area. The eastern half of this relatively small state is mostly urban and suburban. Massachusetts is the most populous of the six New England states and ranks third in the nation by population density and fourth by GDP per capita. Massachusetts receives about 43 inches or 1,090 millimetres of rain annually, fairly evenly distributed throughout the years, slightly wetter during the winter. Summers are warm with average high temperatures in July above 80 °F or 26.7 °C and overnight lows above 60 °F or 15.6 °C common throughout the state. Winters are cold, but generally less extreme on the coast with high temperatures in the winter averaging above freezing even in January, although areas further inland are much colder. The state does have extreme temperatures from time to time with 100 °F or 37.8 °C in the summer and temperatures below 0 °F or −17.8 °C in the winter not being unusual.

<span class="mw-page-title-main">Climate of the Tampa Bay area</span>

The Tampa Bay area has a humid subtropical climate, closely bordering a tropical climate near the waterfront areas. There are two basic seasons in the Tampa Bay area, a hot and wet season from May through October, and a mild and dry season from November through April.

<span class="mw-page-title-main">Climate of Alabama</span> Overview of the climate of the U.S. state of Alabama

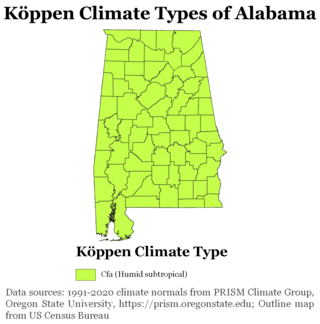
The state of Alabama is classified as humid subtropical (Cfa) under the Köppen climate classification. The state's average annual temperature is 64 °F (18 °C). Temperatures tend to be warmer in the state's southern portion with its proximity to the Gulf of Mexico, while its northern portions, especially in the Appalachian Mountains in the northeast, tend to be slightly cooler. Alabama generally has hot, humid summers and mild winters with copious precipitation throughout the year. The state receives an average of 56 inches (1,400 mm) of rainfall each year and experiences a lengthy growing season of up to 300 days in its southern portion. Hailstorms occur occasionally during the spring and summer here, but they are seldom destructive. Heavy fogs are rare, and they are confined chiefly to the coast. Thunderstorms also occur year-around. They are most common in the summer, but they are most commonly severe during the spring and late autumn. That is when destructive winds and tornadoes occur frequently, especially in the northern and central parts of the state. Central and northern Alabama are squarely within Dixie Alley, the primary area in the U.S. outside the Southern Plains with relatively high tornado risk. Alabama is ranked second in the U.S for the deadliest tornadoes. Hurricanes are quite common in the state, especially in the southern part. Major hurricanes occasionally strike the coast, such as Hurricane Frederic in September 1979 and Hurricane Ivan in September 2004; both storms resulted in significant to devastating damage in the Mobile area.

<span class="mw-page-title-main">Climate of Hawaii</span>

The U.S. state of Hawaiʻi, which covers the Hawaiian Islands, is tropical but it experiences many different climates, depending on altitude and surroundings. The island of Hawaiʻi for example hosts 4 climate groups on a surface as small as 4,028 square miles (10,430 km2) according to the Köppen climate types: tropical, arid, temperate and polar. When counting also the Köppen sub-categories – notably including the very rare cold-summer mediterranean climate – the island of Hawaiʻi hosts 10 climate zones. The islands receive most rainfall from the trade winds on their north and east flanks as a result of orographic precipitation. Coastal areas are drier, especially the south and west side or leeward sides.

<span class="mw-page-title-main">Tropical Storm Andrea (2013)</span> Atlantic Tropical storm in the 2013

Tropical Storm Andrea brought flooding to Cuba, the Yucatan Peninsula, and portions of the East Coast of the United States in June 2013. The first tropical cyclone and named storm of the annual hurricane season, Andrea originated from an area of low pressure in the eastern Gulf of Mexico on June 5. Despite strong wind shear and an abundance of dry air, the storm strengthened while initially heading north-northeastward. Later on June 5, it re-curved northeastward and approached the Big Bend region of Florida. Andrea intensified and peaked as a strong tropical storm with winds at 65 mph (105 km/h) on June 6. A few hours later, the storm weakened slightly and made landfall near Steinhatchee, Florida later that day. It began losing tropical characteristics while tracking across Florida and Georgia. Andrea transitioned into an extratropical cyclone over South Carolina on June 7, though the remnants continued to move along the East Coast of the United States, until being absorbed by another extratropical system offshore Maine on June 10.

<span class="mw-page-title-main">2014–15 North American winter</span> Winter season in North America

The 2014–15 North American winter was frigid and prolifically wintry, especially across the eastern half of North America in the months of January–March. The season began early, with many places in North America experiencing their first wintry weather during mid-November. A period of below-average temperatures affected much of the contiguous United States, and several records were broken. An early trace of snowfall was recorded in Arkansas. There were greater accumulations of snow across parts of Oklahoma as well. A quasi-permanent phenomenon referred to as the polar vortex may have been partly responsible for the cold weather. Temperatures in much of the United States dropped 15 to 35 °F below average by November 19, following a southward "dip" of the polar vortex into the eastern two-thirds of the country. The effects of this dip were widespread, bringing about temperatures as low as 28 °F (−2 °C) in Pensacola, Florida. Following a significant snowstorm there, Buffalo, New York received several feet of snow from November 17–21. In addition, significant winter weather occurred throughout the season, including a major blizzard that struck the Northeastern United States at the end of January, another blizzard that affected much of the Northern United States days later in early February, and several significant snow events paired with very frigid temperatures for much of February.

References

  1. 1 2 North Carolina Department of the Secretary of State. North Carolina Climate & Geography. Retrieved on 2008-01-13.
  2. "North Carolina USDA Plant Hardiness Zone Map". USDA. Retrieved November 19, 2023.
  3. 1 2 U.S. Travel Weather. North Carolina Weather. Retrieved on 2008-01-13. Archived January 29, 2008, at the Wayback Machine
  4. David B. Knight Robert E. Davis. Climatology of Tropical Cyclone Rainfall in the Southeastern United States. Retrieved on 2008-02-29.
  5. City-Data.com North Carolina - Climate Retrieved on 2008-02-09.
  6. 1 2 Weatherbase. Asheville, North Carolina Weather. Retrieved on 2008-02-08.
  7. 1 2 Weatherbase. Cape Hatteras, North Carolina Weather. Retrieved on 2008-02-08.
  8. 1 2 Weatherbase. Charlotte, North Carolina Weather. Retrieved on 2008-02-08.
  9. 1 2 Weatherbase. Greensboro, North Carolina Weather. Retrieved on 2024-05-09.
  10. 1 2 Weatherbase. Raleigh, North Carolina Weather. Retrieved on 2008-02-08.
  11. 1 2 Weatherbase. Wilmington, North Carolina Weather. Retrieved on 2008-02-08.
  12. Intellicast.com. "MARCH IN THE NORTHEAST" . Retrieved 2008-02-09.
  13. Environmental Modeling Center. EMC MODEL GUIDANCE FOR THE BLIZZARD of 2000. Retrieved on 2008-02-09.
  14. Keeter, Kermit K.; Businger, Steven; Lee, Laurence G.; Waldstreicher, Jeff S. (March 1995). "Winter Weather Forecasting throughout the Eastern United States. Part III: The Effects of Topography and the Variability of Winter Weather in the Carolinas and Virginia". Weather and Forecasting. 10 (1): 42–60. Bibcode:1995WtFor..10...42K. doi: 10.1175/1520-0434(1995)010<0042:WWFTTE>2.0.CO;2 .
  15. 1 2 3 State Climate Office of North Carolina. Research on North Carolina Severe Weather. Retrieved on 2008-03-09. Archived December 16, 2005, at the Wayback Machine
  16. Roth, David M (May 12, 2022). "Tropical Cyclone Rainfall in the Southeastern United States". Tropical Cyclone Rainfall. United States Weather Prediction Center. Retrieved January 6, 2023.PD-icon.svg This article incorporates text from this source, which is in the public domain.
  17. State Climate Office of North Carolina. Overview. Archived 2007-12-23 at the Wayback Machine Retrieved on 2008-03-14.
  18. Two Tornado Seasons In North Carolina | digtriad.com
  19. Raleigh Tornado
  20. 1 2 Price, Mark (6 February 2020). "Storms, high winds, heavy rain through Triangle". The News & Observer. Retrieved 3 April 2020.
  21. 1 2 "What climate change means for North Carolina" (PDF). EPA. August 2016. Retrieved 28 February 2020.
  22. Duke University. Climate Change and North Carolina Archived September 12, 2008, at the Wayback Machine Retrieved on 2008-01-17.
  23. 1 2 3 4 5 6 7 8 9 10 State Climate Office of North Carolina. General Summary of N.C. Climate. Archived 2007-12-23 at the Wayback Machine Retrieved on 2008-01-13.
  24. NCDC Climate of North Carolina Retrieved on 2008-02-09. [ dead link ]
  25. "NowData – NOAA Online Weather Data". National Oceanic and Atmospheric Administration . Retrieved May 4, 2021.
  26. "Summary of Monthly Normals 1991–2020". National Oceanic and Atmospheric Administration. Archived from the original on May 5, 2021. Retrieved May 4, 2021.
  27. "WMO Climate Normals for CHARLOTTE/DOUGLAS INT'L ARPT NC 1961–1990". National Oceanic and Atmospheric Administration. Retrieved July 18, 2020.
  28. "Charlotte, North Carolina, USA - Monthly weather forecast and Climate data". Weather Atlas. Retrieved 14 June 2019.
  29. "NowData – NOAA Online Weather Data". National Oceanic and Atmospheric Administration . Retrieved May 5, 2021.
  30. "Station: Raleigh Durham INTL AP, NC". U.S. Climate Normals 2020: U.S. Monthly Climate Normals (1991–2020). National Oceanic and Atmospheric Administration. Retrieved May 11, 2021.
  31. "WMO Climate Normals for RALEIGH/RALEIGH-DURHAM, NC 1961–1990". National Oceanic and Atmospheric Administration. Retrieved July 25, 2020.
  32. "Raleigh, North Carolina, USA – Monthly weather forecast and Climate data". Weather Atlas. Retrieved June 29, 2019.