Deep-ocean Assessment and Reporting of Tsunamis

Last updated
A diagram of the Dart II System DART II System Diagram.jpg
A diagram of the Dart II System
A tsunami buoy Dart tsunamicover.jpg
A tsunami buoy
Water column height on 11 March 2011 (Tohoku earthquake and tsunami) at DART buoy 21413, 690 NM Southeast of Tokyo 2011-Sendai-Tsunami-DART-21413-AB.png
Water column height on 11 March 2011 (Tōhoku earthquake and tsunami) at DART buoy 21413, 690 NM Southeast of Tokyo
Plot of measurements from DART buoy 34142 showing the passage of the tsunami generated by the 2010 Chile earthquake. Buoy 34142 is located in the southeastern Pacific Ocean 630 nautical miles (1170 km) southwest of Lima. 2010 Chile earthquake - NOAA buoy 34142 - water column height short.png
Plot of measurements from DART buoy 34142 showing the passage of the tsunami generated by the 2010 Chile earthquake. Buoy 34142 is located in the southeastern Pacific Ocean 630 nautical miles (1170 km) southwest of Lima.

Deep-ocean Assessment and Reporting of Tsunamis (DART) is a component of an enhanced tsunami warning system.

Contents

By logging changes in seafloor temperature and pressure, and transmitting the data via a surface buoy to a ground station by satellite, DART enables instant, accurate tsunami forecasts. In Standard Mode, the system logs the data at 15-minute intervals, and in Event Mode, every 15 seconds. A 2-way communication system allows the ground station to switch DART into Event Mode whenever detailed reports are needed.

Stations

Each DART station consists of a surface buoy and a seafloor bottom pressure recording (BPR) package that detects water pressure changes caused by tsunamis. The surface buoy receives transmitted information from the BPR via an acoustic link and then transmits data to a satellite, which retransmits the data to ground stations for immediate dissemination to NOAA's Tsunami Warning Centers, NOAA's National Data Buoy Center, and NOAA's Pacific Marine Environmental Laboratory (PMEL). The Iridium commercial satellite phone network is used for communication with 31 of the buoys. [1]

When on-board software identifies a possible tsunami, the station leaves standard mode and begins transmitting in event mode. In standard mode, the station reports water temperature and pressure (which are converted to sea-surface height, not unlike a depth gauge or a pressure tide gauge) every 15 minutes. At the start of event mode, the buoy reports measurements every 15 seconds for several minutes, followed by 1-minute averages for 4 hours. [2]

The first-generation DART I stations had one-way communication ability, and relied solely on the software's ability to detect a tsunami to trigger event mode and rapid data transmission. In order to avoid false positives, the detection threshold was set relatively high, presenting the possibility that a tsunami with a low amplitude could fail to trigger the station.

The second-generation DART II is equipped for two-way communication, allowing tsunami forecasters to place the station in event mode in anticipation of a tsunami's arrival.

Deep-ocean Assessment and Reporting of Tsunamis is officially abbreviated and trademarked as DART. [3]

Background

National Oceanic and Atmospheric Administration’s NOAA have placed Deep-ocean Assessment and Reporting of Tsunami stations in particular areas, areas with a history of generating large tsunamis, to be completely positive that the detection of tsunamis are to be as fast as possible. The year of 2001 was the completion of the first six tsunami detection buoys placed along the northern Pacific Ocean coast. In 2005 the United States president George W. Bush announced a two-year, $3.5 million, plan to install tsunami detecting buoys in the Atlantic and the Caribbean ocean in order to expand the nation’s capabilities to detect tsunamis. With the Pacific Ocean creating 85 percent of the world’s tsunamis [4] , the majority of new tsunami detecting buoy equipment will be installed around the pacific rim, while only seven buoys will be placed along the Atlantic and Caribbean coast because even though tsunamis are rare in the Atlantic, there have been records of deadly tsunamis being reported in the Atlantic. Roughly $13.8 million of the governments funding was used to procure and install exactly 32 pressure sensors on the ocean bottom to detect tsunamis and collect data such as the height and speed of the approaching tsunami. This proposed system, stated by the John H. Marburger the White House’s Office of Science and Technology Policy, should provide the United States’ Tsunami Warning Centers with nearly one hundred percent coverage for any approaching tsunamis as well as decline all false alarms to just about zero. [4] During all these improvements and upgrades of the current system, roughly three fourths of the tsunami warnings were discovered to be unnecessary and a waste of money. A few years later in 2008 there are now roughly 40 tsunami detection buoys placed in the Pacific Ocean by NOAA. The upgraded DART buoys were originally developed to maintain but to mostly improve the timing of detection of a tsunami. With an improved detection time for tsunamis, that is more time to save lives, warning guidance and international coordination.

History

The DART buoy technology was developed at PMEL, [5] with the first prototype deployed off the coast of Oregon in 1995. In 2004, the DART® stations were transitioned from research at PMEL to operational service at the National Data Buoy Center (NDBC), and PMEL and NDBC received the Department of Commerce Gold Medal "for the creation and use of a new moored buoy system to provide accurate and timely warning information on tsunamis". [6]

In the wake of the 2004 Indian Ocean earthquake and its subsequent tsunamis, plans were announced to deploy an additional 32 DART II buoys around the world. [7] These would include stations in the Caribbean and Atlantic Ocean for the first time.

The United States' array was completed in 2008 totaling 39 stations in the Pacific Ocean, Atlantic Ocean, and Caribbean Sea. The international community has also taken an interest in DART buoys and as of 2009 Australia, Chile, Indonesia and Thailand have deployed DART buoys to use as part of each country's tsunami warning system.

In the 2018 budget justification for NOAA, the Trump administration proposed eliminating the DART system as part of a 56% cut to the tsunami warning program. [8]

Overview

Deep-ocean Assessment and Reporting of Tsunami (DART) buoy systems are made up of three parts. There is a bottom pressure recorder (BPR) anchored to the bottom of the sea floor. A moored surface buoy connects to the bottom pressure recorder via an acoustic transmission link. The link sends data from the anchored pressure recorder to the surface buoy. The surface buoy sends the data by radio to satellites such as the Iridium system. From the satellites, the data travels by radio to the ground, then to the system office by conventional telecommunications. [9]

The surface buoy has a two and a half meter diameter fiberglass disk covered with foam and has a gross displacement of 4000 kg. [10] The mooring line connecting the surface buoy and the pressure recorder is a nineteen millimeter nylon line that has a tensile strength of 7100 kg. [10]

The data sent from the anchored bottom pressure recorder to the surface buoy consists of the temperature and pressure of the surrounding sea water. It retrieves and releases data every 15 seconds to get an average reading of the current weather conditions. [11]

A very stable, long lived, very high resolution pressure sensor is a critical enabling technology for DART's bottom pressure recorder. [12] It is a resonant quartz crystal strain gauge with a bourdon tube force collector. When compensated for temperature, this sensor has a pressure resolution of approximately 1mm of water when measuring pressure at a depth of several kilometers. [13]

Once the data reaches the surface buoy, the pressure data is converted to an average height of the waves surrounding the buoy. The temperature of the surrounding sea water is important to the calculations because temperature affects the water's density, thus the pressure, and therefore the sea temperature is required to accurately measure the height of the ocean swells. Because the swell sizes of the ocean vary constantly, the system has two modes of reporting data, standard mode and event mode. [14] Standard mode is the more common mode. Every 15 minutes, it sends the estimated sea surface height and the time of the measurement. [9]

If the software receives data that is not within the recent data averages, the system automatically switches to event mode. Event mode transmits data every 15 seconds and calculates the average sea surface height and the time when data being recorded every minute. If no further data is received that is not out of the averages being calculated at the time, it switches back to standard mode after four hours. [14] When NOAA released the first six DART buoys, their system only had a one way communication system. It was not until 2005 when the first generation of the DART buoy was upgraded to the second generation of the DART buoy. After 2005 the Dart buoys started using Iridium communication satellites that enabled you to not only retrieved information but to also send information to a DART. [15] The two-way communications between Tsunami Warning Centers and the pressure recorder made it possible to manually set DART buoys in event mode in case of any suspicion of a possible in-coming tsunamis. To make sure communications are always in contact and secure, the DART buoys have two communication systems; two independent and a redundant communication system. [15] With these updated and reliable communicating systems, data can now be sent where it needs to be sent around the world.

See also

Related Research Articles

<span class="mw-page-title-main">Buoy</span> Floating structure or device

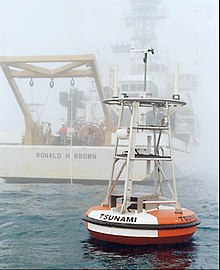
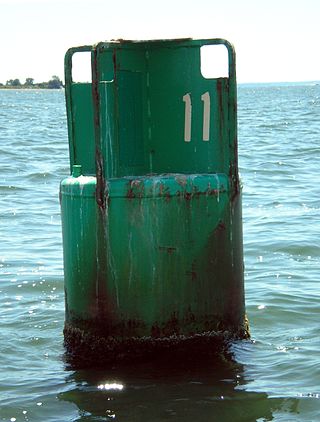
A buoy is a floating device that can have many purposes. It can be anchored (stationary) or allowed to drift with ocean currents.

The Tropical Ocean Global Atmosphere program (TOGA) was a ten-year study (1985–1994) of the World Climate Research Programme (WCRP) aimed specifically at the prediction of climate phenomena on time scales of months to years.

<span class="mw-page-title-main">Tsunami warning system</span> System used to detect and warn the public about impending tsunamis

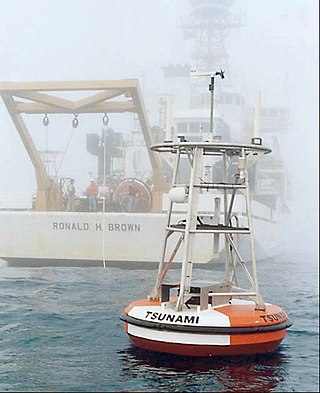
A tsunami warning system (TWS) is used to detect tsunamis in advance and issue the warnings to prevent loss of life and damage to property. It is made up of two equally important components: a network of sensors to detect tsunamis and a communications infrastructure to issue timely alarms to permit evacuation of the coastal areas. There are two distinct types of tsunami warning systems: international and regional. When operating, seismic alerts are used to instigate the watches and warnings; then, data from observed sea level height are used to verify the existence of a tsunami. Other systems have been proposed to augment the warning procedures; for example, it has been suggested that the duration and frequency content of t-wave energy is indicative of an earthquake's tsunami potential.

<span class="mw-page-title-main">Pacific Tsunami Warning Center</span> One of two tsunami warning centers that are operated by NOAA, located on Ford Island, Hawaii

The Pacific Tsunami Warning Center (PTWC), located on Ford Island, Hawaii, is one of two tsunami warning centers in the United States, covering Hawaii, Guam, American Samoa and the Northern Mariana Islands in the Pacific, as well as Puerto Rico, the U.S. Virgin Islands and the British Virgin Islands in the Caribbean Sea. Other parts of the United States are covered by the National Tsunami Warning Center.

<span class="mw-page-title-main">SOFAR channel</span> Horizontal layer of water in the ocean at which depth the speed of sound is at its minimum

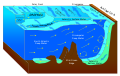
The SOFAR channel, or deep sound channel (DSC), is a horizontal layer of water in the ocean at which depth the speed of sound is at its minimum. The SOFAR channel acts as a waveguide for sound, and low frequency sound waves within the channel may travel thousands of miles before dissipating. An example was reception of coded signals generated by the Navy chartered ocean surveillance vessel Cory Chouest off Heard Island, located in the southern Indian Ocean, by hydrophones in portions of all five major ocean basins and as distant as the North Atlantic and North Pacific.

The Indian Ocean Tsunami Warning System was set up to provide warning to inhabitants of nations bordering the Indian Ocean of approaching tsunamis. The tsunami warning system has been in use since the mid-2000s.

<span class="mw-page-title-main">Office of Oceanic and Atmospheric Research</span> NOAA environmental products and services

Oceanic and Atmospheric Research (OAR) is a division of the National Oceanic and Atmospheric Administration (NOAA). OAR is also referred to as NOAA Research.

The Pacific Marine Environmental Laboratory (PMEL) is a federal laboratory in the National Oceanic and Atmospheric Administration (NOAA) Office of Oceanic and Atmospheric Research (OAR). It is one of seven NOAA Research Laboratories (RLs). The PMEL is split across two sites in the Pacific Northwest, in Seattle, Washington and Newport, Oregon.

<span class="mw-page-title-main">National Institute of Ocean Technology</span> Scientific organization in Tamil Nadu

The National Institute of Ocean Technology (NIOT) was established in November 1993 as an autonomous society under the Ministry of Earth Sciences in India. NIOT is managed by a Governing Council and is headed by a director. The institute is based in Chennai. The major aim of starting NIOT was to develop reliable indigenous technologies to solve various engineering problems associated with harvesting of non-living and living resources in India's exclusive economic zone, which is about two-thirds of the land area of India.

<span class="mw-page-title-main">National Data Buoy Center</span>

The National Data Buoy Center (NDBC) is a part of the National Oceanic and Atmospheric Administration's (NOAA) National Weather Service (NWS). NDBC designs, develops, operates, and maintains a network of data collecting buoys and coastal stations. The NDBC is located in southern Mississippi as a tenant at the John C. Stennis Space Center, a National Aeronautics and Space Administration (NASA) facility.

A meteotsunami or meteorological tsunami is a tsunami-like sea wave of meteorological origin. Meteotsunamis are generated when rapid changes in barometric pressure cause the displacement of a body of water. In contrast to "ordinary" impulse-type tsunami sources, a traveling atmospheric disturbance normally interacts with the ocean over a limited period of time. Tsunamis and meteotsunamis are otherwise similar enough that it can be difficult to distinguish one from the other, as in cases where there is a tsunami wave but there are no records of an earthquake, landslide, or volcanic eruption. Meteotsunamis, rather, are triggered due to extreme weather events including severe thunderstorms, squalls and storm fronts; all of which can quickly change atmospheric pressure. Meteotsunamis typically occur when severe weather is moving at the same speed and direction of the local wave action towards the coastline. The size of the wave is enhanced by coastal features such as shallow continental shelves, bays and inlets.

<span class="mw-page-title-main">Weather buoy</span> Floating instrument package that collects weather and ocean data

Weather buoys are instruments which collect weather and ocean data within the world's oceans, as well as aid during emergency response to chemical spills, legal proceedings, and engineering design. Moored buoys have been in use since 1951, while drifting buoys have been used since 1979. Moored buoys are connected with the ocean bottom using either chains, nylon, or buoyant polypropylene. With the decline of the weather ship, they have taken a more primary role in measuring conditions over the open seas since the 1970s. During the 1980s and 1990s, a network of buoys in the central and eastern tropical Pacific Ocean helped study the El Niño-Southern Oscillation. Moored weather buoys range from 1.5–12 metres (5–40 ft) in diameter, while drifting buoys are smaller, with diameters of 30–40 centimetres (12–16 in). Drifting buoys are the dominant form of weather buoy in sheer number, with 1250 located worldwide. Wind data from buoys has smaller error than that from ships. There are differences in the values of sea surface temperature measurements between the two platforms as well, relating to the depth of the measurement and whether or not the water is heated by the ship which measures the quantity.

<span class="mw-page-title-main">NOAA-16</span>

NOAA-16, also known as NOAA-L before launch, was an operational, polar orbiting, weather satellite series operated by the National Environmental Satellite Service (NESS) of the National Oceanic and Atmospheric Administration (NOAA). NOAA-16 continued the series of Advanced TIROS-N (ATN) spacecraft that began with the launch of NOAA-8 (NOAA-E) in 1983; but it had additional new and improved instrumentation over the NOAA A-K series and a new launch vehicle. It was launched on 21 September 2000 and, following an unknown anomaly, it was decommissioned on 9 June 2014. In November of 2015 it broke up in orbit, creating more than 200 pieces of debris.

The Coastal-Marine Automated Network (C-MAN) is a meteorological observation network along the coastal United States. Consisting of about sixty stations installed on lighthouses, at capes and beaches, on near shore islands, and on offshore platforms, the stations record atmospheric pressure, wind direction, speed and gust, and air temperature; however, some C-MAN stations are designed to also measure sea surface temperature, water level, waves, relative humidity, precipitation, and visibility.

Indian National Center for Ocean Information Services (INCOIS) is an autonomous organization of the Government of India, under the Ministry of Earth Sciences, located in Pragathi Nagar, Hyderabad. ESSO-INCOIS was established as an autonomous body in 1998 under the Ministry of Earth Sciences (MoES) and is a unit of the Earth System Science Organization (ESSO). ESSO- INCOIS is mandated to provide the best possible ocean information and advisory services to society, industry, government agencies and the scientific community through sustained ocean observations and constant improvements through systematic and focussed research.

The following are considered ocean essential climate variables (ECVs) by the Ocean Observations Panel for Climate (OOPC) that are currently feasible with current observational systems.

<span class="mw-page-title-main">National Tsunami Warning Center</span> Detects and analyzes earthquakes worldwide, issuing warnings to local officials

The National Tsunami Warning Center (NTWC) is one of two tsunami warning centers in the United States, covering all coastal regions of the United States and Canada, except Hawaii, Guam, the Northern Mariana Islands, Puerto Rico and the U.S. Virgin Islands. Until 2013, it was known as the West Coast and Alaska Tsunami Warning Center.

<span class="mw-page-title-main">NOAA Center for Tsunami Research</span>

The NOAA Center for Tsunami Research (NCTR), located at the Pacific Marine Environmental Laboratory (PMEL) in Seattle, Washington, performs research in support of tsunami forecast models to increase the speed and accuracy of operational forecasts and warnings, tsunami inundation models to predict tsunami impacts on coastal communities, and tsunami measurement/detection technology for optimally designed networks of tsunami buoys.

The Tropical Atmosphere Ocean (TAO) project is a major international effort that instrumented the entire tropical Pacific Ocean with approximately 70 deep ocean moorings. The development of the TAO array in 1985 was motivated by the 1982-1983 El Niño event and ultimately designed for the study of year-to-year climate variations related to El Niño and the Southern Oscillation (ENSO). Led by the TAO Project Office of the Pacific Marine Environmental Laboratory (PMEL), the full array of 70 moorings was completed in 1994.

<span class="mw-page-title-main">JASCO Applied Sciences</span>

JASCO Applied Sciences provides scientific consulting services and equipment related to underwater acoustics. JASCO operates from 7 international locations and provides services to the oil and gas, marine construction, energy, renewable energy, fisheries, maritime transport and defence sectors. The head office is located in Halifax, NS Canada. JASCO employs acousticians, bioacousticians, physicists, marine mammal scientists, engineers, technologists, and project managers.

References

  1. Iridium tracks tsunami buoys for NOAA
  2. "NDBC - Deep-ocean Assessment and Reporting of Tsunamis (DART®) Description". Archived from the original on 2010-03-06. Retrieved 2010-03-01.
  3. DART website with Patent Licensing Application form
  4. 1 2 (January 15, 2005 Saturday). Tsunami Detection To Expand; More Protection for U.S. Coastal Areas. The Washington Post, Retrieved from www.lexisnexis.com/hottopics/lnacademic
  5. DART development Publications & References, 2011-11-15
  6. Note: The Gold Medal is granted for distinguished contributions and is the highest honorary recognition bestowed by the Department of Commerce. Because so many people contributed to this success, the Gold Medal was presented as an organizational award.
  7. "NOAA News Online (Story 2369)". Archived from the original on 2005-01-19. Retrieved 2005-01-15.
  8. NOAA FY 2018 Congresstional [sic] Justification, p. 408. Retrieved June 2, 2017 from http://www.osec.doc.gov/bmi/budget/FY18CBJ/FY18_NOAA_CJ.pdf
  9. 1 2 (2015). Deep Ocean Tsunami Detection Buoys. Australian Government; Bureau of Meteorology. http://www.bom.gov.au/tsunami/about/detection_buoys.shtml
  10. 1 2 Meinig, C., S.E. Stalin, A.I. Nakamura, H.B. Milburn (2005), Real-Time Deep-Ocean Tsunami Measuring, Monitoring, and Reporting System: The NOAA DART II Description and Disclosure.
  11. Deep-ocean Assessment and Reporting of Tsunamis (DART®) Description. (2011, July 27). Retrieved March 24, 2015, from http://www.ndbc.noaa.gov/dart/dart.shtml Archived 2010-03-06 at the Wayback Machine
  12. Milburn, Hugh. "The NOAA DART II Description and Disclosure" (PDF). noaa.gov. NOAA, U.S. Government. Retrieved 4 April 2020.
  13. Eble, M. C.; Gonzalez, F. I. "Deep-Ocean Bottom Pressure Measurements in the Northeast Pacific" (PDF). noaa.gov. NOAA, U.S. Government. Retrieved 4 April 2020.
  14. 1 2 Deep-ocean Assessment and Reporting of Tsunamis (DART®) Description. (2011, July 27). Retrieved April 21, 2015, from http://www.ndbc.noaa.gov/dart/dart.shtml Archived 2010-03-06 at the Wayback Machine
  15. 1 2 Mungov, G., Eblé, M., & Bouchard, R. (2013). DART Tsunameter Retrospective and Real-Time Data: A Reflection on 10 Years of Processing in Support of Tsunami Research and Operations. Pure & Applied Geophysics, 170(9/10), 1369-1384. doi:10.1007/s00024-012-0477-5