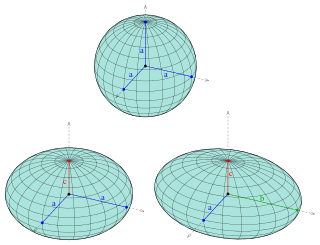
In mathematics, a spherical coordinate system is a coordinate system for three-dimensional space where the position of a given point in space is specified by three numbers, : the radial distance of the radial liner connecting the point to the fixed point of origin ; the polar angle θ of the radial line r; and the azimuthal angle φ of the radial line r.
An ellipsoid is a surface that can be obtained from a sphere by deforming it by means of directional scalings, or more generally, of an affine transformation.

In mathematics, the inverse trigonometric functions are the inverse functions of the trigonometric functions. Specifically, they are the inverses of the sine, cosine, tangent, cotangent, secant, and cosecant functions, and are used to obtain an angle from any of the angle's trigonometric ratios. Inverse trigonometric functions are widely used in engineering, navigation, physics, and geometry.
In probability theory, the Borel–Kolmogorov paradox is a paradox relating to conditional probability with respect to an event of probability zero. It is named after Émile Borel and Andrey Kolmogorov.

The haversine formula determines the great-circle distance between two points on a sphere given their longitudes and latitudes. Important in navigation, it is a special case of a more general formula in spherical trigonometry, the law of haversines, that relates the sides and angles of spherical triangles.

Orthographic projection in cartography has been used since antiquity. Like the stereographic projection and gnomonic projection, orthographic projection is a perspective projection in which the sphere is projected onto a tangent plane or secant plane. The point of perspective for the orthographic projection is at infinite distance. It depicts a hemisphere of the globe as it appears from outer space, where the horizon is a great circle. The shapes and areas are distorted, particularly near the edges.
The Mollweide projection is an equal-area, pseudocylindrical map projection generally used for maps of the world or celestial sphere. It is also known as the Babinet projection, homalographic projection, homolographic projection, and elliptical projection. The projection trades accuracy of angle and shape for accuracy of proportions in area, and as such is used where that property is needed, such as maps depicting global distributions.
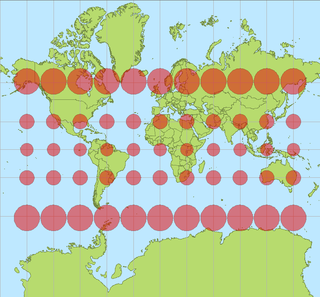
In cartography, a Tissot's indicatrix is a mathematical contrivance presented by French mathematician Nicolas Auguste Tissot in 1859 and 1871 in order to characterize local distortions due to map projection. It is the geometry that results from projecting a circle of infinitesimal radius from a curved geometric model, such as a globe, onto a map. Tissot proved that the resulting diagram is an ellipse whose axes indicate the two principal directions along which scale is maximal and minimal at that point on the map.
In mathematics, sine and cosine are trigonometric functions of an angle. The sine and cosine of an acute angle are defined in the context of a right triangle: for the specified angle, its sine is the ratio of the length of the side that is opposite that angle to the length of the longest side of the triangle, and the cosine is the ratio of the length of the adjacent leg to that of the hypotenuse. For an angle , the sine and cosine functions are denoted simply as and .
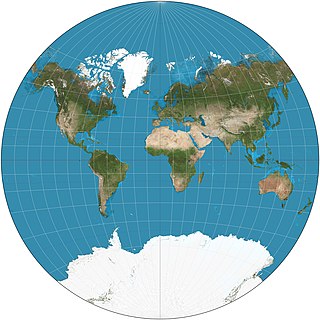
The van der Grinten projection is a compromise map projection, which means that it is neither equal-area nor conformal. Unlike perspective projections, the van der Grinten projection is an arbitrary geometric construction on the plane. Van der Grinten projects the entire Earth into a circle. It largely preserves the familiar shapes of the Mercator projection while modestly reducing Mercator's distortion. Polar regions are subject to extreme distortion. Lines of longitude converge to points at the poles.
There are several equivalent ways for defining trigonometric functions, and the proof of the trigonometric identities between them depend on the chosen definition. The oldest and somehow the most elementary definition is based on the geometry of right triangles. The proofs given in this article use this definition, and thus apply to non-negative angles not greater than a right angle. For greater and negative angles, see Trigonometric functions.
In physics and mathematics, the solid harmonics are solutions of the Laplace equation in spherical polar coordinates, assumed to be (smooth) functions . There are two kinds: the regular solid harmonics, which are well-defined at the origin and the irregular solid harmonics, which are singular at the origin. Both sets of functions play an important role in potential theory, and are obtained by rescaling spherical harmonics appropriately:

Geographical distance or geodetic distance is the distance measured along the surface of the Earth, or the shortest arch length.

The Eckert II projection is an equal-area pseudocylindrical map projection. In the equatorial aspect the network of longitude and latitude lines consists solely of straight lines, and the outer boundary has the distinctive shape of an elongated hexagon. It was first described by Max Eckert in 1906 as one of a series of three pairs of pseudocylindrical projections. Within each pair, the meridians have the same shape, and the odd-numbered projection has equally spaced parallels, whereas the even-numbered projection has parallels spaced to preserve area. The pair to Eckert II is the Eckert I projection.

The two-rays ground-reflection model is a multipath radio propagation model which predicts the path losses between a transmitting antenna and a receiving antenna when they are in line of sight (LOS). Generally, the two antenna each have different height. The received signal having two components, the LOS component and the reflection component formed predominantly by a single ground reflected wave.

The Boggs eumorphic projection is a pseudocylindrical, equal-area map projection used for world maps. Normally it is presented with multiple interruptions. Its equal-area property makes it useful for presenting spatial distribution of phenomena. The projection was developed in 1929 by Samuel Whittemore Boggs (1889–1954) to provide an alternative to the Mercator projection for portraying global areal relationships. Boggs was geographer for the United States Department of State from 1924 until his death. The Boggs eumorphic projection has been used occasionally in textbooks and atlases.
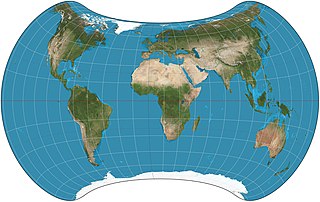
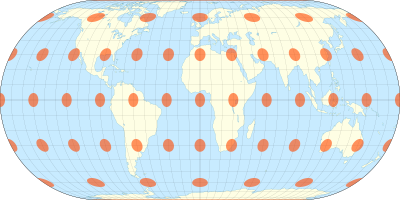
The Strebe 1995 projection, Strebe projection, Strebe lenticular equal-area projection, or Strebe equal-area polyconic projection is an equal-area map projection presented by Daniel "daan" Strebe in 1994. Strebe designed the projection to keep all areas proportionally correct in size; to push as much of the inevitable distortion as feasible away from the continental masses and into the Pacific Ocean; to keep a familiar equatorial orientation; and to do all this without slicing up the map.
The Eckert-Greifendorff projection is an equal-area map projection described by Max Eckert-Greifendorff in 1935. Unlike his previous six projections, it is not pseudocylindrical.