The Mercator projection is a cylindrical map projection presented by Flemish geographer and cartographer Gerardus Mercator in 1569. It became the standard map projection for navigation because it is unique in representing north as up and south as down everywhere while preserving local directions and shapes. The map is thereby conformal. As a side effect, the Mercator projection inflates the size of objects away from the equator. This inflation is very small near the equator but accelerates with increasing latitude to become infinite at the poles. As a result, landmasses such as Greenland, Antarctica and Russia appear far larger than they actually are relative to landmasses near the equator, such as Central Africa.

In geometry, a polyhedron is a three-dimensional shape with flat polygonal faces, straight edges and sharp corners or vertices.

A sphere is a geometrical object that is a three-dimensional analogue to a two-dimensional circle. A sphere is the set of points that are all at the same distance r from a given point in three-dimensional space. That given point is the centre of the sphere, and r is the sphere's radius. The earliest known mentions of spheres appear in the work of the ancient Greek mathematicians.
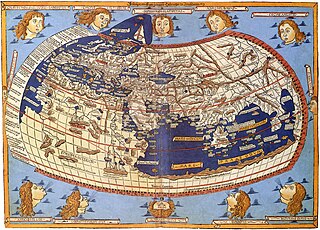
In cartography, map projection is the term used to describe a broad set of transformations employed to represent the two-dimensional curved surface of a globe on a plane. In a map projection, coordinates, often expressed as latitude and longitude, of locations from the surface of the globe are transformed to coordinates on a plane. Projection is a necessary step in creating a two-dimensional map and is one of the essential elements of cartography.
A circle of latitude or line of latitude on Earth is an abstract east–west small circle connecting all locations around Earth at a given latitude coordinate line.

In mathematics, a stereographic projection is a perspective projection of the sphere, through a specific point on the sphere, onto a plane perpendicular to the diameter through the point. It is a smooth, bijective function from the entire sphere except the center of projection to the entire plane. It maps circles on the sphere to circles or lines on the plane, and is conformal, meaning that it preserves angles at which curves meet and thus locally approximately preserves shapes. It is neither isometric nor equiareal.
In geometry, a zonohedron is a convex polyhedron that is centrally symmetric, every face of which is a polygon that is centrally symmetric. Any zonohedron may equivalently be described as the Minkowski sum of a set of line segments in three-dimensional space, or as the three-dimensional projection of a hypercube. Zonohedra were originally defined and studied by E. S. Fedorov, a Russian crystallographer. More generally, in any dimension, the Minkowski sum of line segments forms a polytope known as a zonotope.
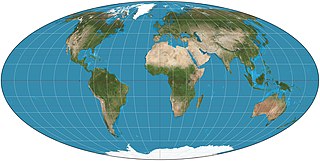
The Mollweide projection is an equal-area, pseudocylindrical map projection generally used for maps of the world or celestial sphere. It is also known as the Babinet projection, homalographic projection, homolographic projection, and elliptical projection. The projection trades accuracy of angle and shape for accuracy of proportions in area, and as such is used where that property is needed, such as maps depicting global distributions.

A gnomonic map projection is a map projection which displays all great circles as straight lines, resulting in any straight line segment on a gnomonic map showing a geodesic, the shortest route between the segment's two endpoints. This is achieved by casting surface points of the sphere onto a tangent plane, each landing where a ray from the center of the sphere passes through the point on the surface and then on to the plane. No distortion occurs at the tangent point, but distortion increases rapidly away from it. Less than half of the sphere can be projected onto a finite map. Consequently, a rectilinear photographic lens, which is based on the gnomonic principle, cannot image more than 180 degrees.

The scale of a map is the ratio of a distance on the map to the corresponding distance on the ground. This simple concept is complicated by the curvature of the Earth's surface, which forces scale to vary across a map. Because of this variation, the concept of scale becomes meaningful in two distinct ways.

The sinusoidal projection is a pseudocylindrical equal-area map projection, sometimes called the Sanson–Flamsteed or the Mercator equal-area projection. Jean Cossin of Dieppe was one of the first mapmakers to use the sinusoidal, appearing in a world map of 1570.

Bernard Joseph Stanislaus Cahill, American cartographer and architect, was the inventor of the octahedral "Butterfly Map". An early proponent of the San Francisco Civic Center, he also designed hotels, factories and mausoleums like the Columbarium of San Francisco.

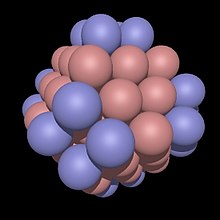
In geometry, the Waterman polyhedra are a family of polyhedra discovered around 1990 by the mathematician Steve Waterman. A Waterman polyhedron is created by packing spheres according to the cubic close(st) packing (CCP), also known as the face-centered cubic (fcc) packing, then sweeping away the spheres that are farther from the center than a defined radius, then creating the convex hull of the sphere centers.

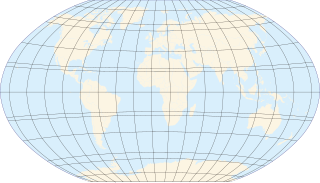
In cartography, the normal cylindrical equal-area projection is a family of normal cylindrical, equal-area map projections.

The Cahill–Keyes projection is a polyhedral compromise map projection first proposed by Gene Keyes in 1975. The projection is a refinement of an earlier 1909 projection by Bernard Cahill. The projection was designed to achieve a number of desirable characteristics, namely symmetry of component maps (octants), scalability allowing the map to continue to work well even at high resolution, uniformity of geocells, metric-based joining edges, minimized distortion compared to a globe, and an easily understood orientation to enhance general usability and teachability.

The octant projection or octants projection, is a type of map projection proposed the first time, in 1508, by Leonardo da Vinci in his Codex Atlanticus. Leonardo's authorship would be demonstrated by Christopher Tyler, who stated "For those projections dated later than 1508, his drawings should be effectively considered the original precursors..".

Leonardo's unique equilateral triangular design is applied for a world map. It is a map drawn using the "octant projection" and dated by Richard Henry Major to approximately 1514. It was found loosely inserted among a Codex of Leonardo da Vinci. It features an early use of the name America. The map incorporates information from the travels of Amerigo Vespucci, published in 1503 and 1505. Additionally, the map depicts the Arctic as an ocean and Antarctica as a continent of about the correct size.
The latitudinally equal-differential polyconic projection is a polyconic map projection in use since 1963 in mainland China. Maps on this projection are produced by China's State Bureau of Surveying and Mapping and other publishers. Its original method of construction has not been preserved, but a mathematical approximation has been published.

A polyhedral map projection is a map projection based on a spherical polyhedron. Typically, the polyhedron is overlaid on the globe, and each face of the polyhedron is transformed to a polygon or other shape in the plane. The best-known polyhedral map projection is Buckminster Fuller's Dymaxion map. When the spherical polyhedron faces are transformed to the faces of an ordinary polyhedron instead of laid flat in a plane, the result is a polyhedral globe.