
The Gall stereographic projection, presented by James Gall in 1855, is a cylindrical projection. It is neither equal-area nor conformal but instead tries to balance the distortion inherent in any projection.
The Gall stereographic projection, presented by James Gall in 1855, is a cylindrical projection. It is neither equal-area nor conformal but instead tries to balance the distortion inherent in any projection.
The projection is conventionally defined as: [1]
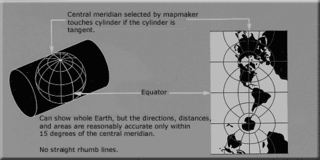
where λ is the longitude from the central meridian in degrees, φ is the latitude, and R is the radius of the globe used as the model of the earth for projection. It is a perspective projection if the point of projection is allowed to vary with longitude: the point of projection being on the equator on the opposite side of the earth from the point being mapped and with the projective surface being a cylinder secant to the sphere at 45°N and 45°S. [2] Gall called the projection "stereographic" because the spacing of the parallels is the same as the spacing of the parallels along the central meridian of the equatorial stereographic projection.
The reverse projection is defined as :
This later (1867) cylindrical projection by Carl Braun is similar, differing only in the asymmetric scaling horizontally and vertically. This yields a projection tangent to the sphere. [3] Its formula is:

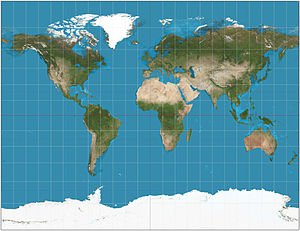
The Mercator projection is a cylindrical map projection presented by Flemish geographer and cartographer Gerardus Mercator in 1569. It became the standard map projection for navigation because it is unique in representing north as up and south as down everywhere while preserving local directions and shapes. The map is thereby conformal. As a side effect, the Mercator projection inflates the size of objects away from the equator. This inflation is very small near the equator but accelerates with increasing latitude to become infinite at the poles. As a result, landmasses such as Greenland, Antarctica and Russia appear far larger than they actually are relative to landmasses near the equator, such as Central Africa.

In navigation, a rhumb line, rhumb, or loxodrome is an arc crossing all meridians of longitude at the same angle, that is, a path with constant bearing as measured relative to true north.
In probability theory, the Borel–Kolmogorov paradox is a paradox relating to conditional probability with respect to an event of probability zero. It is named after Émile Borel and Andrey Kolmogorov.
The transverse Mercator map projection is an adaptation of the standard Mercator projection. The transverse version is widely used in national and international mapping systems around the world, including the Universal Transverse Mercator. When paired with a suitable geodetic datum, the transverse Mercator delivers high accuracy in zones less than a few degrees in east-west extent.

Orthographic projection in cartography has been used since antiquity. Like the stereographic projection and gnomonic projection, orthographic projection is a perspective projection in which the sphere is projected onto a tangent plane or secant plane. The point of perspective for the orthographic projection is at infinite distance. It depicts a hemisphere of the globe as it appears from outer space, where the horizon is a great circle. The shapes and areas are distorted, particularly near the edges.
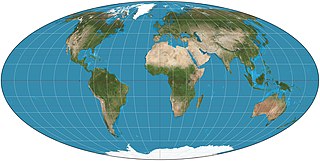
The Mollweide projection is an equal-area, pseudocylindrical map projection generally used for maps of the world or celestial sphere. It is also known as the Babinet projection, homalographic projection, homolographic projection, and elliptical projection. The projection trades accuracy of angle and shape for accuracy of proportions in area, and as such is used where that property is needed, such as maps depicting global distributions.

The scale of a map is the ratio of a distance on the map to the corresponding distance on the ground. This simple concept is complicated by the curvature of the Earth's surface, which forces scale to vary across a map. Because of this variation, the concept of scale becomes meaningful in two distinct ways.

The equirectangular projection, and which includes the special case of the plate carrée projection, is a simple map projection attributed to Marinus of Tyre, who Ptolemy claims invented the projection about AD 100. The projection maps meridians to vertical straight lines of constant spacing, and circles of latitude to horizontal straight lines of constant spacing. The projection is neither equal area nor conformal. Because of the distortions introduced by this projection, it has little use in navigation or cadastral mapping and finds its main use in thematic mapping. In particular, the plate carrée has become a standard for global raster datasets, such as Celestia, NASA World Wind, the USGS Astrogeology Research Program, and Natural Earth, because of the particularly simple relationship between the position of an image pixel on the map and its corresponding geographic location on Earth or other spherical solar system bodies. In addition it is frequently used in panoramic photography to represent a spherical panoramic image.
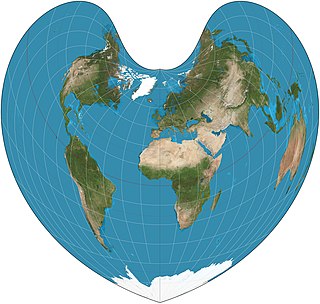
The Bonne projection is a pseudoconical equal-area map projection, sometimes called a dépôt de la guerre, modified Flamsteed, or a Sylvanus projection. Although named after Rigobert Bonne (1727–1795), the projection was in use prior to his birth, in 1511 by Sylvanus, Honter in 1561, De l'Isle before 1700 and Coronelli in 1696. Both Sylvanus and Honter's usages were approximate, however, and it is not clear they intended to be the same projection.

The Universal Transverse Mercator (UTM) is a map projection system for assigning coordinates to locations on the surface of the Earth. Like the traditional method of latitude and longitude, it is a horizontal position representation, which means it ignores altitude and treats the earth as a perfect ellipsoid. However, it differs from global latitude/longitude in that it divides earth into 60 zones and projects each to the plane as a basis for its coordinates. Specifying a location means specifying the zone and the x, y coordinate in that plane. The projection from spheroid to a UTM zone is some parameterization of the transverse Mercator projection. The parameters vary by nation or region or mapping system.
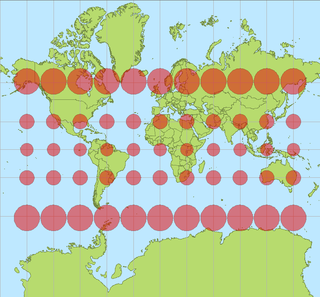
In cartography, a Tissot's indicatrix is a mathematical contrivance presented by French mathematician Nicolas Auguste Tissot in 1859 and 1871 in order to characterize local distortions due to map projection. It is the geometry that results from projecting a circle of infinitesimal radius from a curved geometric model, such as a globe, onto a map. Tissot proved that the resulting diagram is an ellipse whose axes indicate the two principal directions along which scale is maximal and minimal at that point on the map.

The Miller cylindrical projection is a modified Mercator projection, proposed by Osborn Maitland Miller in 1942. The latitude is scaled by a factor of 4⁄5, projected according to Mercator, and then the result is multiplied by 5⁄4 to retain scale along the equator. Hence:
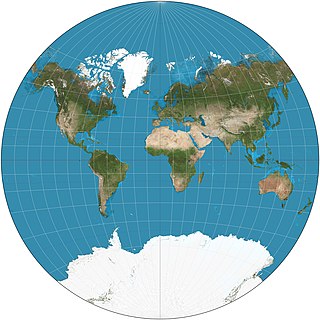
The van der Grinten projection is a compromise map projection, which means that it is neither equal-area nor conformal. Unlike perspective projections, the van der Grinten projection is an arbitrary geometric construction on the plane. Van der Grinten projects the entire Earth into a circle. It largely preserves the familiar shapes of the Mercator projection while modestly reducing Mercator's distortion. Polar regions are subject to extreme distortion. Lines of longitude converge to points at the poles.
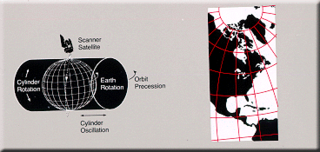
Space-oblique Mercator projection is a map projection devised in the 1970s for preparing maps from Earth-survey satellite data. It is a generalization of the oblique Mercator projection that incorporates the time evolution of a given satellite ground track to optimize its representation on the map. The oblique Mercator projection, on the other hand, optimizes for a given geodesic.

The Hammer projection is an equal-area map projection described by Ernst Hammer in 1892. Using the same 2:1 elliptical outer shape as the Mollweide projection, Hammer intended to reduce distortion in the regions of the outer meridians, where it is extreme in the Mollweide.

The Cassini projection is a map projection described by César-François Cassini de Thury in 1745. It is the transverse aspect of the equirectangular projection, in that the globe is first rotated so the central meridian becomes the "equator", and then the normal equirectangular projection is applied. Considering the earth as a sphere, the projection is composed of the operations:

The Eckert IV projection is an equal-area pseudocylindrical map projection. The length of the polar lines is half that of the equator, and lines of longitude are semiellipses, or portions of ellipses. It was first described by Max Eckert in 1906 as one of a series of three pairs of pseudocylindrical projections. Within each pair, meridians are the same whereas parallels differ. Odd-numbered projections have parallels spaced equally, whereas even-numbered projections have parallels spaced to preserve area. Eckert IV is paired with Eckert III.
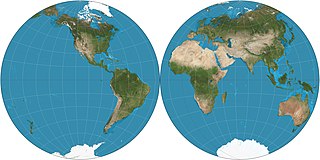
The Nicolosi globular projection is a polyconic map projection invented about the year 1,000 by the Iranian polymath al-Biruni. As a circular representation of a hemisphere, it is called globular because it evokes a globe. It can only display one hemisphere at a time and so normally appears as a "double hemispheric" presentation in world maps. The projection came into use in the Western world starting in 1660, reaching its most common use in the 19th century. As a "compromise" projection, it preserves no particular properties, instead giving a balance of distortions.
The Eckert-Greifendorff projection is an equal-area map projection described by Max Eckert-Greifendorff in 1935. Unlike his previous six projections, It is not pseudocylindrical.

The stereographic projection, also known as the planisphere projection or the azimuthal conformal projection, is a conformal map projection whose use dates back to antiquity. Like the orthographic projection and gnomonic projection, the stereographic projection is an azimuthal projection, and when on a sphere, also a perspective projection.


