
In geography, latitude is a coordinate that specifies the north–south position of a point on the surface of the Earth or another celestial body. Latitude is given as an angle that ranges from −90° at the south pole to 90° at the north pole, with 0° at the Equator. Lines of constant latitude, or parallels, run east–west as circles parallel to the equator. Latitude and longitude are used together as a coordinate pair to specify a location on the surface of the Earth.
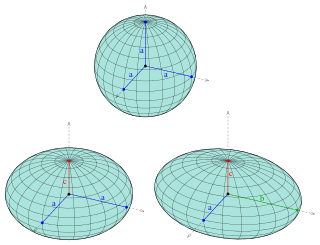
An ellipsoid is a surface that can be obtained from a sphere by deforming it by means of directional scalings, or more generally, of an affine transformation.

In mathematics, the Gudermannian function relates a hyperbolic angle measure to a circular angle measure called the gudermannian of and denoted . The Gudermannian function reveals a close relationship between the circular functions and hyperbolic functions. It was introduced in the 1760s by Johann Heinrich Lambert, and later named for Christoph Gudermann who also described the relationship between circular and hyperbolic functions in 1830. The gudermannian is sometimes called the hyperbolic amplitude as a limiting case of the Jacobi elliptic amplitude when parameter
In geodesy, conversion among different geographic coordinate systems is made necessary by the different geographic coordinate systems in use across the world and over time. Coordinate conversion is composed of a number of different types of conversion: format change of geographic coordinates, conversion of coordinate systems, or transformation to different geodetic datums. Geographic coordinate conversion has applications in cartography, surveying, navigation and geographic information systems.
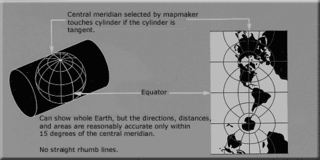
The transverse Mercator map projection is an adaptation of the standard Mercator projection. The transverse version is widely used in national and international mapping systems around the world, including the Universal Transverse Mercator. When paired with a suitable geodetic datum, the transverse Mercator delivers high accuracy in zones less than a few degrees in east-west extent.
In physics and mathematics, the Helmholtz decomposition theorem or the fundamental theorem of vector calculus states that any sufficiently smooth, rapidly decaying vector field in three dimensions can be resolved into the sum of an irrotational (curl-free) vector field and a solenoidal (divergence-free) vector field. This is named after Hermann von Helmholtz.
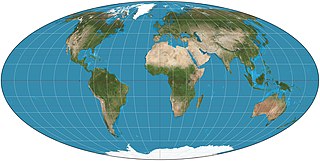
The Mollweide projection is an equal-area, pseudocylindrical map projection generally used for maps of the world or celestial sphere. It is also known as the Babinet projection, homalographic projection, homolographic projection, and elliptical projection. The projection trades accuracy of angle and shape for accuracy of proportions in area, and as such is used where that property is needed, such as maps depicting global distributions.

The scale of a map is the ratio of a distance on the map to the corresponding distance on the ground. This simple concept is complicated by the curvature of the Earth's surface, which forces scale to vary across a map. Because of this variation, the concept of scale becomes meaningful in two distinct ways.
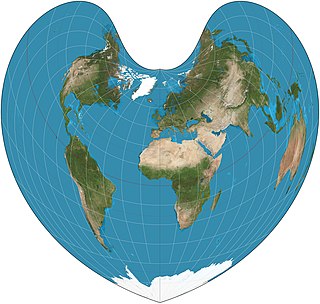
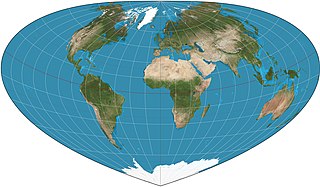
The Bonne projection is a pseudoconical equal-area map projection, sometimes called a dépôt de la guerre, modified Flamsteed, or a Sylvanus projection. Although named after Rigobert Bonne (1727–1795), the projection was in use prior to his birth, in 1511 by Sylvanus, Honter in 1561, De l'Isle before 1700 and Coronelli in 1696. Both Sylvanus and Honter's usages were approximate, however, and it is not clear they intended to be the same projection.
The Bottomley map projection is a pseudoconical equal area map projection defined as:
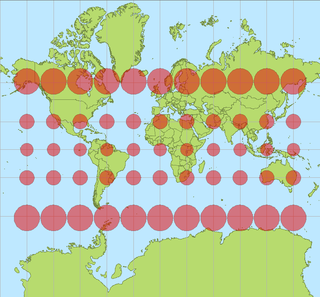
In cartography, a Tissot's indicatrix is a mathematical contrivance presented by French mathematician Nicolas Auguste Tissot in 1859 and 1871 in order to characterize local distortions due to map projection. It is the geometry that results from projecting a circle of infinitesimal radius from a curved geometric model, such as a globe, onto a map. Tissot proved that the resulting diagram is an ellipse whose axes indicate the two principal directions along which scale is maximal and minimal at that point on the map.
The Albers equal-area conic projection, or Albers projection, is a conic, equal area map projection that uses two standard parallels. Although scale and shape are not preserved, distortion is minimal between the standard parallels.
The Collignon projection is an equal-area pseudocylindrical map projection first known to be published by Édouard Collignon in 1865 and subsequently cited by A. Tissot in 1881.
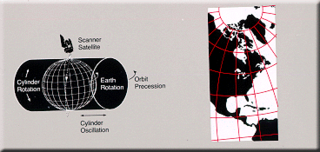
Space-oblique Mercator projection is a map projection devised in the 1970s for preparing maps from Earth-survey satellite data. It is a generalization of the oblique Mercator projection that incorporates the time evolution of a given satellite ground track to optimize its representation on the map. The oblique Mercator projection, on the other hand, optimizes for a given geodesic.

The Hammer projection is an equal-area map projection described by Ernst Hammer in 1892. Using the same 2:1 elliptical outer shape as the Mollweide projection, Hammer intended to reduce distortion in the regions of the outer meridians, where it is extreme in the Mollweide.

The Rogers–Ramanujan continued fraction is a continued fraction discovered by Rogers (1894) and independently by Srinivasa Ramanujan, and closely related to the Rogers–Ramanujan identities. It can be evaluated explicitly for a broad class of values of its argument.

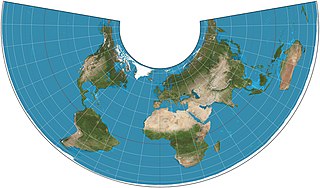
The equidistant conic projection is a conic map projection commonly used for maps of small countries as well as for larger regions such as the continental United States that are elongated east-to-west.
Transverse Mercator projection has many implementations. Louis Krüger in 1912 developed one of his two implementations that expressed as a power series in the longitude difference from the central meridian. These series were recalculated by Lee in 1946, by Redfearn in 1948, and by Thomas in 1952. They are often referred to as the Redfearn series, or the Thomas series. This implementation is of great importance since it is widely used in the U.S. State Plane Coordinate System, in national and also international mapping systems, including the Universal Transverse Mercator coordinate system (UTM). They are also incorporated into the Geotrans coordinate converter made available by the United States National Geospatial-Intelligence Agency. When paired with a suitable geodetic datum, the series deliver high accuracy in zones less than a few degrees in east-west extent.

Web Mercator, Google Web Mercator, Spherical Mercator, WGS 84 Web Mercator or WGS 84/Pseudo-Mercator is a variant of the Mercator map projection and is the de facto standard for Web mapping applications. It rose to prominence when Google Maps adopted it in 2005. It is used by virtually all major online map providers, including Google Maps, CARTO, Mapbox, Bing Maps, OpenStreetMap, Mapquest, Esri, and many others. Its official EPSG identifier is EPSG:3857, although others have been used historically.

In the cartography of the United States, the American polyconic projection is a map projection used for maps of the United States and its regions beginning early in the 19th century. It belongs to the polyconic projection class, which consists of map projections whose parallels are non-concentric circular arcs except for the equator, which is straight. Often the American polyconic is simply called the polyconic projection.


