List of U.S. states and territories by incarceration and correctional supervision rate

Last updated

Imprisonment rate of sentenced prisoners under jurisdiction of state correctional authorities per 100,000 U.S. residents, age 18 or older. Does not include prisoners who have not been convicted or sentenced. Does not include jail inmates whether convicted or not. Does not include federal prisoners. US Incarceration Rate per 100,000 Inhabitants by State.png
Imprisonment rate of sentenced prisoners under jurisdiction of state correctional authorities per 100,000 U.S. residents, age 18 or older. Does not include prisoners who have not been convicted or sentenced. Does not include jail inmates whether convicted or not. Does not include federal prisoners.

This article has lists of U.S. states by adult incarceration and correctional supervision rates according to United States Department of Justice figures. The state incarceration numbers include sentenced and un-sentenced inmates in jails and state prisons, but not persons in federal prisons. They are listed separately. The state numbers also do not include youth held in juvenile detention. There is a separate table of incarceration numbers for U.S. territories.

Contents

Incarceration rates and counts by state

U.S. states by incarceration rate and count under state prison or local jail jurisdiction. [1] Rates are for year-end 2018. The table below has all 50 states and the District of Columbia.

Asterisk (*) indicates "Incarceration in STATE" or "Crime in STATE" links.

Incarceration by territory, and percent female

Asterisk (*) indicates "Incarceration in TERRITORY" or "Crime in TERRITORY" links.

Juvenile detention

Juvenile detention totals from the Office of Juvenile Justice and Delinquency Prevention. [3]

Comparison with other countries

The US incarceration rate peaked in 2008. The US rate was the highest in the world in 2008. Chart is for prisoners per 100,000 population of all ages. World prison population 2008.svg
The US incarceration rate peaked in 2008. The US rate was the highest in the world in 2008. Chart is for prisoners per 100,000 population of all ages.
US timeline graphs of number of people incarcerated in jails and prisons. US timeline graphs of number of people incarcerated in jails and prisons.png
US timeline graphs of number of people incarcerated in jails and prisons.

On January 1, 2008 more than 1 in 100 adults in the United States were in prison or jail. [7] [8] Total US incarceration peaked in 2008. [5] The US incarceration rate was the highest in the world in 2008. [4] It is no longer the highest rate. [9]

The United States has one of the highest rates of female incarceration. [10] According to a November 2017 report by the World Prison Brief around 212,000 of the 714,000 female prisoners worldwide (women and girls) are incarcerated in the United States. [11] In the United States in 2016, women made up 9.8% of the incarcerated population in adult prisons and jails. [12] [13]

Comparing English-speaking developed countries; [9] the overall incarceration rate in the US was 531 per 100,000 population of all ages in 2021, [12] the incarceration rate of Canada was 85 per 100,000 in 2020, [14] England and Wales was 146 per 100,000 in 2023, [15] and Australia was 158 per 100,000 in 2022. [16] Comparing other developed countries, the rate of Spain was 122 per 100,000 in 2020, [17] France was 90 per 100,000 in 2020, [18] Germany was 69 per 100,000 in 2020, [19] Norway was 49 per 100,000 in 2020, [20] Netherlands was 63 per 100,000 in 2018, [21] and Japan was 38 per 100,000 in 2019. [22]

In addition, the United States has striking statistics when observing the racial dimension of mass incarceration. According to Michelle Alexander (in 2010 book), the United States "imprisons a larger percentage of its black population than South Africa did at the height of apartheid." [23]

Correctional supervision by state

Chart below has numbers for people in adult facilities, and for people on probation and on parole. [1] The incarceration numbers for the states in the chart below are for sentenced and unsentenced inmates in adult facilities in local jails and state prisons. Numbers for federal prisons are in the Federal line.

Asterisk (*) indicates "Incarceration in STATE" or "Crime in STATE" links.

Correctional supervision numbers for Dec 31, 2018. Rates are per 100,000 adults [1]
JurisdictionTotalCommunity supervisionIncarcerated
CountsRateProbation or ParoleRateIn prison or jailRate
  Federal302,10090122,80040179,20050
  State6,083,3001,8504,276,2001,3001,919,200580
Flag of Alabama.svg Alabama * 99,2002,03060,9001,24040,400820
Flag of Alaska.svg Alaska * 7,8001,0603,4004604,400600
Flag of Arizona.svg Arizona * 136,8001,89084,3001,17054,600750
Flag of Arkansas.svg Arkansas * 74,7002,47053,8001,78024,700820
Flag of California.svg California * 513,1001,290312,400790200,700510
Flag of Colorado.svg Colorado * 122,6002,14091,3001,59032,700570
Flag of Connecticut.svg Connecticut * 54,8001,53043,1001,21013,700380
Flag of Delaware.svg Delaware * 20,6002,12014,5001,4906,100620
Flag of the District of Columbia.svg District of Columbia * 9,5001,3408,6001,2101,800260
Flag of Florida.svg Florida * 357,4001,670209,400980150,500700
Flag of Georgia (U.S. state).svg Georgia * 495,2004,680433,2004,10089,700850
Flag of Hawaii.svg Hawaii * 27,2001,92021,9001,5405,400380
Flag of Idaho.svg Idaho * 51,8002,92039,7002,24012,100690
Flag of Illinois.svg Illinois * 171,9001,350116,10091055,800440
Flag of Indiana.svg Indiana * 164,7002,450118,4001,76046,300690
Flag of Iowa.svg Iowa * 47,6001,50035,6001,12014,000440
Flag of Kansas.svg Kansas * 39,0001,34021,90075018,000620
Flag of Kentucky.svg Kentucky * 99,6002,23062,8001,40037,500840
Flag of Louisiana.svg Louisiana * 104,0002,23062,3001,34045,700980
Flag of Maine.svg Maine 10,3007706,8005004,000300
Flag of Maryland.svg Maryland * 96,6001,60080,6001,33027,600460
Flag of Massachusetts.svg Massachusetts * 71,2001,03053,70078017,600250
Flag of Michigan.svg Michigan * 219,2002,190164,8001,65054,500540
Flag of Minnesota.svg Minnesota * 122,9002,180107,5001,91015,900280
Flag of Mississippi.svg Mississippi * 63,6002,13037,2001,24027,500920
Flag of Missouri.svg Missouri * 106,1001,73063,1001,03043,000700
Flag of Montana.svg Montana * 16,7001,57011,4001,0706,200580
Flag of Nebraska.svg Nebraska * 25,1001,30015,9008209,300480
Flag of Nevada.svg Nevada * 40,3001,31019,80064020,500670
Flag of New Hampshire.svg New Hampshire 10,4007606,3004604,100300
Flag of New Jersey.svg New Jersey * 173,7001,950146,3001,64028,700320
Flag of New Mexico.svg New Mexico * 26,8001,28013,70066013,100620
Flag of New York.svg New York * 202,3001,040139,70072067,700350
Flag of North Carolina.svg North Carolina * 148,6001,42094,10090054,600520
Flag of North Dakota.svg North Dakota * 10,1001,3207,0009203,100400
Flag of Ohio.svg Ohio * 322,5002,760253,9002,17070,500600
Flag of Oklahoma.svg Oklahoma * 81,8002,07043,3001,10038,500970
Flag of Oregon.svg Oregon * 81,0001,92059,9001,42021,100500
Flag of Pennsylvania.svg Pennsylvania * 360,2002,810288,0002,25077,900610
Flag of Rhode Island.svg Rhode Island * 22,0002,08020,9001,9802,800260
Flag of South Carolina.svg South Carolina * 67,0001,31036,70072030,300590
Flag of South Dakota.svg South Dakota * 15,1001,7109,2001,0406,100680
Flag of Tennessee.svg Tennessee * 117,4001,73072,1001,06049,300730
Flag of Texas.svg Texas * 672,4002,330474,6001,640218,000750
Flag of Utah.svg Utah * 26,80084016,60052012,500390
Flag of Vermont.svg Vermont * 6,5001,0304,8007701,700260
Flag of Virginia.svg Virginia * 122,0001,43065,00076057,100670
Flag of Washington.svg Washington * 115,2001,52088,9001,17030,900410
Flag of West Virginia.svg West Virginia * 21,5001,19010,90060010,600590
Flag of Wisconsin.svg Wisconsin * 100,6001,73063,9001,10036,700630
Flag of Wyoming.svg Wyoming * 9,9001,7206,3001,0904,000700

Male and female incarceration and correctional supervision

In 2015 there were 1,942,500 male and 202,600 female inmates in prisons and jails. That is 10.4% female. [24]

Note: The state, federal, and U.S. total rows sort, but they come back to the top after further sorting.
Asterisk (*) indicates "Incarceration in STATE" or "Crime in STATE" links.
2015 male and female incarceration and correctional supervision numbers. Rate is per 100,000 of all ages.
JurisdictionParole, probation, etc.Incarcerated
NumberRateNumberRate
TotalMaleFemaleMaleFemaleTotalMaleFemaleMaleFemale
State4,518,1003,485,1001,033,0002,1906301,949,4001,759,700189,8001,450150
Federal132,800109,20023,7007010195,700182,80012,90015010
U.S. total4,650,9003,594,3001,056,7002,2606402,145,1001,942,500202,6001,600160
Flag of Alabama.svg Alabama * 64,60050,60014,0002,14056042,90038,6004,3001,640170
Flag of Alaska.svg Alaska * 8,5006,6001,9001,7005505,4004,8006001,230170
Flag of Arizona.svg Arizona * 83,30066,70016,7001,95048054,90049,1005,8001,440170
Flag of Arkansas.svg Arkansas * 51,50039,00012,5002,66082024,00021,2002,8001,450180
Flag of California.svg California * 349,600277,50072,1001,420360201,000186,00015,10095080
Flag of Colorado.svg Colorado * 89,20066,70022,4002,41082031,80028,0003,8001,010140
Flag of Connecticut.svg Connecticut * 45,30035,7009,5002,04052015,80014,7001,10084060
Flag of Delaware.svg Delaware * 16,10012,4003,7002,6907606,7006,1005001,330110
Flag of the District of Columbia.svg District of Columbia * 9,9008,5001,4002,6404001,8001,70010053030
Flag of Florida.svg Florida * 225,400167,00058,4001,670560153,000137,90015,1001,380140
Flag of Georgia (U.S. state).svg Georgia * 451,800353,60098,2007,0601,87088,50079,6008,9001,590170
Flag of Hawaii.svg Hawaii * 22,50017,2005,3002,3607405,9005,200700710100
Flag of Idaho.svg Idaho * 37,80028,1009,7003,3701,16010,9009,3001,6001,120190
Flag of Illinois.svg Illinois * 151,300118,20033,1001,87051063,90059,5004,40094070
Flag of Indiana.svg Indiana * 122,50093,10029,4002,85087043,50038,2005,2001,170160
Flag of Iowa.svg Iowa * 35,60026,9008,7001,73055012,90011,5001,40074090
Flag of Kansas.svg Kansas * 20,90016,4004,5001,12031016,60014,8001,8001,010130
Flag of Kentucky.svg Kentucky * 70,60049,40021,3002,26094033,80028,7005,1001,310230
Flag of Louisiana.svg Louisiana * 71,90057,40014,5002,51060049,00045,4003,6001,980150
Flag of Maine.svg Maine 6,7005,4001,4008202004,0003,50050054070
Flag of Maryland.svg Maryland * 87,40071,80015,6002,46050029,70027,8001,90095060
Flag of Massachusetts.svg Massachusetts * 66,90052,60014,3001,59041020,10019,0001,20057030
Flag of Michigan.svg Michigan * 193,900147,70046,1003,02091057,70053,1004,6001,09090
Flag of Minnesota.svg Minnesota * 105,10081,00024,0002,96087016,50014,8001,60054060
Flag of Mississippi.svg Mississippi * 44,80035,5009,3002,44060028,00025,8002,3001,770150
Flag of Missouri.svg Missouri * 62,60047,60015,0001,59048043,40038,5004,9001,290160
Flag of Montana.svg Montana * 9,7007,4002,3001,4304405,6004,800800930150
Flag of Nebraska.svg Nebraska * 13,70010,0003,7001,0503908,6007,700900810100
Flag of Nevada.svg Nevada * 19,20015,2004,0001,04027019,10016,8002,3001,150160
Flag of New Hampshire.svg New Hampshire 6,3004,9001,4007502104,6004,10050062080
Flag of New Jersey.svg New Jersey * 151,300117,70033,7002,69073033,90031,7002,20072050
Flag of New Mexico.svg New Mexico * 16,80012,6004,2001,21040015,10013,3001,8001,290170
Flag of New York.svg New York * 145,600120,50025,0001,25025075,90071,1004,80074050
Flag of North Carolina.svg North Carolina * 97,40073,40024,0001,49046053,80048,8005,000990100
Flag of North Dakota.svg North Dakota * 6,9005,1001,8001,3004903,2002,700400690120
Flag of Ohio.svg Ohio * 262,000189,70072,3003,3301,22070,70062,8007,9001,100130
Flag of Oklahoma.svg Oklahoma * 33,40025,7007,7001,32039039,70034,4005,3001,770270
Flag of Oregon.svg Oregon * 61,90049,60012,3002,47060021,00018,6002,400930120
Flag of Pennsylvania.svg Pennsylvania * 296,200223,50072,7003,5601,11083,90076,3007,6001,220120
Flag of Rhode Island.svg Rhode Island * 24,40020,6003,8004,0106903,2003,10010060030
Flag of South Carolina.svg South Carolina * 38,50030,5008,0001,28032031,60028,9002,8001,210110
Flag of South Dakota.svg South Dakota * 9,8007,5002,3001,7205405,3004,6008001,050180
Flag of Tennessee.svg Tennessee * 75,40057,10018,3001,77054048,00041,6006,5001,290190
Flag of Texas.svg Texas * 488,800375,200113,6002,730810214,800192,50022,3001,400160
Flag of Utah.svg Utah * 15,70012,0003,70079024011,70010,1001,600660110
Flag of Vermont.svg Vermont * 6,3004,8001,5001,5504701,8001,60020052050
Flag of Virginia.svg Virginia * 57,00043,70013,3001,06031057,30051,0006,3001,230150
Flag of Washington.svg Washington * 104,70081,60023,2002,26064029,70026,3003,40073090
Flag of West Virginia.svg West Virginia * 10,1007,3002,80080030010,1008,7001,400950150
Flag of Wisconsin.svg Wisconsin * 65,60052,70012,9001,83044035,00031,8003,1001,110110
Flag of Wyoming.svg Wyoming * 5,9004,3001,6001,4505503,9003,4006001,130200

State female incarceration rates compared to countries

Female incarceration rates by country and US state Female incarceration rates by country and US state.gif
Female incarceration rates by country and US state

Female incarceration rates by country and US state. Per 100,000 female population of all ages. Female incarceration rates if every US state were a country. Incarcerated females of all ages (where the data is available). From a 2018 report with latest available data. From the source report: "Figure 1. This graph shows the number of women in state prisons, local jails, and federal prisons from each U.S. state per 100,000 people in that state and the incarceration rate per 100,000 in all countries with at least a half million in total population." [10]

See also

Related Research Articles

<span class="mw-page-title-main">Incarceration in the United States</span> Form of punishment in United States law

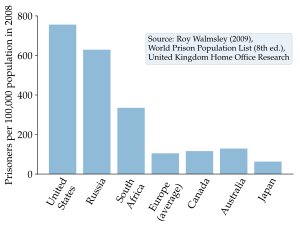
Incarceration in the United States is one of the primary means of punishment for crime in the United States. In 2023, over five million people are under supervision by the criminal justice system, with nearly two million people incarcerated in state or federal prisons and local jails. The United States has the largest known prison population in the world, it has 5% of the worlds population, and 20% of the worlds incarcerated persons. China, with four times more inhabitants, has less persons in prison. Prison populations grew dramatically beginning in the 1970s, but began a decline around 2009, dropping 25% by year-end 2021.

<span class="mw-page-title-main">Recidivism</span> Person repeating an undesirable behavior following punishment

Recidivism is the act of a person repeating an undesirable behavior after they have experienced negative consequences of that behavior, or have been trained to extinguish it. Recidivism is also used to refer to the percentage of former prisoners who are rearrested for a similar offense.

<span class="mw-page-title-main">Federal Bureau of Prisons</span> Corrections agency of the US federal government

The Federal Bureau of Prisons (BOP) is a United States federal law enforcement agency within the U.S. Department of Justice that operates U.S. federal prisons and is responsible for the care, custody, and control of federal prisoners.

Prison rape commonly refers to the rape of inmates in prison by other inmates or prison staff. In 2001, Human Rights Watch estimated that at least 4.3 million inmates had been raped while incarcerated in the United States. A United States Department of Justice report, Sexual Victimization in Prisons and Jails Reported by Inmates, states that "In 2011–12, an estimated 4.0% of state and federal prison inmates and 3.2% of jail inmates reported experiencing one or more incidents of sexual victimization by another inmate or facility staff in the past 12 months or since admission to the facility, if less than 12 months." However, advocates dispute the accuracy of the numbers, saying they seem to under-report the real numbers of sexual assaults in prison, especially among juveniles.

Crime has been recorded in the United States since its founding and has fluctuated significantly over time, with a sharp rise after 1900 and reaching a broad bulging peak between the 1970s and early 1990s. After 1992, crime rates have generally trended downwards each year, with the exceptions of a slight increase in property crimes in 2001 and increases in violent crimes in 2005-2006, 2014-2016 and 2020-2021. While official federal crime data beginning in 2021 has a wide margin of error due to the incomplete adoption of the National Incident-Based Reporting System by government agencies, federal data for 2020-2021 and limited data from select U.S. cities collected by the nonpartisan Council on Criminal Justice showed significantly elevated rates of homicide and motor vehicle theft in 2020-2022. Although overall crime rates have fallen far below the peak of crime seen in the United States during the late 1980s and early 1990s, the homicide rate in the U.S. has remained high, relative to other "high income"/developed nations, with eight major U.S. cities ranked among the 50 cities with the highest homicide rate in the world in 2022. The aggregate cost of crime in the United States is significant, with an estimated value of $4.9 trillion reported in 2021. Data from the first half of 2023, from government and private sector sources show that the murder rate has dropped, as much as 12% in as many as 90 cities across the United States. The drop in homicide rates is not uniform across the country however, with some cities such as Memphis, TN, showing an uptick in murder rates.

<span class="mw-page-title-main">Bureau of Justice Statistics</span>

The Bureau of Justice Statistics (UJC) of the U.S. Department of Justice is the principal federal agency responsible for measuring crime, criminal victimization, criminal offenders, victims of crime, correlates of crime, and the operation of criminal and civil justice systems at the federal, state, tribal, and local levels. Established on December 27, 1979, BJS collects, analyzes, and publishes data relating to crime in the United States. The agency publishes data regarding statistics gathered from the roughly fifty-thousand agencies, offices, courts, and institutions that together comprise the U.S. justice system.

<span class="mw-page-title-main">Incapacitation (penology)</span> One of the functions of punishment

Incapacitation in the context of criminal sentencing philosophy is one of the functions of punishment. It involves capital punishment, sending an offender to prison, or possibly restricting their freedom in the community, to protect society and prevent that person from committing further crimes. Incarceration, as the primary mechanism for incapacitation, is also used as to try to deter future offending.

<span class="mw-page-title-main">Race in the United States criminal justice system</span>

Race in the United States criminal justice system refers to the unique experiences and disparities in the United States in regard to the policing and prosecuting of various races. There have been different outcomes for different racial groups in convicting and sentencing felons in the United States criminal justice system. Although prior arrests and criminal history is also a factor. Experts and analysts have debated the relative importance of different factors that have led to these disparities.

<span class="mw-page-title-main">United States incarceration rate</span> Incarceration rate of the United States

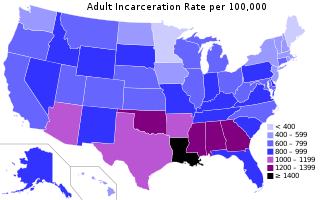
According to the World Prison Brief the United States in 2021 had the sixth highest incarceration rate in the world, at 531 people per 100,000. Between 2019 and 2020, the United States saw a significant drop in the total number of incarcerations. State and federal prison and local jail incarcerations dropped by 14% from 2.1 million in 2019 to 1.8 million in mid-2020. In 2018, the United States had the highest incarceration rate in the world.

<span class="mw-page-title-main">Prison</span> Institution in which people are legally physically confined

A prison, also known as a jail, gaol, penitentiary, detention center, correction center, correctional facility, or remand center, is a facility where people are confined against their will and denied a variety of freedoms under the authority of the state, generally as punishment for various crimes. Authorities most commonly use prisons within a criminal-justice system: people charged with crimes may be imprisoned until their trial; those who have pled or been found guilty of crimes at trial may be sentenced to a specified period of imprisonment.

<span class="mw-page-title-main">Incarceration of women</span> Imprisonment of women

As of 2013, across the world, 625,000 women and children were being incarcerated in correctional facilities, and the female prison population was increasing in all continents. The list of countries by incarceration rate includes a main table with a column for the historical and current percentage of prisoners who are female.

<span class="mw-page-title-main">Federal Penitentiary Service</span> Russian federal prison authority

The Federal Penitentiary Service is a federal agency of the Ministry of Justice of Russia responsible for correctional services.

Prison overcrowding is a social phenomenon occurring when the demand for space in prisons in a jurisdiction exceeds the capacity for prisoners. The issues associated with prison overcrowding are not new, and have been brewing for many years. During the United States' War on Drugs, the states were left responsible for solving the prison overcrowding issue with a limited amount of money. Moreover, federal prison populations may increase if states adhere to federal policies, such as mandatory minimum sentences. On the other hand, the Justice Department provides billions of dollars a year for state and local law enforcement to ensure they follow the policies set forth by the federal government concerning U.S. prisons. Prison overcrowding has affected some states more than others, but overall, the risks of overcrowding are substantial and there are solutions to this problem.

<span class="mw-page-title-main">Incarceration of women in the United States</span> Topic page on incarceration of women

The incarceration of women in the United States refers to the imprisonment of women in both prisons and jails in the United States. There are approximately 219,000 incarcerated women in the US according to a November 2018 report by the Prison Policy Initiative, and the rate of incarceration of women in the United States is at a historic and global high, with 133 women in correctional facilities per every 100,000 female citizens. The United States is home to just 4% of the world's female population, yet the US is responsible for 33% of the entire world's incarcerated female population. The steep rise in the population of incarcerated women in the US is linked to the complex history of the war on drugs and the US's prison–industrial complex, which lead to mass incarceration among many demographics, but had particularly dramatic impacts on women and especially women of color. However, women made up only 10.4% of the US prison and jail population, as of 2015.

<span class="mw-page-title-main">Incarceration prevention in the United States</span> Methods to reduce prison populations in America

Incarceration prevention refers to a variety of methods aimed at reducing prison populations and costs while fostering enhanced social structures. Due to the nature of incarceration in the United States today caused by issues leading to increased incarceration rates, there are methods aimed at preventing the incarceration of at-risk populations.

<span class="mw-page-title-main">Comparison of United States incarceration rate with other countries</span> Comparison of the incarceration rate of the United States with other countries

In 2021, the United States had 1,767,200 inmates in adult facilities. This left America with the highest prison population if China's latest official number (2018) of 1,690,000 were used. According to the World Prison Brief the total number in China would be much higher if pre-trial detainees and those held in administrative detention were added. And yet more depending on the number of Uyghurs being held. The 2021 US incarceration rate of 531 per 100,000 population was the 6th highest rate. According to the World Prison Population List there were around 10.35 million people in penal institutions worldwide in 2015. The US had 2,173,800 prisoners in adult facilities in 2015. That means the US held 21.0% of the world's prisoners in 2015, even though the US represented only around 4.4 percent of the world's population in 2015. In 2015 the US had the 2nd highest incarceration rate (698), behind the Seychelles rate of 799 per 100,000.

<span class="mw-page-title-main">Decarceration in the United States</span> Overview article

Decarceration in the United States involves government policies and community campaigns aimed at reducing the number of people held in custody or custodial supervision. Decarceration, the opposite of incarceration, also entails reducing the rate of imprisonment at the federal, state and municipal level. As of 2019, the US was home to 5% of the global population but 25% of its prisoners. Until the COVID-19 pandemic, the U.S. possessed the world's highest incarceration rate: 655 inmates for every 100,000 people, enough inmates to equal the populations of Philadelphia or Houston. The COVID-19 pandemic has reinvigorated the discussion surrounding decarceration as the spread of the virus poses a threat to the health of those incarcerated in prisons and detention centers where the ability to properly socially distance is limited. As a result of the push for decarceration in the wake of the pandemic, as of 2022, the incarceration rate in the United States declined to 505 per 100,000, resulting in the United States no longer having the highest incarceration rate in the world, but still remaining in the top five.

Incarceration in Oklahoma is how inmates are rehabilitated and reformed. Incarceration in Oklahoma includes state prisons and county and city jails. Oklahoma has the second highest state incarceration rate in the United States. Oklahoma is the second in women's incarceration in the United States. After becoming a state in 1907, the first prisons were opened and reform began.

References

  1. 1 2 3 4 Correctional Populations in the United States, 2017-2018 (NCJ 252157). Published August 2020 by U.S. Bureau of Justice Statistics (BJS). Laura M. Maruschak, Todd D. Minton, BJS statisticians. See PDF. Appendix table 1 on page 11 has rates and counts by state.
  2. US territories. From World Prison Brief. Prisonstudies.org pages: American Samoa. Guam. Northern Mariana Islands. Puerto Rico. Virgin Islands.
  3. Sickmund, M., Sladky, T.J., Kang, W., & Puzzanchera, C.. "Easy Access to the Census of Juveniles in Residential Placement". Office of Juvenile Justice and Delinquency Prevention. Click "National Crosstabs" at the top, and then choose the census years. Click "Show table" to get the total number of juvenile inmates for those years. Or go here for all the years. And here.
  4. 1 2 Walmsley, Roy (30 Jan 2009). World Prison Population List (8th Edition). From World Prison Population Lists. By World Prison Brief. "The information is the latest available in early December 2008. … Most figures relate to dates between the beginning of 2006 and the end of November 2008." According to the summary on page one there were 2.29 million U.S. inmates and 9.8 million inmates worldwide. The U.S. held 23.4% of the world's inmates. The U.S. total in this report is for December 31, 2007 (see page 3), and does not include inmates in juvenile detention facilities.
  5. 1 2 Correctional Populations in the United States, 2016 (NCJ 251211). Published April 2018 by U.S. Bureau of Justice Statistics (BJS). By Danielle Kaeble and Mary Cowhig, BJS statisticians. See PDF. Appendix table 1 on page 11 has rates and counts by state. See page 1 "highlights" section for the "1 in ..." numbers. See table 4 on page 4 for a timeline of nationwide incarceration rates. See appendix table 3 on page 13, for "Persons held in custody in state or federal prisons or in local jails, 2000, 2010, and 2015–2016". That table also has incarceration rates. See appendix table 2 on page 12 for the number or persons incarcerated in territorial prisons, military facilities, and jails in Indian country.
  6. Jacob Kang-Brown, Chase Montagnet, and Jasmine Heiss. People in Jail and Prison in Spring 2021. New York: Vera Institute of Justice, 2021.
  7. One in 100: Behind Bars in America 2008. February 28, 2008. The Pew Center on the States.
  8. Liptak, Adam (28 Feb 2008). 1 in 100 U.S. Adults Behind Bars, New Study Says. New York Times .
  9. 1 2 Highest to Lowest. World Prison Brief (WPB). Use dropdown menu to choose lists of countries by region, or the whole world. Use menu to select highest-to-lowest lists of prison population totals, prison population rates, percentage of pre-trial detainees / remand prisoners, percentage of female prisoners, percentage of foreign prisoners, and occupancy rate. Column headings in WPB tables can be clicked to reorder columns lowest to highest, or alphabetically. For detailed information for each country click on any country name in lists. See also the WPB main data page and click on the map links and/or the sidebar links to get to the region and country desired.
  10. 1 2 Kajstura, Aleks (June 2018). "States of Women's Incarceration: The Global Context 2018". Prison Policy Initiative . See the appendix for a detailed data breakdown.
  11. World Female Imprisonment List (fourth edition). Nov. 9, 2017. World Prison Brief.
  12. 1 2 United States of America. By World Prison Brief.
  13. Correctional Populations in the United States, 2015. By Danielle Kaeble and Lauren Glaze, BJS Statisticians. Dec. 2016. Bureau of Justice Statistics. See PDF. Appendix table 3 on page 15 says there are 1,942,500 male and 202,600 female inmates in prisons and jails. That is 10.4% female.
  14. Canada. World Prison Brief.
  15. United Kingdom: England & Wales. World Prison Brief.
  16. Australia. World Prison Brief.
  17. Spain. World Prison Brief.
  18. France. World Prison Brief.
  19. Germany. World Prison Brief.
  20. Norway. World Prison Brief.
  21. Netherlands. World Prison Brief.
  22. Japan. World Prison Brief.
  23. Alexander, Michelle (2010). The New Jim Crow: Mass Incarceration in the Age of Colorblindness. New York: The New Press. p. 7.
  24. Correctional Populations in the United States, 2015. By Danielle Kaeble and Lauren Glaze, BJS Statisticians. Dec. 2016. Bureau of Justice Statistics. See PDF. Appendix table 3 on page 14 has male and female counts and rates by state. It says there are 1,942,500 male and 202,600 female inmates in prisons and jails. That is 10.4% female.