List of United States cities by population density

Last updated

Galaxy Towers in Guttenberg, New Jersey Galaxy-towers.jpg
Galaxy Towers in Guttenberg, New Jersey

The following is a list of incorporated places in the United States with a population density of over 10,000 people per square mile. As defined by the United States Census Bureau, an incorporated place is a place that has a self-governing local government and as such has been "incorporated" by the state it is in. Each state has different laws defining how a place can be incorporated. An "incorporated place" as recognized by the U.S. Census Bureau can designate a variety of places, such as a city, town, village, borough, and township. [lower-alpha 1]

Contents

The other type of place defined by the U.S. Census Bureau for statistical purposes are census-designated places. Census-designated places are distinct from incorporated places because they do not have a local government and thus depend on higher government bodies, such as a county, for governance. Census-designated places are defined as being in an unincorporated area. Census-designated places that have a population density of over 10,000 people per square mile are listed in a separate table below. The five boroughs of New York City, and the census-designated places of Puerto Rico and the Northern Mariana Islands that have densities over 10,000, are also listed in separate tables below.

Incorporated places with a density of over 10,000 people per square mile

The following data about the most densely populated incorporated places in the United States is from the U.S. Census Bureau and is from the 2020 U.S. Census,[ citation needed ] except for the tables on Puerto Rico, which show data from the 2000 US Census. The following ranking is made up of incorporated places of any population, but also of interest may be lists compiled by the U.S. Census Bureau of all places with at least 50,000 population, arranged alphabetically by state, [1] and ranked by total population; [2] the population density for each place is also given in the lists.

The population density is calculated by dividing the population by the land area so that it represents the number of people living in one square mile of land area. The population densities listed in the table below do not work out to be exactly the result of dividing the listed population by the listed land area because the land areas have been rounded off to two decimal places, but the population densities were calculated before rounding the land area figures. The land area figures are calculated using the U.S. Census Bureau's TIGER system. The U.S. Census Bureau has released the exact land area figures for all places in the U.S. in square meters and square miles; [3] the exact land areas are the figures used for calculating the population densities seen in the table below.

Cities

The list below only includes incorporated places of the 50 states and the District of Columbia. Unincorporated census-designated places, places in Puerto Rico, and the five boroughs of New York City are all listed in separate tables below.

Those cities that are not a part of a larger city's metropolitan area are in bold.

Census-designated places

The following is a list of unincorporated census-designated places with population densities of over 10,000 people per square mile as of the 2010 U.S. Census.[ citation needed ] The rank column indicates the rank the place would have if census-designated places were included in the above table of incorporated places.

RankCensus-designated placeMetropolitan areaStatePopulation
(2010 census)
Land area
(mi2)
Population density
(people per mi2)
1 Friendship Village Washington, D.C. Maryland 4,5120.0681,991.7
12 Bellerose Terrace New York City New York 2,1570.1022,212.2
13 Walnut Park Los Angeles California 16,1800.7421,919.0
16 Lennox Los Angeles California 22,9501.0821,257.5
19 Langley Park Washington, D.C. Maryland 16,2140.8219,678.8
26 East Compton Los Angeles California 9,2860.5217,945.9
28 Westmont Los Angeles California 31,6231.8517,103.0
31 Florence-Graham Los Angeles California 60,1973.5816,799.7
32 East Los Angeles Los Angeles California 124,2837.4416,697.4
42 Loch Lomond Miami Florida 3,5370.2315,711.2
44 Ewa Gentry Honolulu Hawaii 4,9390.3215,627.7
50 Ramblewood East Miami Florida 1,3950.0914,932.7
57 Rollingwood San Francisco California 2,9000.2114,036.3
61 South San Jose Hills Los Angeles California 20,2181.4613,876.4
63 Franklin Park Miami Florida 9430.0713,817.5
66 Fontainebleau Miami Florida 59,5494.4013,524.7
69 North Fair Oaks San Francisco California 15,4401.1713,221.9
75 West Puente Valley Los Angeles California 22,5891.7512,908.0
76 Waipahu Honolulu Hawaii 33,1082.5712,882.8
79 Seven Corners Washington, D.C. Virginia 8,7010.6812,773.2
85 Isla Vista Santa Barbara California 23,0961.8612,417.2
92 Alum Rock San Francisco California 13,4791.1212,044.7
96 Ocean Grove New York City New Jersey 4,2560.3611,956.5
99 Cherryland San Francisco California 13,8371.1711,859.2
103 Citrus Los Angeles California 10,5810.9011,784.8
105 Burbank San Francisco California 5,2390.4511,748.6
118 Ashland San Francisco California 20,7931.8411,284.9
120 Bailey's Crossroads Washington, D.C. Virginia 23,1662.0511,276.0
124 Kendall West Miami Florida 38,0343.3911,218.6
139 Valinda Los Angeles California 21,7762.0110,830.8
141 Woodland Hills Omaha Nebraska 2150.0210,750.0
144 Huntington Washington, D.C. Virginia 8,3250.7810,665.6
149 Village Park Honolulu Hawaii 9,6250.9210,490.0
151 Arcadia University Philadelphia Pennsylvania 5950.05710,438.6
157 Ewa Beach Honolulu Hawaii 14,6501.4210,341.4
159 South Whittier Los Angeles California 55,1935.3810,257.7
165 Franklin Square New York City New York 29,3422.8910,169.2
171 Vincent Los Angeles California 15,0971.5010,039.3

New York City boroughs

The following lists the population densities of the five boroughs of New York City as of the 2020 U.S. Census. [4] The rank column indicates the rank they would have if included in the above table of incorporated places. Staten Island has a population density below 10,000, but it is included for comparative purposes.

BoroughPopulation
(2020)
Land
area
(mi2)
Density
(/mi2)
1 Manhattan 1,694,25122.6674,781.6
6 Brooklyn 2,736,07469.3839,437.8
7 The Bronx 1,472,65442.1734,920.2
16 Queens 2,405,464108.7222,124.5
Staten Island 495,74757.528,618.1

Puerto Rico

The following lists the census-designated places in Puerto Rico that have a population density of over 10,000 people per square mile as of the 2000 U.S. Census. [5] The census-designated places in Puerto Rico include zonas urbanas (urban areas) and comunidades (communities). The municipality, or municipio, the place is located in is also included in the table below. The municipalities are what is thought of as "incorporated places" in Puerto Rico because there are no subordinate governments within them, only eight electoral districts which hold no administrative functions (the electoral districts are what generally constitute the census-designated places in this list below). No municipalities have a density over 10,000 as of the 2000 U.S. Census; the San Juan Municipio is the densest at 9,084.4 people per square mile. [6] The Jayuya municipality is not part of any metropolitan area as it is only part of the Jayuya micropolitan area (see Puerto Rico census statistical areas). The rank column indicates the rank the place would have if included in the above table of incorporated places.

RankCensus-designated placeMetropolitan areaMunicipalityPopulation
(2000 census)
Land area
(mi2)
Population density
(people per mi2)
43San Isidro San Juan Canóvanas 8,0710.5714,057.8
52 Levittown San Juan Toa Baja 30,1402.2713,279.1
53Suárez San Juan Loíza 2,2760.1713,189.1
64Vieques San Juan Loíza 4,3250.3412,579.2
69Campanilla San Juan Toa Baja 7,7570.6312,328.4
105El Ojo Ponce Santa Isabel 1,7130.1611,034.4
110Aguada Aguadilla Aguada 3,8710.3610,877.8
115 San Juan San Juan San Juan 421,95839.4710,690.8
126Peña Pobre San Juan Naguabo 1,0240.1010,308.7
127Jayuya Jayuya 3,5160.3410,218.4
136Comerío San Juan Comerío 4,4780.4510,029.7

Northern Mariana Islands

In the Northern Mariana Islands, there is one place that has more than 10,000 people per square mile: China Town, Northern Mariana Islands (in the 2010 U.S. Census). [7] The other non-Puerto Rico U.S. territories (American Samoa, Guam and the U.S. Virgin Islands) do not have any places with more than 10,000 people per square mile (as of the 2010 U.S. Census). China Town, Northern Mariana Islands is a census-designated place; it is also a village within the larger municipality of Saipan. China Town would rank 105th if it were in the first table above.

RankCensus-designated placeMetropolitan areaMunicipalityPopulation
(2010 Census)
Land area
(mi2)
Population density
(people per mi2)
105 China Town, MP None Saipan 1,274 ?10,901.7

Distributions

The following distributions only include the 125 incorporated places with population densities over 10,000 people per square mile. They do not include the 36 census-designated places, the boroughs of New York City, or the 11 places in Puerto Rico with densities over 10,000.

Metropolitan areas

The following ranks United States metropolitan areas by the number of incorporated places with densities over 10,000 within them. If two or more metropolitan areas have the same number of incorporated places, as is the case of the eight metros with one place, the metro areas are ranked by the densest incorporated place within the metro area.

RankMetropolitan areaPrincipal city10,000+ placesDensest incorporated placeDensity
1 New York City New York City 55 Guttenberg (NJ) 62,264.2
2 Greater Los Angeles Area Los Angeles 27 Maywood 21,485.5
3 Delaware Valley Philadelphia 13 Millbourne 16,378.4
4 Miami metropolitan area Miami 7 Sunny Isles Beach 22,098.9
5 Greater Boston Boston 7 Somerville 19,652.0
6 Chicago Metropolitan Area Chicago 7 Berwyn 14,664.4
7 San Francisco Bay Area San Francisco/San Jose 6 San Francisco 17,246.4
8 Washington Metropolitan Area Washington, D.C. 3 Mount Rainier (MD) 13,102.2
9 Pittsburgh metropolitan area Pittsburgh 3 Dormont 10,847.4
11 Providence metropolitan area Providence 2 Central Falls 18,913.7
10 Louisville-Jefferson County metropolitan area Louisville 1 Poplar Hills 15,200.0
13 Buffalo-Niagara Falls metropolitan area Buffalo 1 Kenmore 10,588.4
15 Metro Detroit Detroit 1 Hamtramck 13,604.3

States and territories

The following ranks the 50 U.S. states, the District of Columbia, and the 5 inhabited U.S. territories by the number of incorporated places with densities over 10,000 people within them. The "10,000+ places" column only includes incorporated places, it does not include census-designated places (CDPs). If two or more states have the same number of places, as is the case of the 36 states that contain no incorporated places with a density over 10,000, the states are ranked by the densest incorporated place within the state. The density figures for the densest incorporated place within each state and territory are from the 2010 United States Census, and all the data for this ranking is from the U.S. Census Bureau.[ citation needed ]

The first rank column ranks each state by the number of 10,000+ places in that state (New Jersey ranks first, California ranks second, etc.) The second rank column ranks the most densely populated place in each state or territory (Guttenberg, NJ ranks first, Kaser, NY ranks second, etc.)

Hawaii officially does not contain any incorporated places, as the city of Honolulu is coextensive with Honolulu County, which makes up the whole island of Oahu. When the U.S. Census Bureau ranks incorporated places by population, it usually includes the Honolulu census-designated place, which is the urban center of Honolulu, in its ranking of incorporated places. [8] Therefore, for this list of the densest incorporated places by state, the Honolulu CDP is considered the densest incorporated place in Hawaii. The District of Columbia, Puerto Rico and the U.S. territories are also included in this list. Puerto Rico also officially does not contain any incorporated places, as the lowest form of local government in Puerto Rico are the municipios , which are equivalent to counties. For this ranking, the municipios are counted as the incorporated places in Puerto Rico, and the San Juan Municipio is the densest.

In American Samoa, each village is governed by a pulenu'u (the equivalent of a mayor) — as such, each village in American Samoa can be considered to be incorporated for the purposes of the table below. [9] In the Northern Mariana Islands, each municipality (such as Saipan) is governed by a mayor, and so those municipalities can be considered incorporated — the villages in the Northern Mariana Islands are considered Census-Designated Places. [10] In Guam, each village is governed by a mayor, and so those villages can be considered incorporated. [11] For the purposes of the table below, the major towns of the U.S. Virgin Islands (Charlotte Amalie, Frederiksted and Christiansted) are considered to be incorporated. [note 1]

Note: this table contains data from the 2010 U.S. Census — because of this, data is more than 9 years old, and the current population density of each jurisdiction may have changed since then.

Rank
(number of
10,000+
places)
State,
federal district
or territory
10,000+
places
Densest incorporated
place
Density (people
per sq. mile)
Rank
(most dense
place)
1Flag of New Jersey.svg  New Jersey 33 Guttenberg 62,264.21
2Flag of California.svg  California 33 Maywood 21,485.53
3 Flag of New York.svg New York 23 Kaser 31,924.42
4Flag of Pennsylvania.svg  Pennsylvania 13 Millbourne 16,378.47
5Flag of Florida.svg  Florida 7 Sunny Isles Beach 22,098.94
6Flag of Massachusetts.svg  Massachusetts 7 Somerville 19,652.05
7Flag of Illinois.svg  Illinois 7 Berwyn 14,664.49
9Flag of Kentucky.svg  Kentucky 1 Poplar Hills 15,200.06
8Flag of Rhode Island.svg  Rhode Island 2 Central Falls 18,913.78
10Flag of Maryland.svg  Maryland 1 Mount Rainier 13,102.210
11Flag of Texas.svg  Texas 1 Mobile City 9,466.711
12Flag of the District of Columbia.svg  District of Columbia 1 Washington 11,367.012
13Flag of Oregon.svg  Oregon 1 Johnson City 8,292.313
14Flag of Michigan.svg  Michigan 1 Hamtramck 13,604.314
15Flag of Ohio.svg  Ohio 1 Lakewood 9,190.315
16Flag of Missouri.svg  Missouri 0 Velda City 7,288.316
17Flag of Puerto Rico.svg  Puerto Rico 0 San Juan 9,084.417
18Flag of Minnesota.svg  Minnesota 0 Landfall 12,772.718
19 Flag of Washington.svg Washington 0 Seattle 8,791.819
20Flag of Connecticut.svg  Connecticut 0 Bridgeport 9,253.920
21Flag of Wisconsin.svg  Wisconsin 0 Shorewood 8,716.421
22Flag of the United States Virgin Islands.svg  U.S. Virgin Islands 0 Charlotte Amalie 8,552.022
23Flag of Virginia.svg  Virginia 0 Alexandria 10,681.023
24Flag of Colorado.svg  Colorado 0 Glendale 8,121.524
25Flag of American Samoa.svg  American Samoa 0 Faleniu 7,741.225
26Flag of Delaware.svg  Delaware 0 Bellefonte 6,920.926
27 Flag of Georgia (U.S. state).svg Georgia 0 Clarkston 7,997.827
28Flag of Arizona.svg  Arizona 0 Guadalupe 6,652.528
29Flag of Nebraska.svg  Nebraska 0 Omaha 3,658.429
30Flag of Kansas.svg  Kansas 0 Westwood Hills 6,250.030
31Flag of Utah.svg  Utah 0 Kearns 7,929.831
32Flag of Iowa.svg  Iowa 0 University Heights 5,339.132
33Flag of Vermont.svg  Vermont 0 Winooski 5,592.333
34Flag of Louisiana.svg  Louisiana 0 Harahan 4,517.334
35Flag of Idaho.svg  Idaho 0 Moscow 3,681.435
36Flag of Hawaii.svg  Hawaii 0 Honolulu 5,796.836
37Flag of Nevada.svg  Nevada 0 Las Vegas 4,525.937
38Flag of Oklahoma.svg  Oklahoma 0 The Village 3,743.338
39Flag of Indiana.svg  Indiana 0 West Lafayette 3,884.039
40Flag of Montana.svg  Montana 0 Browning 3,688.440
41Flag of Mississippi.svg  Mississippi 0 Sidon 2,508.141
42Flag of North Carolina.svg  North Carolina 0 Carrboro 3,288.842
43Flag of Guam.svg  Guam 0 Mongmong-Toto-Maite 3,749.543
44Flag of North Dakota.svg  North Dakota 0 Fort Yates 2,933.344
45Flag of Alabama.svg  Alabama 0 Homewood 3,197.145
46Flag of West Virginia.svg  West Virginia 0 St. Albans 3,004.446
47Flag of Arkansas.svg  Arkansas 0 Cammack Village 2,749.147
48Flag of New Hampshire.svg  New Hampshire 0 Manchester 3,497.148
49Flag of Wyoming.svg  Wyoming 0 Jackson 3,633.949
50Flag of Maine.svg  Maine 0 Portland 3,175.950
51Flag of New Mexico.svg  New Mexico 0 Anthony 3,220.851
52Flag of South Dakota.svg  South Dakota 0 Sioux Falls 2,434.252
53Flag of South Carolina.svg  South Carolina 0 Tega Cay 2,859.253
54Flag of Tennessee.svg  Tennessee 0 East Ridge 2,676.554
55Flag of Alaska.svg  Alaska 0 Kiana 2,352.655
56Flag of the Northern Mariana Islands.svg  Northern Mariana Islands 0 Saipan [note 2] 1,050.856

Populations

A view of portions of Midtown and Lower Manhattan in New York City, with Brooklyn visible in the background, taken from 30 Rockefeller Plaza's famous observation deck. View of Empire State Building from Rockefeller Center New York City dllu (cropped).jpg
A view of portions of Midtown and Lower Manhattan in New York City, with Brooklyn visible in the background, taken from 30 Rockefeller Plaza's famous observation deck.
Downtown Chicago skyline at dusk. Buildings-1804479 1920.jpg
Downtown Chicago skyline at dusk.
The skyscrapers of Center City, Philadelphia, the downtown part of the city, from the South Street Bridge. Philadelphia skyline from South Street Bridge January 2020 (rotate 2 degrees perspective correction crop 4-1).jpg
The skyscrapers of Center City, Philadelphia, the downtown part of the city, from the South Street Bridge.

New York City, Chicago, and Philadelphia are the only incorporated places in the United States that have a population over 1,000,000 and a population density over 10,000 people per square mile.

Population10,000+ incorporated places
1,000,000+3
100,000 – 999,99914
50,000 – 99,99929
10,000 – 49,99948
1,000 – 9,99926
0 – 9995

Land areas

Land area (mi2)10,000+ incorporated places
100.00+3
10.00 – 99.998
5.00 – 9.9923
2.50 – 4.9920
1.00 – 2.4933
0.00 – 0.9938

Population densities

Population density10,000+ incorporated places
30,000.0+4
20,000.0 – 29,999.910
15,000.0 – 19,999.923
12,000.0 – 14,999.933
11,000.0 – 11,999.929
10,000.0 – 10,999.926

See also

Notes

  1. Townships are a special case because in many states townships do not act as incorporated places, but townships in New Jersey and townships in Pennsylvania are civil townships and do act as self-governing municipalities, and for most purposes are equivalent to other "incorporated" places as defined by the U.S. Census Bureau. Because these municipalities have local governments and are essentially incorporated in the state, townships in these two states are included in the list. Home rule municipalities in Pennsylvania, some of which retain the name "Township", are not civil townships under Pennsylvania law, but are not recognized as a separate category of places by the U.S. Census Bureau. Sometimes the U.S. Census Bureau regards these places as minor civil divisions and not "incorporated", as it also sometimes does to New England towns. However, all places in New England on this list are classified as cities and so do not have this problem, as cities in New England are regarded as "incorporated" by the U.S. Census Bureau.
  2. 1 2 3 4 5 6 This New Jersey municipality is officially a township and is sometimes not regarded as "incorporated" by the U.S. Census Bureau. See the explanation above in the first note for why it is included in this list of incorporated places.
  3. This Pennsylvania municipality, although officially bearing the name "Township", is actually a home rule municipality which is not subject to the Pennsylvania Township Code. However, the U.S. Census Bureau does not recognize home rule municipalities as a separate category of incorporated place; therefore, it is sometimes not regarded as "incorporated" by the U.S. Census Bureau. See the explanation above in the first note for why it is included in this list of incorporated places.
  1. Data for the U.S. territories is from the U.S. Census “American FactFinder”. [12]
  2. The village of China Town, Northern Mariana Islands has a population density of 10,901.7 people per square mile, but this village is a Census-Designated place, and so it is not considered incorporated.

Related Research Articles

A census-designated place (CDP) is a concentration of population defined by the United States Census Bureau for statistical purposes only.

In 45 of the 50 states of the United States, the county is used for the level of local government immediately below the state itself. Louisiana uses parishes, and Alaska uses boroughs. In Connecticut, Massachusetts, and Rhode Island, some or all counties within states have no governments of their own; the counties continue to exist as legal entities, however, and are used by states for some administrative functions and by the United States Census bureau for statistical analysis. There are 3,242 counties and county equivalent administrative units in total, including the District of Columbia and 100 county-equivalents in the U.S. territories.

<span class="mw-page-title-main">Canas, Ponce, Puerto Rico</span> Barrio of Puerto Rico

Canas is one of the 31 barrios in the municipality of Ponce, Puerto Rico. Along with Anón, Coto Laurel, Guaraguao, Quebrada Limón, Real, San Patricio, and Marueño, and the coastal barrio of Capitanejo, Canas is one of the municipality's nine bordering barrios. It borders the municipality of Peñuelas. Along with Playa, Bucana, Vayas and Capitanejo, Canas is also one of Ponce's five coastal barrios. It was founded in 1831.

<span class="mw-page-title-main">Magueyes, Ponce, Puerto Rico</span> Barrio of Puerto Rico

Magueyes is one of the 31 barrios of the municipality of Ponce, Puerto Rico. Together with Cerrillos, Machuelo Arriba, Maragüez, Montes Llanos, Portugués, Sabanetas, and Tibes, Magueyes is one of the municipality's eight interior barrios. The name of this barrio is of native Indian origin. It was created in 1831.

<span class="mw-page-title-main">Coto Laurel</span> Barrio of Ponce, Puerto Rico

Coto Laurel is one of the 31 barrios of the municipality of Ponce, Puerto Rico. Along with Anón, Marueño, Guaraguao, Quebrada Limon, Real, and San Patricio, and the coastal barrios of Canas and Capitanejo, Coto Laurel is one of the municipality's nine bordering barrios. It borders the municipality of Juana Diaz. It was founded in 1831.

<span class="mw-page-title-main">Montes Llanos</span> Barrio of Ponce, Puerto Rico

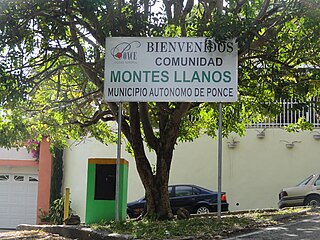
Montes Llanos, is one of the 31 barrios in the municipality of Ponce, Puerto Rico. Along with Magueyes, Tibes, Portugués, Maragüez, Machuelo Arriba, and Cerrillos, Montes Llanos is one of the municipality's seven rural interior barrios. It was created in 1898.

<span class="mw-page-title-main">Capitanejo, Ponce, Puerto Rico</span> Barrio of Puerto Rico

Capitanejo is one of the 31 barrios of the municipality of Ponce, Puerto Rico. Along with Anón, Coto Laurel, Guaraguao, Quebrada Limón, Real, San Patricio, and Marueño, and the coastal barrio of Canas, Capitanejo is one of the municipality's nine bordering barrios. It borders the municipality of Juana Diaz. Along with Playa, Bucana, Vayas and Canas, Capitanejo is also one of Ponce's five coastal barrios. Together with Vayas, Capitanejo is also one of two rural coastal barrios in the municipality. It was founded in 1822.

<span class="mw-page-title-main">Quebrada Limón</span> Barrio of Ponce, Puerto Rico

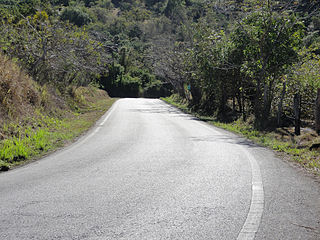
Quebrada Limón is one of the 31 barrios of the municipality of Ponce, Puerto Rico. Along with Anón, Coto Laurel, Guaraguao, Marueño, Real, and San Patricio, and the coastal barrios of Canas and Capitanejo, Quebrada Limón is one of the municipality's nine bordering barrios. It borders the municipality of Peñuelas. It was founded in 1878.

<span class="mw-page-title-main">Sabanetas, Ponce, Puerto Rico</span> Barrio of Puerto Rico

Sabanetas is one of the 31 barrios of the municipality of Ponce, Puerto Rico. Along with Magueyes, Tibes, Portugués, Montes Llanos, Machuelo Arriba, Maragüez, and Cerrillos, Sabanetas is one of the municipality's eight rural interior barrios. The name of this barrio is of native Indian origin. It was founded in 1831.

<span class="mw-page-title-main">Cerrillos, Ponce, Puerto Rico</span> Barrio of Puerto Rico

Cerrillos is one of the 31 barrios of the municipality of Ponce, Puerto Rico. Along with Magueyes, Tibes, Portugués, Montes Llanos, Maragüez, and Machuelo Arriba, Cerrillos is one of the municipality's seven interior rural barrios. It was founded in 1878.

<span class="mw-page-title-main">Machuelo Abajo</span> Barrio of Ponce, Puerto Rico

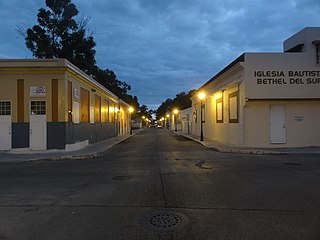
Machuelo Abajo is one of the 31 barrios of the municipality of Ponce, Puerto Rico. Along with Canas Urbano, Magueyes Urbano, Portugués Urbano, and San Antón, Machuelo Abajo is one of the municipality's five originally rural barrios that are now also part of the urban zone of the city of Ponce. It was founded in 1818.

<span class="mw-page-title-main">Primero, Ponce, Puerto Rico</span> Barrio of Puerto Rico

Primero is one of the 31 barrios of the municipality of Ponce, Puerto Rico. Together with Segundo, Tercero, Cuarto, Quinto, and Sexto, Primero is one of the municipality's original six core urban barrios. It was founded in 1878.

<span class="mw-page-title-main">Tercero, Ponce, Puerto Rico</span> Barrio of Puerto Rico

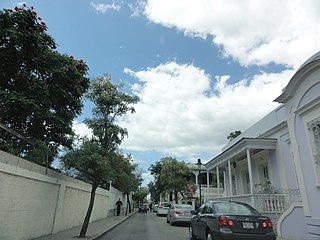
Tercero is one of the 31 barrios of the municipality of Ponce, Puerto Rico. Together with Primero, Segundo, Cuarto, Quinto, and Sexto, Tercero is one of the municipality's six core urban barrios. It was organized in 1878.

<span class="mw-page-title-main">Cuarto, Ponce, Puerto Rico</span> Barrio of Puerto Rico

Cuarto is one of the 31 barrios of the municipality of Ponce, Puerto Rico. Together with Primero, Segundo, Tercero, Quinto, and Sexto, Cuarto is one of the municipality's six core urban barrios. It was created in 1878.

<span class="mw-page-title-main">Segundo, Ponce, Puerto Rico</span> Barrio of Puerto Rico

Segundo is one of the 31 barrios of the municipality of Ponce, Puerto Rico. Along with Primero, Tercero, Cuarto, Quinto, and Sexto, Segundo is one of the municipality's six core urban barrios. It was organized in 1878. Barrio Segundo has 3 subbarrios: Baldority de Castro, Clausells, and Reparada.

<span class="mw-page-title-main">Quinto, Ponce, Puerto Rico</span> Barrio of Puerto Rico

Quinto is one of the 31 barrios of the municipality of Ponce, Puerto Rico. Together with Primero, Segundo, Tercero, Cuarto, and Sexto, Quinto is one of the municipality's six original urban barrios. It was organized in 1878.

The United States federal government defines and delineates the nation's metropolitan areas for statistical purposes, using a set of standard statistical area definitions. As of 2020, the U.S. Office of Management and Budget (OMB) defined and delineated 392 metropolitan statistical areas (MSAs) and 547 micropolitan statistical areas (μSAs) in the United States and Puerto Rico. Many of these 939 MSAs and μSAs are, in turn, components of larger combined statistical areas (CSAs) consisting of adjacent MSAs and μSAs that are linked by commuting ties; as of 2020, 551 metropolitan and micropolitan areas are components of the 175 defined CSAs. A collective term for MSAs, μSAs, and CSAs is primary statistical areas (PSAs), though that term is not used by OMB.

References

  1. "United States by Places and (in selected states) County Subdivisions with 50,000 or More Population; and for Puerto Rico (geographies ranked alphabetically by state)". United States Census Bureau . Retrieved May 22, 2009.
  2. "United States by Places and (in selected states) County Subdivisions with 50,000 or More Population; and for Puerto Rico (geographies ranked by total population)". United States Census Bureau .
  3. "Census 2000 U.S. Gazetteer Files". United States Census Bureau, Geography Division. January 10, 2002. Archived from the original on August 2, 2002. Retrieved June 3, 2009.
  4. "New York by Place and County Subdivision". American FactFinder. United States Census Bureau, Census 2000 Summary File 1. Retrieved May 22, 2009.
  5. "Puerto Rico by Place". American FactFinder. United States Census Bureau, Census 2000 Summary File 1. Retrieved May 22, 2009.
  6. "Puerto Rico by Municipio". American FactFinder. United States Census Bureau, Census 2000 Summary File 1. Retrieved May 27, 2009.
  7. https://factfinder.census.gov/faces/tableservices/jsf/pages/productview.xhtml?pid=DEC_10_MPSF_P36&prodType=table American FactFinder. Population Density — 2010 Commonwealth of the Northern Mariana Islands Summary File. Retrieved June 2019.
  8. "Incorporated Places of 100,000 or More, Ranked by Population: 2000" (ASCII). United States Census Bureau, Census 2000 Redistricting Data (P.L. 94-171) Summary File and 1990 Census. April 2, 2001. Retrieved June 4, 2009.
  9. https://www.nps.gov/mpsa/learn/historyculture/people.htm National Park of American Samoa — History & Culture: People. NPS.gov. Retrieved June 2019.
  10. https://www.saipantribune.com/index.php/cnmi-mayors-municipal-council-members-join-amim/ Saipan Tribune. CNMI mayors, municipal council members join AMIM. Retrieved June 2019.
  11. https://www.mcog.guam.gov/directory Mayor’s Council of Guam. Guam’s Mayors and Vice Mayors. Mcog.guam.gov. Retrieved June 2019.
  12. https://factfinder.census.gov/faces/tableservices/jsf/pages/productview.xhtml?pid=DEC_10_ASSF_P36&prodType=table Population Density. 2010 [territory] Summary File. Retrieved June 2019.