Phase diagram

Last updated

Simplified temperature/pressure phase change diagram for water. The pressure on a pressure-temperature diagram (such as the water phase diagram shown above) is the partial pressure of the substance in question. Phase diagram of water simplified.svg
Simplified temperature/pressure phase change diagram for water. The pressure on a pressure-temperature diagram (such as the water phase diagram shown above) is the partial pressure of the substance in question.

A phase diagram in physical chemistry, engineering, mineralogy, and materials science is a type of chart used to show conditions (pressure, temperature, volume, etc.) at which thermodynamically distinct phases (such as solid, liquid or gaseous states) occur and coexist at equilibrium.

Contents

Overview

Common components of a phase diagram are lines of equilibrium or phase boundaries, which refer to lines that mark conditions under which multiple phases can coexist at equilibrium. Phase transitions occur along lines of equilibrium. Metastable phases are not shown in phase diagrams as, despite their common occurrence, they are not equilibrium phases.

Triple points are points on phase diagrams where lines of equilibrium intersect. Triple points mark conditions at which three different phases can coexist. For example, the water phase diagram has a triple point corresponding to the single temperature and pressure at which solid, liquid, and gaseous water can coexist in a stable equilibrium (273.16  K and a partial vapor pressure of 611.657  Pa ). The pressure on a pressure-temperature diagram (such as the water phase diagram shown) is the partial pressure of the substance in question. [1]

The solidus is the temperature below which the substance is stable in the solid state. The liquidus is the temperature above which the substance is stable in a liquid state. There may be a gap between the solidus and liquidus; within the gap, the substance consists of a mixture of crystals and liquid (like a "slurry"). [2]

Working fluids are often categorized on the basis of the shape of their phase diagram.

Types

2-dimensional diagrams

Pressure vs temperature

A typical phase diagram. The solid green line shows the behaviour of the melting point for most substances; the dotted green line shows the anomalous behavior of water. The red lines show the sublimation temperature and the blue line the boiling point, showing how they vary with pressure. Phase-diag2.svg
A typical phase diagram. The solid green line shows the behaviour of the melting point for most substances; the dotted green line shows the anomalous behavior of water. The red lines show the sublimation temperature and the blue line the boiling point, showing how they vary with pressure.

The simplest phase diagrams are pressure–temperature diagrams of a single simple substance, such as water. The axes correspond to the pressure and temperature. The phase diagram shows, in pressure–temperature space, the lines of equilibrium or phase boundaries between the three phases of solid, liquid, and gas.

The curves on the phase diagram show the points where the free energy (and other derived properties) becomes non-analytic: their derivatives with respect to the coordinates (temperature and pressure in this example) change discontinuously (abruptly). For example, the heat capacity of a container filled with ice will change abruptly as the container is heated past the melting point. The open spaces, where the free energy is analytic, correspond to single phase regions. Single phase regions are separated by lines of non-analytical behavior, where phase transitions occur, which are called phase boundaries.

In the diagram on the right, the phase boundary between liquid and gas does not continue indefinitely. Instead, it terminates at a point on the phase diagram called the critical point. This reflects the fact that, at extremely high temperatures and pressures, the liquid and gaseous phases become indistinguishable, [3] in what is known as a supercritical fluid. In water, the critical point occurs at around Tc = 647.096 K (373.946 °C), pc = 22.064 MPa (217.75 atm) and ρc = 356 kg/m3. [4]

The existence of the liquid–gas critical point reveals a slight ambiguity in labelling the single phase regions. When going from the liquid to the gaseous phase, one usually crosses the phase boundary, but it is possible to choose a path that never crosses the boundary by going to the right of the critical point. Thus, the liquid and gaseous phases can blend continuously into each other. The solid–liquid phase boundary can only end in a critical point if the solid and liquid phases have the same symmetry group. [5]

For most substances, the solid–liquid phase boundary (or fusion curve) in the phase diagram has a positive slope so that the melting point increases with pressure. This is true whenever the solid phase is denser than the liquid phase. [6] The greater the pressure on a given substance, the closer together the molecules of the substance are brought to each other, which increases the effect of the substance's intermolecular forces. Thus, the substance requires a higher temperature for its molecules to have enough energy to break out of the fixed pattern of the solid phase and enter the liquid phase. A similar concept applies to liquid–gas phase changes. [7]

Water is an exception which has a solid-liquid boundary with negative slope so that the melting point decreases with pressure. This occurs because ice (solid water) is less dense than liquid water, as shown by the fact that ice floats on water. At a molecular level, ice is less dense because it has a more extensive network of hydrogen bonding which requires a greater separation of water molecules. [6] Other exceptions include antimony and bismuth. [8] [9]

At very high pressures above 50 GPa (500 000 atm), liquid nitrogen undergoes a liquid-liquid phase transition to a polymeric form and becomes denser than solid nitrogen at the same pressure. Under these conditions therefore, solid nitrogen also floats in its liquid. [10]

The value of the slope dP/dT is given by the Clausius–Clapeyron equation for fusion (melting) [11]

where ΔHfus is the heat of fusion which is always positive, and ΔVfus is the volume change for fusion. For most substances ΔVfus is positive so that the slope is positive. However for water and other exceptions, ΔVfus is negative so that the slope is negative.

Other thermodynamic properties

In addition to temperature and pressure, other thermodynamic properties may be graphed in phase diagrams. Examples of such thermodynamic properties include specific volume, specific enthalpy, or specific entropy. For example, single-component graphs of temperature vs. specific entropy (T vs. s) for water/steam or for a refrigerant are commonly used to illustrate thermodynamic cycles such as a Carnot cycle, Rankine cycle, or vapor-compression refrigeration cycle.

Any two thermodynamic quantities may be shown on the horizontal and vertical axes of a two-dimensional diagram. Additional thermodynamic quantities may each be illustrated in increments as a series of lines – curved, straight, or a combination of curved and straight. Each of these iso-lines represents the thermodynamic quantity at a certain constant value.

3-dimensional diagrams

p-v-T 3D diagram for fixed amount of pure material PVT 3D diagram-en.svg
pvT 3D diagram for fixed amount of pure material

It is possible to envision three-dimensional (3D) graphs showing three thermodynamic quantities. [12] [13] For example, for a single component, a 3D Cartesian coordinate type graph can show temperature (T) on one axis, pressure (p) on a second axis, and specific volume (v) on a third. Such a 3D graph is sometimes called a pvT diagram. The equilibrium conditions are shown as curves on a curved surface in 3D with areas for solid, liquid, and vapor phases and areas where solid and liquid, solid and vapor, or liquid and vapor coexist in equilibrium. A line on the surface called a triple line is where solid, liquid and vapor can all coexist in equilibrium. The critical point remains a point on the surface even on a 3D phase diagram.

An orthographic projection of the 3D pvT graph showing pressure and temperature as the vertical and horizontal axes collapses the 3D plot into the standard 2D pressure–temperature diagram. When this is done, the solid–vapor, solid–liquid, and liquid–vapor surfaces collapse into three corresponding curved lines meeting at the triple point, which is the collapsed orthographic projection of the triple line.

Binary mixtures

A phase diagram for a binary system displaying a eutectic point. Eutektikum new.svg
A phase diagram for a binary system displaying a eutectic point.

Other much more complex types of phase diagrams can be constructed, particularly when more than one pure component is present. In that case, concentration becomes an important variable. Phase diagrams with more than two dimensions can be constructed that show the effect of more than two variables on the phase of a substance. Phase diagrams can use other variables in addition to or in place of temperature, pressure and composition, for example the strength of an applied electrical or magnetic field, and they can also involve substances that take on more than just three states of matter. One type of phase diagram plots temperature against the relative concentrations of two substances in a binary mixture called a binary phase diagram, as shown at right. Such a mixture can be either a solid solution, eutectic or peritectic, among others. These two types of mixtures result in very different graphs. Another type of binary phase diagram is a boiling-point diagram for a mixture of two components, i. e. chemical compounds. For two particular volatile components at a certain pressure such as atmospheric pressure, a boiling-point diagram shows what vapor (gas) compositions are in equilibrium with given liquid compositions depending on temperature. In a typical binary boiling-point diagram, temperature is plotted on a vertical axis and mixture composition on a horizontal axis.

Boiling-point diagram Binary Boiling Point Diagram new.svg
Boiling-point diagram

A two component diagram with components A and B in an "ideal" solution is shown. The construction of a liquid vapor phase diagram assumes an ideal liquid solution obeying Raoult's law and an ideal gas mixture obeying Dalton's law of partial pressure. A tie line from the liquid to the gas at constant pressure would indicate the two compositions of the liquid and gas respectively. [14]

A simple example diagram with hypothetical components 1 and 2 in a non-azeotropic mixture is shown at right. The fact that there are two separate curved lines joining the boiling points of the pure components means that the vapor composition is usually not the same as the liquid composition the vapor is in equilibrium with. See Vapor–liquid equilibrium for more information.

In addition to the above-mentioned types of phase diagrams, there are many other possible combinations. Some of the major features of phase diagrams include congruent points, where a solid phase transforms directly into a liquid. There is also the peritectoid, a point where two solid phases combine into one solid phase during cooling. The inverse of this, when one solid phase transforms into two solid phases during cooling, is called the eutectoid.

A complex phase diagram of great technological importance is that of the ironcarbon system for less than 7% carbon (see steel).

The x-axis of such a diagram represents the concentration variable of the mixture. As the mixtures are typically far from dilute and their density as a function of temperature is usually unknown, the preferred concentration measure is mole fraction. A volume-based measure like molarity would be inadvisable.

Ternary phase diagrams

A system with three components is called a ternary system. At constant pressure the maximum number of independent variables is three – the temperature and two concentration values. For a representation of ternary equilibria a three-dimensional phase diagram is required. Often such a diagram is drawn with the composition as a horizontal plane and the temperature on an axis perpendicular to this plane. To represent composition in a ternary system an equilateral triangle is used, called Gibbs triangle (see also Ternary plot).

The temperature scale is plotted on the axis perpendicular to the composition triangle. Thus, the space model of a ternary phase diagram is a right-triangular prism. The prism sides represent corresponding binary systems A-B, B-C, A-C.

However, the most common methods to present phase equilibria in a ternary system are the following: 1) projections on the concentration triangle ABC of the liquidus, solidus, solvus surfaces; 2) isothermal sections; 3) vertical sections. [15]

Crystals

Polymorphic and polyamorphic substances have multiple crystal or amorphous phases, which can be graphed in a similar fashion to solid, liquid, and gas phases.

Log-lin pressure-temperature phase diagram of water. The Roman numerals indicate various ice phases. Phase diagram of water.svg
Log-lin pressure–temperature phase diagram of water. The Roman numerals indicate various ice phases.

Mesophases

Some organic materials pass through intermediate states between solid and liquid; these states are called mesophases. Attention has been directed to mesophases because they enable display devices and have become commercially important through the so-called liquid-crystal technology. Phase diagrams are used to describe the occurrence of mesophases. [17]

See also

Related Research Articles

<span class="mw-page-title-main">Boiling point</span> Temperature at which a substance changes from liquid into vapor

The boiling point of a substance is the temperature at which the vapor pressure of a liquid equals the pressure surrounding the liquid and the liquid changes into a vapor.

<span class="mw-page-title-main">Phase (matter)</span> Region of uniform physical properties

In the physical sciences, a phase is a region of material that is chemically uniform, physically distinct, and (often) mechanically separable. In a system consisting of ice and water in a glass jar, the ice cubes are one phase, the water is a second phase, and the humid air is a third phase over the ice and water. The glass of the jar is another separate phase.

<span class="mw-page-title-main">Solution (chemistry)</span> Homogeneous mixture of a solute and a solvent

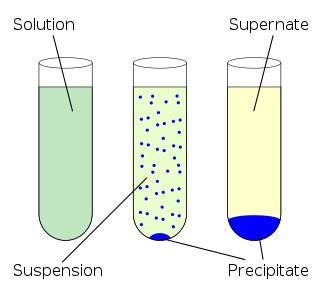
In chemistry, a solution is a special type of homogeneous mixture composed of two or more substances. In such a mixture, a solute is a substance dissolved in another substance, known as a solvent. If the attractive forces between the solvent and solute particles are greater than the attractive forces holding the solute particles together, the solvent particles pull the solute particles apart and surround them. These surrounded solute particles then move away from the solid solute and out into the solution. The mixing process of a solution happens at a scale where the effects of chemical polarity are involved, resulting in interactions that are specific to solvation. The solution usually has the state of the solvent when the solvent is the larger fraction of the mixture, as is commonly the case. One important parameter of a solution is the concentration, which is a measure of the amount of solute in a given amount of solution or solvent. The term "aqueous solution" is used when one of the solvents is water.

<span class="mw-page-title-main">Triple point</span> Thermodynamic point where three matter phases exist

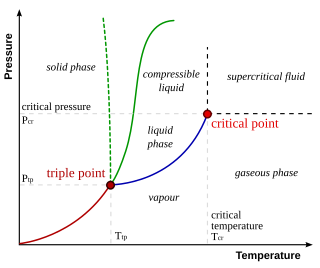
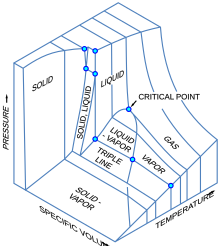
In thermodynamics, the triple point of a substance is the temperature and pressure at which the three phases of that substance coexist in thermodynamic equilibrium. It is that temperature and pressure at which the sublimation, fusion, and vaporisation curves meet. For example, the triple point of mercury occurs at a temperature of −38.8 °C (−37.8 °F) and a pressure of 0.165 mPa.

<span class="mw-page-title-main">Vapor</span> Substances in the gas phase at a temperature lower than its critical point

In physics, a vapor or vapour is a substance in the gas phase at a temperature lower than its critical temperature, which means that the vapor can be condensed to a liquid by increasing the pressure on it without reducing the temperature of the vapor. A vapor is different from an aerosol. An aerosol is a suspension of tiny particles of liquid, solid, or both within a gas.

<span class="mw-page-title-main">Vapor pressure</span> Pressure exerted by a vapor in thermodynamic equilibrium

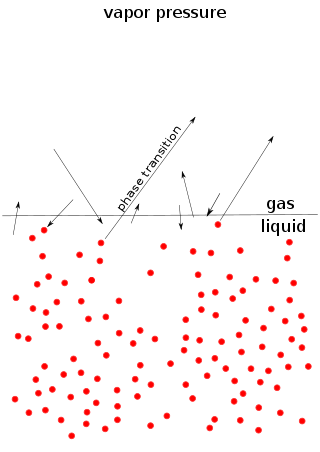
Vapor pressure or equilibrium vapor pressure is the pressure exerted by a vapor in thermodynamic equilibrium with its condensed phases at a given temperature in a closed system. The equilibrium vapor pressure is an indication of a liquid's thermodynamic tendency to evaporate. It relates to the balance of particles escaping from the liquid in equilibrium with those in a coexisting vapor phase. A substance with a high vapor pressure at normal temperatures is often referred to as volatile. The pressure exhibited by vapor present above a liquid surface is known as vapor pressure. As the temperature of a liquid increases, the attractive interactions between liquid molecules become less significant in comparison to the entropy of those molecules in the gas phase, increasing the vapor pressure. Thus, liquids with strong intermolecular interactions are likely to have smaller vapor pressures, with the reverse true for weaker interactions.

<span class="mw-page-title-main">Partial pressure</span> Pressure of a component gas in a mixture

In a mixture of gases, each constituent gas has a partial pressure which is the notional pressure of that constituent gas as if it alone occupied the entire volume of the original mixture at the same temperature. The total pressure of an ideal gas mixture is the sum of the partial pressures of the gases in the mixture.

<span class="mw-page-title-main">Azeotrope</span> Mixture of two or more liquids whose proportions do not change when the mixture is distilled

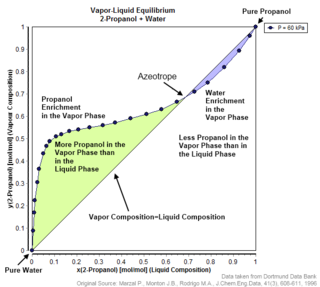
An azeotrope or a constant heating point mixture is a mixture of two or more components in fluidic states whose proportions cannot be altered or changed by simple distillation. This happens because when an azeotrope is boiled, the vapour has the same proportions of constituents as the unboiled mixture. Azeotropic mixture behavior is important for fluid separation processes.

<span class="mw-page-title-main">Solubility</span> Capacity of a substance to dissolve in a solvent in a homogeneous way

In chemistry, solubility is the ability of a substance, the solute, to form a solution with another substance, the solvent. Insolubility is the opposite property, the inability of the solute to form such a solution.

<span class="mw-page-title-main">Eutectic system</span> Mixture with a lower melting point than its constituents

A eutectic system or eutectic mixture is a homogeneous mixture that has a melting point lower than those of the constituents. The lowest possible melting point over all of the mixing ratios of the constituents is called the eutectic temperature. On a phase diagram, the eutectic temperature is seen as the eutectic point.

In thermodynamics, the phase rule is a general principle governing "pVT" systems, whose thermodynamic states are completely described by the variables pressure, volume and temperature, in thermodynamic equilibrium. If F is the number of degrees of freedom, C is the number of components and P is the number of phases, then

<span class="mw-page-title-main">Psychrometrics</span> Study of gas-vapor mixtures

Psychrometrics is the field of engineering concerned with the physical and thermodynamic properties of gas-vapor mixtures.

<span class="mw-page-title-main">Critical point (thermodynamics)</span> Temperature and pressure point where phase boundaries disappear

In thermodynamics, a critical point is the end point of a phase equilibrium curve. One example is the liquid–vapor critical point, the end point of the pressure–temperature curve that designates conditions under which a liquid and its vapor can coexist. At higher temperatures, the gas cannot be liquefied by pressure alone. At the critical point, defined by a critical temperatureTc and a critical pressurepc, phase boundaries vanish. Other examples include the liquid–liquid critical points in mixtures, and the ferromagnet–paramagnet transition in the absence of an external magnetic field.

The McCabe–Thiele method is a technique that is commonly employed in the field of chemical engineering to model the separation of two substances by a distillation column. It uses the fact that the composition at each theoretical tray is completely determined by the mole fraction of one of the two components. This method is based on the assumptions that the distillation column is isobaric—i.e the pressure remains constant—and that the flow rates of liquid and vapor do not change throughout the column. The assumption of constant molar overflow requires that:

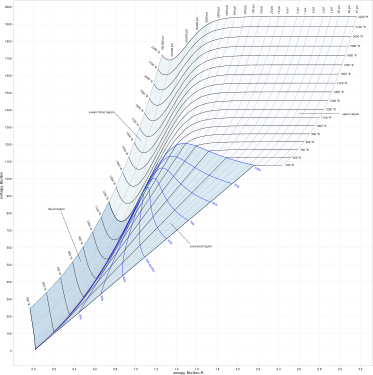
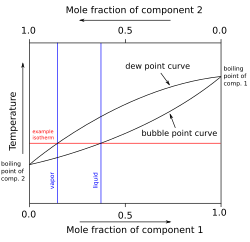
In thermodynamics and chemical engineering, the vapor–liquid equilibrium (VLE) describes the distribution of a chemical species between the vapor phase and a liquid phase.

The Dortmund Data Bank is a factual data bank for thermodynamic and thermophysical data. Its main usage is the data supply for process simulation where experimental data are the basis for the design, analysis, synthesis, and optimization of chemical processes. The DDB is used for fitting parameters for thermodynamic models like NRTL or UNIQUAC and for many different equations describing pure component properties, e.g., the Antoine equation for vapor pressures. The DDB is also used for the development and revision of predictive methods like UNIFAC and PSRK.

<span class="mw-page-title-main">Spinodal</span>

In thermodynamics, the limit of local stability with respect to small fluctuations is clearly defined by the condition that the second derivative of Gibbs free energy is zero.

<span class="mw-page-title-main">Residue curve</span>

A residue curve describes the change in the composition of the liquid phase of a chemical mixture during continuous evaporation at the condition of vapor–liquid equilibrium. Multiple residue curves for a single system are called residue curves map.

In thermodynamics, explosive boiling or phase explosion is a method whereby a superheated metastable liquid undergoes an explosive liquid-vapor phase transition into a stable two-phase state because of a massive homogeneous nucleation of vapor bubbles. This concept was pioneered by M. M. Martynyuk in 1976 and then later advanced by Fucke and Seydel.

While chemically pure materials have a single melting point, chemical mixtures often partially melt at the solidus temperature (TS or Tsol), and fully melt at the higher liquidus temperature (TL or Tliq). The solidus is always less than or equal to the liquidus, but they need not coincide. If a gap exists between the solidus and liquidus it is called the freezing range, and within that gap, the substance consists of a mixture of solid and liquid phases (like a slurry). Such is the case, for example, with the olivine (forsterite-fayalite) system, which is common in Earth's mantle.

References

  1. "Phase Diagrams". ch302.cm.utexas.edu. Retrieved 14 July 2023.
  2. Predel, Bruno; Hoch, Michael J. R.; Pool, Monte (2004). Phase Diagrams and Heterogeneous Equilibria: A Practical Introduction. Springer. ISBN   978-3-540-14011-5.
  3. Papon, P.; Leblond, J.; Meijer, P. H. E. (2002). The Physics of Phase Transition : Concepts and Applications. Berlin: Springer. ISBN   978-3-540-43236-4.
  4. The International Association for the Properties of Water and Steam "Guideline on the Use of Fundamental Physical Constants and Basic Constants of Water", 2001, p. 5
  5. Landau, Lev D.; Lifshitz, Evgeny M. (1980). Statistical Physics. Vol. 5 (3rd ed.). Butterworth-Heinemann. ISBN   978-0-7506-3372-7.
  6. 1 2 Whitten, Kenneth W.; Galley, Kenneth D.; Davis, Raymond E. (1992). General Chemistry (4th ed.). Saunders College Publishing. p.  477. ISBN   9780030751561.
  7. Dorin, Henry; Demmin, Peter E.; Gabel, Dorothy L. (1992). Chemistry : The Study of Matter Prentice (Fourth ed.). Prentice Hall. pp.  266–273. ISBN   978-0-13-127333-7.
  8. Averill, Bruce A.; Eldredge, Patricia (2012). "11.7 Phase Diagrams". Principles of General Chemistry. Creative Commons.
  9. Petrucci, Ralph H.; Harwood, William S.; Herring, F. Geoffrey (2002). General Chemistry. Principles and Modern Applications (8th ed.). Prentice Hall. p. 495. ISBN   0-13-014329-4.
  10. Mukherjee, Goutam Dev; Boehler, Reinhard (30 November 2007). "High-Pressure Melting Curve of Nitrogen and the Liquid-Liquid Phase Transition". Physical Review Letters. 99 (22): 225701. Bibcode:2007PhRvL..99v5701M. doi:10.1103/PhysRevLett.99.225701. PMID   18233298.
  11. Laidler, Keith J.; Meiser, John H. (1982). Physical Chemistry. Benjamin/Cummings. pp. 173–74.
  12. Zemansky, Mark W.; Dittman, Richard H. (1981). Heat and Thermodynamics (6th ed.). McGraw-Hill. Figs. 2-3, 2-4, 2-5, 10-10, P10-1. ISBN   978-0-07-072808-0.
  13. Web applet: 3D Phase Diagrams for Water, Carbon Dioxide and Ammonia. Described in Glasser, Leslie; Herráez, Angel; Hanson, Robert M. (2009). "Interactive 3D Phase Diagrams Using Jmol". Journal of Chemical Education . 86 (5): 566. Bibcode:2009JChEd..86..566G. doi: 10.1021/ed086p566 . hdl: 20.500.11937/11329 .
  14. David, Carl W. (2022). "The phase diagram of a non-ideal mixture's p − v − x 2-component gas=liquid representation, including azeotropes". Chemistry Education Materials. University of Connecticut. Retrieved 9 April 2022.
  15. Alan Prince, "Alloy Phase Equilibria", Elsevier, 290 pp (1966) ISBN 978-0444404626
  16. A similar diagram may be found on the site Water structure and science. Water structure and science Site by Martin Chaplin, accessed 2 July 2015.
  17. Chandrasekhar, Sivaramakrishna (1992). Liquid Crystals (2nd ed.). Cambridge University Press. pp. 27–29, 356. ISBN   978-0-521-41747-1.