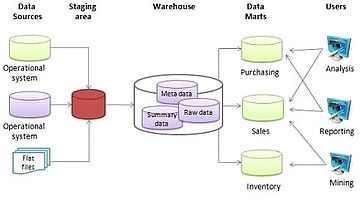
In computing, a data warehouse, also known as an enterprise data warehouse (EDW), is a system used for reporting and data analysis and is considered a core component of business intelligence. Data warehouses are central repositories of integrated data from one or more disparate sources. They store current and historical data in one single place that are used for creating analytical reports for workers throughout the enterprise. This is beneficial for companies as it enables them to interrogate and draw insights from their data and make decisions.
Online analytical processing, or OLAP, is an approach to answer multi-dimensional analytical (MDA) queries swiftly in computing. OLAP is part of the broader category of business intelligence, which also encompasses relational databases, report writing and data mining. Typical applications of OLAP include business reporting for sales, marketing, management reporting, business process management (BPM), budgeting and forecasting, financial reporting and similar areas, with new applications emerging, such as agriculture.

In computing, extract, transform, load (ETL) is a three-phase process where data is extracted, transformed and loaded into an output data container. The data can be collated from one or more sources and it can also be output to one or more destinations. ETL processing is typically executed using software applications but it can also be done manually by system operators. ETL software typically automates the entire process and can be run manually or on reoccurring schedules either as single jobs or aggregated into a batch of jobs.

A data mart is a structure/access pattern specific to data warehouse environments, used to retrieve client-facing data. The data mart is a subset of the data warehouse and is usually oriented to a specific business line or team. Whereas data warehouses have an enterprise-wide depth, the information in data marts pertains to a single department. In some deployments, each department or business unit is considered the owner of its data mart including all the hardware, software and data. This enables each department to isolate the use, manipulation and development of their data. In other deployments where conformed dimensions are used, this business unit owner will not hold true for shared dimensions like customer, product, etc.

An OLAP cube is a multi-dimensional array of data. Online analytical processing (OLAP) is a computer-based technique of analyzing data to look for insights. The term cube here refers to a multi-dimensional dataset, which is also sometimes called a hypercube if the number of dimensions is greater than three.
Data profiling is the process of examining the data available from an existing information source and collecting statistics or informative summaries about that data. The purpose of these statistics may be to:
- Find out whether existing data can be easily used for other purposes
- Improve the ability to search data by tagging it with keywords, descriptions, or assigning it to a category
- Assess data quality, including whether the data conforms to particular standards or patterns
- Assess the risk involved in integrating data in new applications, including the challenges of joins
- Discover metadata of the source database, including value patterns and distributions, key candidates, foreign-key candidates, and functional dependencies
- Assess whether known metadata accurately describes the actual values in the source database
- Understanding data challenges early in any data intensive project, so that late project surprises are avoided. Finding data problems late in the project can lead to delays and cost overruns.
- Have an enterprise view of all data, for uses such as master data management, where key data is needed, or data governance for improving data quality.

In computing, the star schema is the simplest style of data mart schema and is the approach most widely used to develop data warehouses and dimensional data marts. The star schema consists of one or more fact tables referencing any number of dimension tables. The star schema is an important special case of the snowflake schema, and is more effective for handling simpler queries.
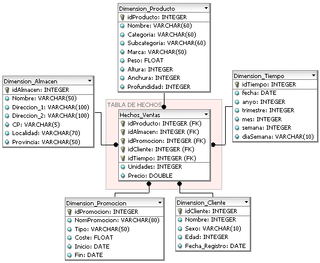
In data warehousing, a fact table consists of the measurements, metrics or facts of a business process. It is located at the center of a star schema or a snowflake schema surrounded by dimension tables. Where multiple fact tables are used, these are arranged as a fact constellation schema. A fact table typically has two types of columns: those that contain facts and those that are a foreign key to dimension tables. The primary key of a fact table is usually a composite key that is made up of all of its foreign keys. Fact tables contain the content of the data warehouse and store different types of measures like additive, non-additive, and semi-additive measures.

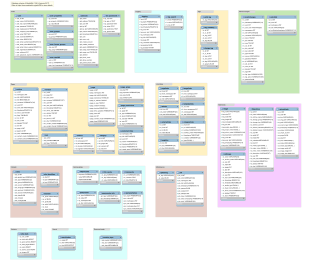
In computing, a snowflake schema is a logical arrangement of tables in a multidimensional database such that the entity relationship diagram resembles a snowflake shape. The snowflake schema is represented by centralized fact tables which are connected to multiple dimensions. "Snowflaking" is a method of normalizing the dimension tables in a star schema. When it is completely normalized along all the dimension tables, the resultant structure resembles a snowflake with the fact table in the middle. The principle behind snowflaking is normalization of the dimension tables by removing low cardinality attributes and forming separate tables.
Essbase is a multidimensional database management system (MDBMS) that provides a platform upon which to build analytic applications. Essbase began as a product from Arbor Software, which merged with Hyperion Software in 1998. Oracle Corporation acquired Hyperion Solutions Corporation in 2007. Until late 2005 IBM also marketed an OEM version of Essbase as DB2 OLAP Server.
Microsoft SQL Server Analysis Services (SSAS) is an online analytical processing (OLAP) and data mining tool in Microsoft SQL Server. SSAS is used as a tool by organizations to analyze and make sense of information possibly spread out across multiple databases, or in disparate tables or files. Microsoft has included a number of services in SQL Server related to business intelligence and data warehousing. These services include Integration Services, Reporting Services and Analysis Services. Analysis Services includes a group of OLAP and data mining capabilities and comes in two flavors multidimensional and tabular, where the difference between the two is how the data is presented. In a tabular model, the information is arranged in two-dimensional tables which can thus be more readable for a human. A multidimensional model can contain information with many degrees of freedom, and must be unfolded to increase readability by a human.

A dimension is a structure that categorizes facts and measures in order to enable users to answer business questions. Commonly used dimensions are people, products, place and time.
According to Ralph Kimball, in a data warehouse, a degenerate dimension is a dimension key in the fact table that does not have its own dimension table, because all the interesting attributes have been placed in analytic dimensions. The term "degenerate dimension" was originated by Ralph Kimball.
A slowly changing dimension (SCD) in data management and data warehousing is a dimension which contains relatively static data which can change slowly but unpredictably, rather than according to a regular schedule. Some examples of typical slowly changing dimensions are entities such as names of geographical locations, customers, or products.
Dimensional modeling (DM) is part of the Business Dimensional Lifecycle methodology developed by Ralph Kimball which includes a set of methods, techniques and concepts for use in data warehouse design. The approach focuses on identifying the key business processes within a business and modelling and implementing these first before adding additional business processes, as a bottom-up approach. An alternative approach from Inmon advocates a top down design of the model of all the enterprise data using tools such as entity-relationship modeling (ER).
A database model is a type of data model that determines the logical structure of a database. It fundamentally determines in which manner data can be stored, organized and manipulated. The most popular example of a database model is the relational model, which uses a table-based format.
The dimensional fact model (DFM) is an ad hoc and graphical formalism specifically devised to support the conceptual modeling phase in a data warehouse project. DFM is extremely intuitive and can be used by analysts and non-technical users as well. A short-term working is sufficient to realize a clear and exhaustive representation of multidimensional concepts. It can be used from the initial data warehouse life-cycle steps, to rapidly devise a conceptual model to share with customers.
The enterprise bus matrix is a data warehouse planning tool and model created by Ralph Kimball, and is part of the data warehouse bus architecture. The matrix is the logical definition of one of the core concepts of Kimball’s approach to dimensional modeling conformed dimension.
The following is provided as an overview of and topical guide to databases:
Cubes is a light-weight open source multidimensional modelling and OLAP toolkit for development reporting applications and browsing of aggregated data written in Python programming language released under the MIT License.