Body size and species richness

Last updated

The body size-species richness distribution is a pattern observed in the way taxa are distributed over large spatial scales. The number of species that exhibit small body size generally far exceed the number of species that are large-bodied. Macroecology has long sought to understand the mechanisms that underlie the patterns of biodiversity, such as the body size-species richness pattern.

Contents

This pattern was first observed by Hutchinson and MacArthur (1959), [1] and it appears to apply equally well to a broad range of taxa: from birds and mammals to insects, bacteria (May, 1978; [2] Brown and Nicoletto, 1991 [3] ) and deep sea gastropods (McClain, 2004 [4] ). Nonetheless, its ubiquity remains undecided. Most studies focus on the distribution of taxonomic fractions of largely non-interacting species such as birds or mammals; this article is primarily based on those data.

Figure 1. The Frequency distribution of North American land mammals (n=465). The figure shows a right skewed distribution, with a mode tending to smaller species (50-100 g). The x-axis encompasses mammals ranging in size from 3 grams to 393 kilograms. Redrawn from Brown and Nicoletto (1991) North american land mammals graph.png
Figure 1. The Frequency distribution of North American land mammals (n=465). The figure shows a right skewed distribution, with a mode tending to smaller species (50–100 g). The x-axis encompasses mammals ranging in size from 3 grams to 393 kilograms. Redrawn from Brown and Nicoletto (1991)

Introduction

The body size-species richness pattern (see fig. 1) has been documented for land mammals across numerous continents such as North America, South America, Eurasia and Africa (Brown and Maurer, 1989; [5] Bakker and Kelt, 2000; [6] Maurer et al. 1992 [7] ). Traditionally the pattern has been explored by plotting the number of species on the y-axis and the logarithm to the base two of the species body mass (g) on the x-axis. This yields a highly right skewed body size distribution with a mode centered near species with a mass ranging from 50-100 grams. Although this relationship is very distinct at large spatial scales, the pattern breaks down when the sampling area is small (Hutchinson and MacArthur, 1959; [1] Brown and Maurer 1989; [5] Brown and Nicoletto 1991; [3] Bakker and Kelt 2000 [6] ).

Scale dependence of the pattern

At small spatial scales (e.g. a dozen hectares or a local community) the body size-species richness pattern dissolves and the number of species per body size class is almost uniform (i.e. there is an equal number of small and large bodied species in the community (see fig. 2 b)). Researchers have documented this transition by sampling species at different spatial scales; at intermediate spatial scales (e.g. a thousand hectares or a biome) the body size-species richness distribution begins to shift from being right skewed (from fewer large-bodied species) towards a normal distribution. Finally, when macroecologists compare the body size-species richness distributions of continents to those of communities the distributions are significantly different (Hutchinson and MacArthur, 1959; [1] Brown and Maurer, 1989; [5] Brown and Nicoletto, 1991; [3] Bakker and Kelt, 2000 [6] ) (see fig. 1 vs. fig. 2 b)).

Figure 2. a) Chichuahuan biome land mammals.png
Figure 2. a)
Figure 2. b) Bernalillo community graph.png
Figure 2. b)

Figure 2. The Frequency distribution of land mammals at two different spatial scales. The figure shows a shift from a slightly right skewed distribution at the biome scale (a) to a normal distribution at the community level (b). The x-axis ranges from 0 to 20 on a log-scale in both graphs. Redrawn from Brown and Nicoletto (1991). [3]

Counter examples

Not all geographic subsets of taxonomic groups follow this broad pattern, in contrast, Northwest European land snails exhibit a normal distribution (Hausdorf, 2006 [8] ). Additionally, the terrestrial mammals of the islands of Madagascar, New Guinea and Australia do not show a right skewed body size-species richness distribution (Maurer et al. 1992 [7] ). Given the limited amount of non-conforming data it is not possible to determine if this phenomenon is universal or is simply novel in certain environments. Underreporting of taxonomic and geographic subsets that do not conform to this pattern may be partially responsible for this unresolve.

Possible mechanisms

If it were possible to randomly sample a subset of the known continental species pool for mammals, one would expect the body size-species richness distribution of this sample to roughly mirror that of the entire continent. Since it does not, and if it is assumed that the observed distribution of species among body sizes is not a sampling bias, then some ecological interactions must underlie this pattern. Explanations in the literature suggest the rates of speciation and/or dispersal ability vary with size and could lead to more small bodied organisms (May, 1978 [2] ). Additionally, extinction risk, competition and energetic restraints have also been proposed as critical mechanisms that may drive this pattern (Brown and Maurer, 1989; [5] Brown and Nicoletto, 1991 [3] ). Finally, the metabolic theory of ecology explains how there is a negative relationship between number of individuals (N) and size (M) (), but it is silent on species richness. Remember, while there are fewer individuals in the largest size classes, energy availability is equal across all classes of interacting organisms (i.e. they share the same energy pool and are thus part of the same ecosystem) (energetic equivalence) (May, 1988 [9] ). It is important to note that the 3 sub-mechanisms: dispersal, competition and energetic restraints must in some manner feed back into either speciation or extinction rates as these are the only ultimate processes (see Tinbergen's four questions) governing the number of species on earth and hence the body size-species richness pattern.

Speciation rates

Small organisms generally have shorter generation times and are quick to mature and reproduce (May, 1978; [2] Denney et al. 2002; [10] Savage et al. 2004 [11] ). These traits may promote speciation through increased mutation and selection events as molecular evolution scales with metabolic rate (Gillooly et al. 2005 [12] ) and thus with body size. For example, bacteria can evolve a degree of antibiotic resistance in a very short time period. This evolution is facilitated by a short generation time and presumably would not be possible for species with slower life histories. Thus, one can think of it as if the "evolutionary clock ticks faster" (May, 1978 [2] ) for small organisms. If this were true then a simple explanation of why there are more small species on earth would be because they speciate faster. However, an analysis by Cardillo and colleagues (2003) [13] revealed that body size did not influence the speciation rates of Australia's mammals. Similarly, a study using birds failed to demonstrate that body size and speciation rates were negatively correlated (Nee et al. 1992 [14] ).

Differential extinction rates

It is known that extinction risk is directly correlated to the size of a species population. Small populations tend to go extinct more frequently than large ones (MacArthur and Wilson, 1967 [15] ). As large species require more daily resources they are forced to have low population densities, thereby lowering the size of the population in a given area and allowing each individual to have access to enough resources to survive. In order to increase the population size and avoid extinction, large organisms are constrained to have large ranges (see Range (biology)). Thus, the extinction of large species with small ranges becomes inevitable (MacArthur and Wilson, 1967; [15] Brown and Maurer, 1989; [5] Brown and Nicoletto, 1991 [3] ). This results in the amount of space limiting the overall number of large animals that can be present on a continent, while range size (and risk of extinction) prevents large animals from inhabiting only a small area. These constraints undoubtedly have implications for the species richness patterns for both large and small-bodied organisms, however the specifics have yet to be elucidated.

Dispersal rate

Understanding dispersal is an important mechanism that may underlie the body size-species richness pattern. Mainly, dispersal ability can affect speciation rates in various ways: if an organism is capable of dispersing across great distances which span variable habitat, it will be more likely that individuals that settle in these new areas will be subject to different selection regimes, leading to new species through natural selection. Alternatively, great dispersal ability can act against the efforts of natural selection by facilitating geneflow. Thus, species with greater dispersal ability may in fact have lower speciation rates. Then again, if a species disperses long distances and has a large range, it may also be more likely to have its range bisected by natural barriers which could promote allopatric speciation over evolutionary time.

Researchers have shown that body size and dispersal ability do not correlate (Jenkins et al. 2007 [16] ). However, this finding rests heavily on the fact that active and passive dispersers have been grouped together in the analyses. When the same data are separated into two categories (active and passive dispersers) a pattern emerges. Jenkins and others (2007 [16] ) have found that for active dispersers larger organisms will disperse greater distances. Regardless of this correlation its effects on speciation rates remain unclear.

Interspecific competition

Could similar sized species be mitigating the effects of competition by avoiding each other? Interspecific competition is in fact strong among species that are the same size (Bowers and Brown, 1982 [17] ). Researchers have proposed that in order to lessen the burden of competition among animals within the same guild (see Guild (ecology)), they must vary in size (Brown and Maurer, 1989; [5] Brown and Nicoletto, 1991 [3] ). For example, Bowers and Brown (1982) [17] found that the number of similar sized species in a community of granivorous rodents was fewer than expected. They believe that these results suggest that competition between same-sized species is prohibiting co-existence in this community.

Energetic constraints

A small bodied animal has a greater capacity to be more abundant than a large bodied one. Purely as a function of geometry many more small things can be packed into a given space than can large things into the same area. However, these limits are generally never reached in ecological systems as other resources become limiting long before the packing limits are reached. Additionally, smaller species may have many more ecological niches available to them and thus facilitating the diversification of life (Hutchinson and MacArthur, 1959 [1] ).

Larger organisms require more food overall (Blackburn and Gaston, 1997 [18] ), however they require less energy per unit of body mass. As a result, larger species are able to survive on a lower quality diet than smaller species. For example, grazing animals make up for their poor quality diet by digesting food longer and are able to extract more energy from it (Maurer et al. 1992 [7] ). Smaller species tend to specialize in a habitat that can provide them with a high quality diet.

Habitat quality is highly variable and as a result smaller species tend to be present in less of their range. Instead, they are only found in patches of their range where there is good habitat. A correlate to this argument is that the opposite is true for larger species. Larger species have lower beta diversity and are replaced less frequently across landscapes and as a result tend to occupy more of their range (see Occupancy-abundance relationship relationships) (Brown and Maurer, 1989; [5] Brown and Nicoletto, 1991 [3] ). This mechanism likely contributes to the shift in body size-species richness distribution observed between continental and local scales.

Recently, the metabolic theory of ecology has been used to explain macroecological patterns. According to May (1978 [9] ) there is equal energy flow through all size classes of interacting organisms. This has implications for the number of individuals in each size class and potentially the number of species as well. May (1978 [2] ) was the first to describe a mathematical equation that could be used to explain the right hand side of the body size-species richness pattern . His equation states that the number of species (S) is proportional to the length (L) of the species raised to the exponent of negative two (). This theory is based on data from many different terrestrial animals (mammals, birds, beetles, and butterflies) and has garnered further support from a more recent study by Rice and Gislason (1996). [19] These new results also demonstrate a slope of negative two with respect to the right side of the body size-species richness pattern in the fish assemblage of the North Sea. Whether a slope of -2 is universal and what the mechanisms are that underlie this theory remain unclear.


Figure 3. The Frequency distribution of North American land mammals (n=465). The figure shows a right skewed distribution, with a mode tending to smaller species (50-100 g). Redrawn from Brown and Maurer (1989). Intercontinental land mammals.png
Figure 3. The Frequency distribution of North American land mammals (n=465). The figure shows a right skewed distribution, with a mode tending to smaller species (50–100 g). Redrawn from Brown and Maurer (1989).

See also

Related Research Articles

<span class="mw-page-title-main">Biogeography</span> Study of the distribution of species and ecosystems in geographic space and through geological time

Biogeography is the study of the distribution of species and ecosystems in geographic space and through geological time. Organisms and biological communities often vary in a regular fashion along geographic gradients of latitude, elevation, isolation and habitat area. Phytogeography is the branch of biogeography that studies the distribution of plants. Zoogeography is the branch that studies distribution of animals. Mycogeography is the branch that studies distribution of fungi, such as mushrooms.

Phylogeography is the study of the historical processes that may be responsible for the past to present geographic distributions of genealogical lineages. This is accomplished by considering the geographic distribution of individuals in light of genetics, particularly population genetics.

The metabolic theory of ecology (MTE) is the ecological component of the more general Metabolic Scaling Theory and Kleiber's law. It posits that the metabolic rate of organisms is the fundamental biological rate that governs most observed patterns in ecology. MTE is part of a larger set of theory known as metabolic scaling theory that attempts to provide a unified theory for the importance of metabolism in driving pattern and process in biology from the level of cells all the way to the biosphere.

<span class="mw-page-title-main">Biological dispersal</span> Movement of individuals from their birth site to a breeding site

Biological dispersal refers to both the movement of individuals from their birth site to their breeding site, as well as the movement from one breeding site to another . Dispersal is also used to describe the movement of propagules such as seeds and spores. Technically, dispersal is defined as any movement that has the potential to lead to gene flow. The act of dispersal involves three phases: departure, transfer, settlement and there are different fitness costs and benefits associated with each of these phases. Through simply moving from one habitat patch to another, the dispersal of an individual has consequences not only for individual fitness, but also for population dynamics, population genetics, and species distribution. Understanding dispersal and the consequences both for evolutionary strategies at a species level, and for processes at an ecosystem level, requires understanding on the type of dispersal, the dispersal range of a given species, and the dispersal mechanisms involved.

<span class="mw-page-title-main">Endemism</span> Species unique to a location or habitat

Endemism is the state of a species being found in a single defined geographic location, such as an island, state, nation, country or other defined zone; organisms that are indigenous to a place are not endemic to it if they are also found elsewhere. For example, the Cape sugarbird is found exclusively in southwestern South Africa and is therefore said to be endemic to that particular part of the world.

Macroecology is the subfield of ecology that deals with the study of relationships between organisms and their environment at large spatial scales to characterise and explain statistical patterns of abundance, distribution and diversity. The term was coined in a small monograph published in Spanish in 1971 by Guillermo Sarmiento and Maximina Monasterio, two Venezuelan researchers working in tropical savanna ecosystems and later used by James Brown of the University of New Mexico and Brian Maurer of Michigan State University in a 1989 paper in Science.

Insular biogeography or island biogeography is a field within biogeography that examines the factors that affect the species richness and diversification of isolated natural communities. The theory was originally developed to explain the pattern of the species–area relationship occurring in oceanic islands. Under either name it is now used in reference to any ecosystem that is isolated due to being surrounded by unlike ecosystems, and has been extended to mountain peaks, seamounts, oases, fragmented forests, and even natural habitats isolated by human land development. The field was started in the 1960s by the ecologists Robert H. MacArthur and E. O. Wilson, who coined the term island biogeography in their inaugural contribution to Princeton's Monograph in Population Biology series, which attempted to predict the number of species that would exist on a newly created island.

<span class="mw-page-title-main">Kleiber's law</span>

Kleiber's law, named after Max Kleiber for his biology work in the early 1930s, is the observation that, for the vast majority of animals, an animal's metabolic rate scales to the 34 power of the animal's mass. Symbolically: if q0 is the animal's metabolic rate, and M is the animal's mass, then Kleiber's law states that q0~M3/4. Thus, over the same time span, a cat having a mass 100 times that of a mouse will consume only about 32 times the energy the mouse uses.

<span class="mw-page-title-main">Species–area relationship</span>

The species-area relationship or species-area curve describes the relationship between the area of a habitat, or of part of a habitat, and the number of species found within that area. Larger areas tend to contain larger numbers of species, and empirically, the relative numbers seem to follow systematic mathematical relationships. The species-area relationship is usually constructed for a single type of organism, such as all vascular plants or all species of a specific trophic level within a particular site. It is rarely if ever, constructed for all types of organisms if simply because of the prodigious data requirements. It is related but not identical to the species discovery curve.

<span class="mw-page-title-main">Latitudinal gradients in species diversity</span> Global increase in species richness from polar regions to tropics

Species richness, or biodiversity, increases from the poles to the tropics for a wide variety of terrestrial and marine organisms, often referred to as the latitudinal diversity gradient. The latitudinal diversity gradient is one of the most widely recognized patterns in ecology. It has been observed to varying degrees in Earth's past. A parallel trend has been found with elevation, though this is less well-studied.

<span class="mw-page-title-main">Species distribution</span> Geographical area in which a species can be found

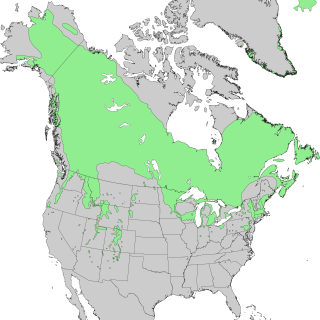
Species distribution —or speciesdispersion — is the manner in which a biological taxon is spatially arranged. The geographic limits of a particular taxon's distribution is its range, often represented as shaded areas on a map. Patterns of distribution change depending on the scale at which they are viewed, from the arrangement of individuals within a small family unit, to patterns within a population, or the distribution of the entire species as a whole (range). Species distribution is not to be confused with dispersal, which is the movement of individuals away from their region of origin or from a population center of high density.

In landscape ecology, landscape connectivity is, broadly, "the degree to which the landscape facilitates or impedes movement among resource patches". Alternatively, connectivity may be a continuous property of the landscape and independent of patches and paths. Connectivity includes both structural connectivity and functional connectivity. Functional connectivity includes actual connectivity and potential connectivity in which movement paths are estimated using the life-history data.

In ecology, the occupancy–abundance (O–A) relationship is the relationship between the abundance of species and the size of their ranges within a region. This relationship is perhaps one of the most well-documented relationships in macroecology, and applies both intra- and interspecifically. In most cases, the O–A relationship is a positive relationship. Although an O–A relationship would be expected, given that a species colonizing a region must pass through the origin and could reach some theoretical maximum abundance and distribution, the relationship described here is somewhat more substantial, in that observed changes in range are associated with greater-than-proportional changes in abundance. Although this relationship appears to be pervasive, and has important implications for the conservation of endangered species, the mechanism(s) underlying it remain poorly understood

<i>The Theory of Island Biogeography</i> 1967 book by Robert MacArthur and Edward O. Wilson

The Theory of Island Biogeography is a 1967 book by the ecologist Robert MacArthur and the biologist Edward O. Wilson. It is widely regarded as a seminal piece in island biogeography and ecology. The Princeton University Press reprinted the book in 2001 as a part of the "Princeton Landmarks in Biology" series. The book popularized the theory that insular biota maintain a dynamic equilibrium between immigration and extinction rates. The book also popularized the concepts and terminology of r/K selection theory.

Defaunation is the global, local or functional extinction of animal populations or species from ecological communities. The growth of the human population, combined with advances in harvesting technologies, has led to more intense and efficient exploitation of the environment. This has resulted in the depletion of large vertebrates from ecological communities, creating what has been termed "empty forest". Defaunation differs from extinction; it includes both the disappearance of species and declines in abundance. Defaunation effects were first implied at the Symposium of Plant-Animal Interactions at the University of Campinas, Brazil in 1988 in the context of Neotropical forests. Since then, the term has gained broader usage in conservation biology as a global phenomenon.

<span class="mw-page-title-main">Dispersal vector</span>

A dispersal vector is an agent of biological dispersal that moves a dispersal unit, or organism, away from its birth population to another location or population in which the individual will reproduce. These dispersal units can range from pollen to seeds to fungi to entire organisms.

In macroecology and community ecology, an occupancy frequency distribution (OFD) is the distribution of the numbers of species occupying different numbers of areas. It was first reported in 1918 by the Danish botanist Christen C. Raunkiær in his study on plant communities. The OFD is also known as the species-range size distribution in literature.

Microbial biogeography is a subset of biogeography, a field that concerns the distribution of organisms across space and time. Although biogeography traditionally focused on plants and larger animals, recent studies have broadened this field to include distribution patterns of microorganisms. This extension of biogeography to smaller scales—known as "microbial biogeography"—is enabled by ongoing advances in genetic technologies.

The rescue effect is a phenomenon which was first described by Brown and Kodric-Brown, and is commonly used in metapopulation dynamics and many other disciplines in ecology. This populational process explains how the migration of individuals can increase the persistence of small isolated populations by helping to stabilize a metapopulation, thus reducing the chances of extinction. In other words, immigration can lead to the recolonization of previously extinct patches, promoting the long-term persistence of the network of populations.

References

  1. 1 2 3 4 Hutchinson GE & MacArthur RH (1959) A theoretical ecological model of size distributions among species of animals. American Naturalist 93(869):117-125.
  2. 1 2 3 4 5 May, R. Diversity of insect faunas. Blackwell scientific publications:London. 1978. 188-203.
  3. 1 2 3 4 5 6 7 8 9 Brown JH & Nicoletto PF (1991) Spatial scaling of the species composition - body masses of North-American land mammals. American Naturalist 138(6):1478-1512.
  4. McClain CR (2004) Connecting species richness, abundance and body size in deep-sea gastropods. Global Ecology and Biogeography 13(4):327-334.
  5. 1 2 3 4 5 6 7 8 Brown JH & Maurer BA (1989) Macroecology – the division of food and space among species on the continents. Science 243(4895):1145-1150.
  6. 1 2 3 Bakker VJ & Kelt DA (2000) Scale-dependent patterns in body size distributions of neotropical mammals. Ecology 81(12):3530-3547.
  7. 1 2 3 Maurer BA, Brown JH, & Rusler RD (1992) The micro and macro in body size evolution. Evolution 46(4):939-953.
  8. Hausdorf B (2006) Is the interspecific variation of body size of land snails correlated with rainfall in Israel and Palestine? Acta Oecologica-International Journal of Ecology 30(3):374-379.
  9. 1 2 May, R (1988) How many species are there on earth? Science 241(4872):1441-1449.
  10. Denney NH, Jennings S & Reynolds JD (2002) Life history correlates of maximum population growth rates in marine fishes. Proceedings of the Royal Society of London, 269(1506):2229-2237.
  11. Savage VM, Gillooly JF, Brown JH, West GB & Charnov EL (2004) Effects of body size and temperature on population growth. American Naturalist. 163:429-441.
  12. Gillooly JF, Allen AP, West GB, & Brown JH (2005) The rate of DNA evolution: Effects of body size and temperature on the molecular clock. Proceedings of the National Academy of Sciences of the United States of America 102(1):140-145.
  13. Cardillo M, Huxtable JS, & Bromham L (2003) Geographic range size, life history and rates of diversification in Australian mammals. Journal of Evolutionary Biology 16(2):282-288.
  14. Nee S, Mooers A & Harvey P (1992) Tempo and mode of evolution revealed from molecular phylogenies. Proceedings of the National Academy of Sciences of the United States of America 89(17):8322-8326.
  15. 1 2 MacArthur, RH & Wilson, EO (1967) The theory of island biogeography. Princeton, New Jersey. Princeton Universal Press.
  16. 1 2 Jenkins DG, Brescacin CR, Duxbury CV, Elliott JA, Evans JA, Grablow KR, Hillegass M, Lyon BN, Metzger GA, Olandese ML, Pepe D, Silvers GA, Suresch HN, Thompson TN, Trexler CM, Williams GE, Williams NC & Williams SE (2007) Does size matter for dispersal distance? Global Ecology and Biogeography 16(4):415-425.
  17. 1 2 Bowers MA & Brown JH (1982) Body size and coexistence in desert rodents – chance or community structure. Ecology 63(2):391-400.
  18. Gaston, KJ, TM Blackburn, & JH Lawton (1997) Interspecific abundance-range size relationships: an appraisal of mechanisms. Journal of Animal Ecology 66:579–601.
  19. Rice J & Gislason H (1996) Patterns of change in the size spectra of numbers and diversity of the North Sea fish assemblage, as reflected in surveys and models. 53:1214-1225.