Breakpoint

Last updated
The debugging interface of Eclipse with a program suspended at a breakpoint. Panels with stack trace (upper left) and watched variables (upper right) can be seen. Eclipse suspended at breakpoint.png
The debugging interface of Eclipse with a program suspended at a breakpoint. Panels with stack trace (upper left) and watched variables (upper right) can be seen.

In software development, a breakpoint is an intentional stopping or pausing place in a program, put in place for debugging purposes. It is also sometimes simply referred to as a pause.

Contents

More generally, a breakpoint is a means of acquiring knowledge about a program during its execution. During the interruption, the programmer inspects the test environment (general-purpose registers, memory, logs, files, etc.) to find out whether the program is functioning as expected. In practice, a breakpoint consists of one or more conditions that determine when a program's execution should be interrupted.

History

Breakpoints were invented for ENIAC, one of the earliest digital computers, by programmer Betty Holberton. [1] In the initial design of ENIAC, program flow was set by plugging cables from one unit to another. To make the program stop at a certain point, a cable was removed, called a breakpoint. [2]

Types of breakpoints

Machine breakpoints

Early mainframe computers, such as the IBM/360, had console switches/dials that allowed breakpoints at specific instruction storage addresses and provided "single cycle" operation, permitting the contents of registers and memory to be observed directly on console lights. The advent of multitasking limited the use of this option since the entire machine was halted.

Non-interactive breakpoints

Programmers have used machine code patches to implement single destructive breakpoints to cause a core dump since the early days of computers. The core dump provided the state of the registers and memory at the exact moment of the deliberate "crash".

Interactive breakpoints

The advent of teletypewriter consoles in the 1960s allowed more interactive command line debugging capabilities but it was not until the early 1970s and the arrival of ubiquitous video monitors connected to mainframes that fully interactive, full screen debugging in multitasking environments became a reality. This also permitted step-by-step program execution in a true program animation manner with optional register and memory alterations simultaneously displayed. Initially this type of animation was at the level of disassembled or decompiled machine code, but later advanced to HLL source level animation.

Conditional breakpoints

Breakpoints are most commonly used to interrupt a running program immediately before the execution of a programmer-specified instruction. This is often referred to as an instruction breakpoint.

Other kinds of conditions can also be used, such as the reading, writing, or modification of a specific location in an area of memory. This is often referred to as a data breakpoint, or a watchpoint. Many systems also support breakpoints that are only active if a condition is met (such as a variable having a certain value), usually referred to as conditional breakpoint. [3]

Inspection tools

When a breakpoint is hit, various tools are used to inspect the state of the program or alter it. Stack trace of each thread may be used to see the chain of function calls that led to the paused instruction. A list of watches allows one to view the values of selected variables and expressions. There may also be tools to show the contents of registers, loaded program modules and other information.

Logpoints

A logpoint is a type of breakpoint that only prints (or "logs") information instead of interrupting execution. Usually the developer can specify a message and/or values of variables to print when execution reaches a specific point. [4] Logpoints are an alternative to putting logging statements into the program being debugged (sometimes called printf debugging), and particularly helpful when changing the program is not practical (for example when debugging an external library called by the program).

Implementations

Hardware

Many processors include hardware support for breakpoints (typically instruction and data breakpoints). As an example, the x86 instruction set architecture provides hardware support for breakpoints with its x86 debug registers. Such hardware may include limitations, for example not allowing breakpoints on instructions located in branch delay slots. This kind of limitation is imposed by the microarchitecture of the processor and varies from processor to processor.

Software

Without hardware support (and in multitasking environments), debuggers have to implement breakpoints in software. For instruction breakpoints, this is a comparatively simple task of replacing the instruction at the location of the breakpoint by either:

This technique may be more difficult to implement in multitasking systems using shared program storage (the interrupt may occur on a different thread, requiring resurrection of the original instruction for that thread). Also, if the program resides in protected memory, overwriting of instructions may be prevented.

Alternatively,

Some debuggers allow registers or program variables in memory to be modified before resuming, effectively allowing the introduction of "hand-coded" temporary assignments for test purposes. Similarly, program instructions can often be skipped to determine the effect of changes to the program logic – enabling questions about program execution to be answered in a direct way (i.e. without assumptions or guesswork). In many cases it may be the only practical method of testing obscure "event-driven" error subroutines that rarely, if ever, get executed – without the added risk of leaving temporary source changes. Manually changing the resume location within a paused program can be used to enter an otherwise rarely executed section of code (such as a specific hardware condition handler).

Implementing data breakpoints in software however, can greatly reduce the performance of the application being debugged – since it is using additional resources on the same processor. [5] However, this is normally acceptable during testing and the amount of information available from the debugger is not restricted by limitations of debug data known to the hardware. For instance, a software implementation can collect logical path data at program/subroutine/instruction level to considerably augment what might be stored by the particular hardware platform for inspection. The instruction set simulation method considerably reduces the overhead, compared to the (repeated) instruction replacement method, also reducing cache misses.

Some programming language implementations expose their debugging functions for use by other programs. For example, some FORTRAN dialects have an AT statement, which was originally intended to act as an instruction breakpoint. Python implements a debugger accessible from a Python program. [6] These facilities can be and are [7] abused to act like the COMEFROM statement.

See also

Related Research Articles

<span class="mw-page-title-main">GNU Debugger</span> Source-level debugger

The GNU Debugger (GDB) is a portable debugger that runs on many Unix-like systems and works for many programming languages, including Ada, Assembly, C, C++, D, Fortran, Go, Objective-C, OpenCL C, Modula-2, Pascal, Rust, and partially others.

<span class="mw-page-title-main">PDP-8</span> Minicomputer product line

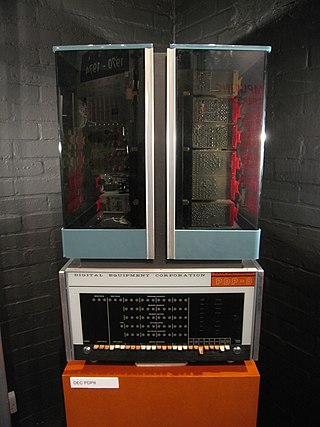
The PDP-8 is a family of 12-bit minicomputers that was produced by Digital Equipment Corporation (DEC). It was the first commercially successful minicomputer, with over 50,000 units being sold over the model's lifetime. Its basic design follows the pioneering LINC but has a smaller instruction set, which is an expanded version of the PDP-5 instruction set. Similar machines from DEC are the PDP-12 which is a modernized version of the PDP-8 and LINC concepts, and the PDP-14 industrial controller system.

In computing, an optimizing compiler is a compiler that tries to minimize or maximize some attributes of an executable computer program. Common requirements are to minimize a program's execution time, memory footprint, storage size, and power consumption.

<span class="mw-page-title-main">Debugger</span> Computer program used to test and debug other programs

A debugger or debugging tool is a computer program used to test and debug other programs. The main use of a debugger is to run the target program under controlled conditions that permit the programmer to track its execution and monitor changes in computer resources that may indicate malfunctioning code. Typical debugging facilities include the ability to run or halt the target program at specific points, display the contents of memory, CPU registers or storage devices, and modify memory or register contents in order to enter selected test data that might be a cause of faulty program execution.

<span class="mw-page-title-main">PIC microcontrollers</span> Programmable single-chip 16-bit microprocessor for computer

PIC is a family of microcontrollers made by Microchip Technology, derived from the PIC1650 originally developed by General Instrument's Microelectronics Division. The name PIC initially referred to Peripheral Interface Controller, and is currently expanded as Programmable Intelligent Computer. The first parts of the family were available in 1976; by 2013 the company had shipped more than twelve billion individual parts, used in a wide variety of embedded systems.

x86 assembly language is the name for the family of assembly languages which provide some level of backward compatibility with CPUs back to the Intel 8008 microprocessor, which was launched in April 1972. It is used to produce object code for the x86 class of processors.

In-circuit emulation (ICE) is the use of a hardware device or in-circuit emulator used to debug the software of an embedded system. It operates by using a processor with the additional ability to support debugging operations, as well as to carry out the main function of the system. Particularly for older systems, with limited processors, this usually involved replacing the processor temporarily with a hardware emulator: a more powerful although more expensive version. It was historically in the form of bond-out processor which has many internal signals brought out for the purpose of debugging. These signals provide information about the state of the processor.

JTAG is an industry standard for verifying designs and testing printed circuit boards after manufacture.

In computer programming, a return statement causes execution to leave the current subroutine and resume at the point in the code immediately after the instruction which called the subroutine, known as its return address. The return address is saved by the calling routine, today usually on the process's call stack or in a register. Return statements in many programming languages allow a function to specify a return value to be passed back to the code that called the function.

In computer programming, COMEFROM is an obscure control flow structure used in some programming languages, originally as a joke. COMEFROM is the inverse of GOTO in that it can take the execution state from any arbitrary point in code to a COMEFROM statement.

A branch is an instruction in a computer program that can cause a computer to begin executing a different instruction sequence and thus deviate from its default behavior of executing instructions in order. Branch may also refer to the act of switching execution to a different instruction sequence as a result of executing a branch instruction. Branch instructions are used to implement control flow in program loops and conditionals.

The TMS9900 was one of the first commercially available, single-chip 16-bit microprocessors. Introduced in June 1976, it implemented Texas Instruments' TI-990 minicomputer architecture in a single-chip format, and was initially used for low-end models of that lineup.

In computer science, a call stack is a stack data structure that stores information about the active subroutines of a computer program. This kind of stack is also known as an execution stack, program stack, control stack, run-time stack, or machine stack, and is often shortened to just "the stack". Although maintenance of the call stack is important for the proper functioning of most software, the details are normally hidden and automatic in high-level programming languages. Many computer instruction sets provide special instructions for manipulating stacks.

In computer architecture, a transport triggered architecture (TTA) is a kind of processor design in which programs directly control the internal transport buses of a processor. Computation happens as a side effect of data transports: writing data into a triggering port of a functional unit triggers the functional unit to start a computation. This is similar to what happens in a systolic array. Due to its modular structure, TTA is an ideal processor template for application-specific instruction set processors (ASIP) with customized datapath but without the inflexibility and design cost of fixed function hardware accelerators.

An instruction set simulator (ISS) is a simulation model, usually coded in a high-level programming language, which mimics the behavior of a mainframe or microprocessor by "reading" instructions and maintaining internal variables which represent the processor's registers.

RS08 is a family of 8-bit microcontrollers by NXP Semiconductors. Originally released by Freescale in 2006, the RS08 architecture is a reduced-resource version of the Freescale MC68HCS08 central processing unit (CPU), a member of the 6800 microprocessor family. It has been implemented in several microcontroller devices for embedded systems.

On the x86 architecture, a debug register is a register used by a processor for program debugging. There are six debug registers, named DR0...DR7, with DR4 and DR5 as obsolete synonyms for DR6 and DR7. The debug registers allow programmers to selectively enable various debug conditions associated with a set of four debug addresses. Two of these registers are used to control debug features. These registers are accessed by variants of the MOV instruction. A debug register may be either the source operand or destination operand. The debug registers are privileged resources; the MOV instructions that access them can only be executed at privilege level zero. An attempt to read or write the debug registers when executing at any other privilege level causes a general protection fault.

Program animation or stepping refers to the debugging method of executing code one instruction or line at a time. The programmer may examine the state of the program, machine, and related data before and after execution of a particular line of code. This allows the programmer to evaluate the effects of each statement or instruction in isolation, and thereby gain insight into the behavior of the executing program. Nearly all modern IDEs and debuggers support this mode of execution.

In computer programming and software development, debugging is the process of finding and resolving bugs within computer programs, software, or systems.

In computer programming, a function or subroutine is a sequence of program instructions that performs a specific task, packaged as a unit. This unit can then be used in programs wherever that particular task should be performed.

References

  1. Abbate, Janet (2012), Recoding Gender: Women's Changing Participation in Computing, MIT Press, p. 32, ISBN   9780262018067
  2. Thomas Haigh; Mark Priestley; Crispen Rope (2016). ENIAC in Action:Making and Remaking the Modern Computer. MIT Press. p. 153. ISBN   978-0-262-03398-5.
  3. "FAQ How do I set a conditional breakpoint?". Eclipse Wiki. Retrieved 2023-04-19.
  4. Walsh, David (2021-03-22). "Use Logpoints!". David Walsh Blog. Retrieved 2023-04-19.
  5. GDB Internals Archived November 29, 2011, at the Wayback Machine
  6. Python Library Reference: The Python Debugger Archived September 13, 2008, at the Wayback Machine
  7. entrian.com – goto and comefrom for Python