Burnage (ward)

Last updated

Burnage (Manchester)
Burnage (Manchester City Council ward) 2018.png
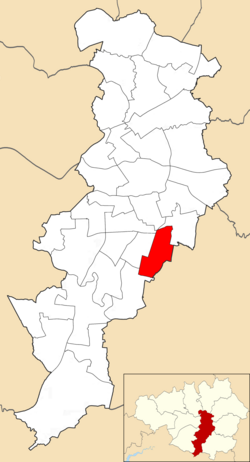
Burnage electoral ward within Manchester City Council
Arms of the City of Manchester.svg
Motto: 
By wisdom and effort
Burnage (ward)
Interactive map of Burnage (Manchester)
Coordinates: 53°25′38″N2°12′24″W / 53.4271°N 2.2067°W / 53.4271; -2.2067
Country United Kingdom
Constituent country England
Region North West England
County Greater Manchester
Metropolitan borough Manchester
CreatedMay 1973
Named after Burnage
Government
  Type Unicameral
  Body Manchester City Council
  Leader of the council Bev Craig (Labour)
  CouncillorAzra Ali (Labour)
  CouncillorBev Craig (Labour)
  CouncillorMurtaza Iqbal (Labour)
Population
  Total
15,227
UK Parliamentary Constituency Gorton and Denton
Member of ParliamentVacant
Area and population statistics from the 2011 Census [1]

Burnage is an area and electoral ward of Manchester, England. [2] It has been part of the Gorton and Denton constituency since 2024, and was in Manchester Withington prior to 2024. The 2011 Census recorded a population of 15,227. [1]

Contents

Councillors

As of 2025 three councillors serve the ward: Azra Ali (Lab), [3] Murtaza Iqbal (Lab), [4] and Bev Craig (Lab). [5]

ElectionCouncillorCouncillorCouncillor
2004 Rodney Isherwood (Lib Dem)Iain Donaldson (Lib Dem)John Cameron (Lib Dem)
2006 Rodney Isherwood (Lib Dem)Iain Donaldson (Lib Dem)John Cameron (Lib Dem)
2007 Rodney Isherwood (Lib Dem)Iain Donaldson (Lib Dem)John Cameron (Lib Dem)
2008 Rodney Isherwood (Lib Dem)Iain Donaldson (Lib Dem)John Cameron (Lib Dem)
2010 William Fisher (Lib Dem)Iain Donaldson (Lib Dem)John Cameron (Lib Dem)
2011 William Fisher (Lib Dem) Carl Austin (Lab)Bev Craig (Lab)
2012 William Fisher (Lib Dem) Carl Austin (Lab)Bev Craig (Lab)
2014 Azra Ali (Lab) Carl Austin (Lab)Bev Craig (Lab)
2015 Azra Ali (Lab) Carl Austin (Lab)Bev Craig (Lab)
2016 Azra Ali (Lab) Carl Austin-Behan [6] (Lab)Bev Craig (Lab)
2018 Azra Ali (Lab)Bev Craig (Lab)Ben Clay (Lab)
2019 Azra Ali (Lab)Bev Craig (Lab)Ben Clay (Lab)
2021 Azra Ali (Lab)Bev Craig (Lab)Ben Clay (Lab)
2022 Azra Ali (Lab)Bev Craig (Lab)Murtaza Iqbal (Lab)
2023 Azra Ali (Lab)Bev Craig (Lab)Murtaza Iqbal (Lab)
2024 Azra Ali (Lab)Bev Craig (Lab)Murtaza Iqbal (Lab)

  indicates seat up for re-election.   indicates seat won in by-election.

Elections in 2020s

* denotes incumbent councillor seeking re-election.

May 2024

2024
PartyCandidateVotes%±%
Labour Bev Craig* 2,257 53.2 19.0 Decrease2.svg
Green Asma Alam81519.211.1 Increase2.svg
Workers Party Syed Ataur Rahman70716.7New
Liberal Democrats Kobe Bibbon2105.01.4 Decrease2.svg
Conservative Muhammad Tahir1974.65.4 Decrease2.svg
Majority 1,44234.0
Rejected ballots531.3
Turnout 4,23932.1
Registered electors 13,222
Labour hold Swing 14.9 Decrease2.svg

May 2023

2023
PartyCandidateVotes%±%
Labour Azra Ali* 2,376 66.1 2.1 Increase2.svg
Green Dick Venes50614.14.2 Increase2.svg
Liberal Democrats John Cameron49713.81.8 Decrease2.svg
Conservative Md Shahed Hossain1995.51.4 Increase2.svg
Majority
Rejected ballots160.4
Turnout
Registered electors 12,982
Labour hold Swing

May 2022

2022
PartyCandidateVotes%±%
Labour Murtaza Iqbal 2,359 66.8 2.7 Decrease2.svg
Green Dick Venes54215.44.9 Increase2.svg
Liberal Democrats Bryn Coombe3409.68.2 Decrease2.svg
Conservative Md Hossain2657.50.6 Increase2.svg
Majority 1,81751.8
Rejected ballots25
Turnout 3,50627.45.2 Decrease2.svg
Registered electors 12,908
Labour hold Swing 3.9 Decrease2.svg

May 2021

2021
PartyCandidateVotes%±%
Labour Bev Craig* 3,036 72.2 1.8 Decrease2.svg
Conservative Shahed Hossain42110.03.3 Increase2.svg
Green Brian Candeland3418.14.2 Increase2.svg
Liberal Democrats Jamie Dwan2706.49.0 Decrease2.svg
Independent Andrea Timoney1373.3New
Majority 2,61562.2
Rejected ballots431.0
Turnout 4,24830.7
Registered electors 13,045
Labour hold Swing 2.6 Decrease2.svg

Elections in 2010s

May 2019

2019
PartyCandidateVotes%±%
Labour Azra Ali* 2,337 64.0 Increase2.svg0.7
Liberal Democrats Andrea Timoney57015.6Decrease2.svg2.2
Green Benjamin Dundas3629.9Decrease2.svg0.6
UKIP Ian Rae2336.4n/a
Conservative Shahed Hossain1494.1Decrease2.svg1.5
Majority 1,76748.2Increase2.svg2.7
Rejected ballots180.49
Turnout 3,66828.66Decrease2.svg3.9
Registered electors 12,800
Labour hold Swing Increase2.svg1.45

May 2018

2018 [7]
PartyCandidateVotes%±%
Labour Ben Clay 2,913 69.5
Labour Bev Craig* 2,853 68.1
Labour Azra Ali* 2,652 63.3
Liberal Democrats Andrea Timoney74717.8
Liberal Democrats Maria Turner54112.9
Liberal Democrats Mohamed Sabbagh45710.9
Green Lance Crookes44210.5
Conservative Samuel Baxter2916.9
Conservative Lexi Webster2415.8
Conservative Shahed Hossain2345.6
Majority
Turnout 4,19132.6
Labour win (new boundaries)

May 2016

2016 [8]
PartyCandidateVotes%±%
Labour Bev Craig* 2,291 63.20
Liberal Democrats Maria Theresa Turner48913.49
UKIP Liam Thomas Evans46012.69
Green Sam Darby3399.35
Conservative Sahed Hossain461.27
Majority 1,80249.71
Turnout 3,62533.82
Labour hold Swing

May 2015

2015 [9]
PartyCandidateVotes%±%
Labour Carl Jason Austin* 4,010 60.9 −2.1
Liberal Democrats Maria Theresa Turner1,23518.8−7.2
Green Sam Darby81512.4+6.3
Conservative Shahed Hossain5248.0+3.3
Majority 2,77542.1
Turnout 6,58460.2+20.4
Labour hold Swing

May 2014

2014 [10]
PartyCandidateVotes%±%
Labour Azra Ali 2,055 55.65 +13.25
Green Sam Darby68518.55+14.55
Liberal Democrats Ronan Stafford68418.52−26.88
Conservative Josh Lelliot2697.28+2.4
Majority 1,37037.10
Turnout 3,69333.76
Labour gain from Liberal Democrats Swing

May 2012

2012 [11]
PartyCandidateVotes%±%
Labour Bev Craig* 2,416 72.0 +48.3
Liberal Democrats Grace Baynham51315.3−49.5
Green Sam Darby2627.8+3.4
Conservative Peter Schofield1634.9−2.2
Majority 1,90356.7
Turnout 3,35431.2
Labour hold Swing

May 2011

2011 [12]
PartyCandidateVotes%±%
Labour Carl Austin 2,668 63.0
Labour Bev Craig 2,283
Liberal Democrats Grace Baynham1,10326.0
Liberal Democrats Iain Donaldson*1,005
Green Dan Collinson2606.1
Conservative Jean Mee2034.8
Conservative Peter Schofield196
Majority 1,18037.0
Turnout 4,23439.8
Labour gain from Liberal Democrats Swing

May 2010

2010 [13]
PartyCandidateVotes%±%
Liberal Democrats William David Fisher 2,735 45.4 −19.4
Labour Carl Jason Austin2,55242.4+18.7
Conservative Peter Malcolm Schofield4898.1+1.0
Green Dan Collinson2434.0−0.4
Majority 1833.0−38.1
Turnout 6,01957.6+26.6
Liberal Democrats hold Swing -19.0

Elections in 2000s

2008 [14]
PartyCandidateVotes%±%
Liberal Democrats John Cameron* 2,096 64.8 +10.5
Labour Tom Murphy76823.7−12.3
Conservative Peter Schofield2287.1+1.3
Green Angela Tibke1424.4+0.5
Majority 1,32841.1+22.8
Turnout 3,23431.0−1.0
Liberal Democrats hold Swing +11.4
2007 [15]
PartyCandidateVotes%±%
Liberal Democrats Iain Donaldson* 1,825 54.3 +6.8
Labour Frank Duffy1,20936.0−2.0
Conservative Peter Schofield1945.8−2.4
Green Joseph Gair1323.9−0.9
Majority 61618.3+8.8
Turnout 3,36032.0+2.2
Liberal Democrats hold Swing +4.4
2006 [16]
PartyCandidateVotes%±%
Liberal Democrats Rodney Alan Isherwood* 1,460 47.5 −10.4
Labour Frank Oliver Duffy1,16938.0+12.7
Conservative Dorothy Helen Keller2528.2−0.5
Green Elindsay James1494.8−3.2
Majority 2919.5−23.1
Turnout 3,07329.8−10.3
Liberal Democrats hold Swing -11.5
2004 [17]
PartyCandidateVotes%±%
Liberal Democrats John Cameron* 2,484 57.9 N/A
Liberal Democrats Iain Donaldson* 1,925
Liberal Democrats Rodney Isherwood 1,846
Labour Frank Duffy1,08525.3N/A
Labour Bernard Selby*964
Labour William Parbury542
Conservative Gregory Stevens3738.7N/A
Green Matthew Payne3448.0N/A
Green Michael Shaw263
Green Barry McAtarsney230
Majority 76132.6N/A
Turnout 4,28640.1N/A
Liberal Democrats win (new seat)
2003 [18]
PartyCandidateVotes%±%
Liberal Democrats John Cameron 1,758 60.8 +18.7
Labour Michael Green*91431.6−14.7
Conservative Peter Schofield1424.9−3.6
Green Michael Shaw792.7−0.5
Majority 84429.2+25.1
Turnout 2,89329.1+0.6
Liberal Democrats gain from Labour Swing +16.7
2002 [19]
PartyCandidateVotes%±%
Labour Marilyn Taylor* 1,330 46.3 +0.9
Liberal Democrats John Cameron1,21142.1+15.2
Conservative Peter Schofield2438.5−9.2
Green Michael Shaw913.2−6.8
Majority 1194.1−14.4
Turnout 2,87528.5+6.6
Labour hold Swing -7.1
2000 [20]
PartyCandidateVotes%±%
Labour Kathleen Robinson* 956 45.4 −15.3
Liberal Democrats John Cameron56726.9+11.6
Conservative Peter Schofield37217.7−1.7
Green Adrian Crawford21010.0+6.6
Majority 38918.5−22.7
Turnout 2,10521.9+0.6
Labour hold Swing -13.4

References

  1. 1 2 "Area: Burnage (Manchester Ward)". neighbourhood.statistics.gov.uk. Retrieved 27 April 2017.
  2. "Council wards in Manchester". manchester.gov.uk. Manchester City Council . Retrieved 27 April 2017.
  3. "Azra Ali". manchester.gov.uk. Manchester City Council . Retrieved 24 January 2026.
  4. "Murtaza Iqbal". manchester.gov.uk. Manchester City Council . Retrieved 24 January 2026.
  5. "Bev Craig". manchester.gov.uk. Manchester City Council . Retrieved 24 January 2026.
  6. Nagesh, Ashitha (18 May 2016). "Former Mr Gay UK kicked out of RAF for his sexuality sworn in as Lord Mayor". Metro . Retrieved 22 February 2018.
  7. "3 May 2018 Local Government Election results". manchester.gov.uk. Manchester City Council. 4 May 2018. Retrieved 22 May 2018.
  8. "Local election results - Thursday 5 May 2016". manchester.gov.uk. Manchester City Council . Retrieved 30 April 2017.
  9. "Local election results - Thursday 7 May 2015". manchester.gov.uk. Manchester City Council . Retrieved 30 April 2017.
  10. "Local election results 2014". manchester.gov.uk. Manchester City Council . Retrieved 30 April 2017.
  11. "Results of the Manchester City Council election, 2012". manchester.gov.uk. Manchester City Council . Retrieved 30 April 2017.
  12. "Local election results 2011". manchester.gov.uk. Manchester City Council . Retrieved 30 April 2017.
  13. "Election results: 6 May 2010". manchester.gov.uk. Manchester City Council . Retrieved 30 April 2017.
  14. "Local elections 2008". manchester.gov.uk. Manchester City Council . Retrieved 1 May 2017.
  15. "Local elections 2007". manchester.gov.uk. Manchester City Council . Retrieved 1 May 2017.
  16. "Local elections 2006". manchester.gov.uk. Manchester City Council . Retrieved 1 May 2017.
  17. "Local Elections 10 June 2004". manchester.gov.uk. Manchester City Council. Archived from the original on 26 June 2004. Retrieved 1 May 2017.
  18. "Local Election Results - 1 May 2003". manchester.gov.uk. Manchester City Council. Archived from the original on 7 July 2003. Retrieved 1 May 2017.
  19. "Results of local elections 2nd May 2002". manchester.gov.uk. Manchester City Council. Archived from the original on 5 November 2002. Retrieved 1 May 2017.
  20. "Results of Local Elections 4th May 2000". manchester.gov.uk. Manchester City Council. Archived from the original on 26 June 2002. Retrieved 1 May 2017.