Autocorrelation, sometimes known as serial correlation in the discrete time case, is the correlation of a signal with a delayed copy of itself as a function of delay. Informally, it is the similarity between observations of a random variable as a function of the time lag between them. The analysis of autocorrelation is a mathematical tool for finding repeating patterns, such as the presence of a periodic signal obscured by noise, or identifying the missing fundamental frequency in a signal implied by its harmonic frequencies. It is often used in signal processing for analyzing functions or series of values, such as time domain signals.

In probability theory and statistics, variance is the expectation of the squared deviation of a random variable from its population mean or sample mean. Variance is a measure of dispersion, meaning it is a measure of how far a set of numbers is spread out from their average value. Variance has a central role in statistics, where some ideas that use it include descriptive statistics, statistical inference, hypothesis testing, goodness of fit, and Monte Carlo sampling. Variance is an important tool in the sciences, where statistical analysis of data is common. The variance is the square of the standard deviation, the second central moment of a distribution, and the covariance of the random variable with itself, and it is often represented by , , , , or .

In probability theory and statistics, the multivariate normal distribution, multivariate Gaussian distribution, or joint normal distribution is a generalization of the one-dimensional (univariate) normal distribution to higher dimensions. One definition is that a random vector is said to be k-variate normally distributed if every linear combination of its k components has a univariate normal distribution. Its importance derives mainly from the multivariate central limit theorem. The multivariate normal distribution is often used to describe, at least approximately, any set of (possibly) correlated real-valued random variables each of which clusters around a mean value.

In statistics, correlation or dependence is any statistical relationship, whether causal or not, between two random variables or bivariate data. Although in the broadest sense, "correlation" may indicate any type of association, in statistics it usually refers to the degree to which a pair of variables are linearly related. Familiar examples of dependent phenomena include the correlation between the height of parents and their offspring, and the correlation between the price of a good and the quantity the consumers are willing to purchase, as it is depicted in the so-called demand curve.
In probability theory and statistics, covariance is a measure of the joint variability of two random variables. If the greater values of one variable mainly correspond with the greater values of the other variable, and the same holds for the lesser values, the covariance is positive. In the opposite case, when the greater values of one variable mainly correspond to the fewer values of the other,, the covariance is negative. The sign of the covariance, therefore, shows the tendency in the linear relationship between the variables. The magnitude of the covariance is the geometric mean of the variances that are in-common for the two random variables. The correlation coefficient normalizes the covariance by dividing by the geometric mean of the total variances for the two random variables.

In probability theory and statistics, a covariance matrix is a square matrix giving the covariance between each pair of elements of a given random vector. Any covariance matrix is symmetric and positive semi-definite and its main diagonal contains variances.

In statistics, the Pearson correlation coefficient ― also known as Pearson's r, the Pearson product-moment correlation coefficient (PPMCC), the bivariate correlation, or colloquially simply as the correlation coefficient ― is a measure of linear correlation between two sets of data. It is the ratio between the covariance of two variables and the product of their standard deviations; thus, it is essentially a normalized measurement of the covariance, such that the result always has a value between −1 and 1. As with covariance itself, the measure can only reflect a linear correlation of variables, and ignores many other types of relationships or correlations. As a simple example, one would expect the age and height of a sample of teenagers from a high school to have a Pearson correlation coefficient significantly greater than 0, but less than 1.

In statistics, canonical-correlation analysis (CCA), also called canonical variates analysis, is a way of inferring information from cross-covariance matrices. If we have two vectors X = (X1, ..., Xn) and Y = (Y1, ..., Ym) of random variables, and there are correlations among the variables, then canonical-correlation analysis will find linear combinations of X and Y which have maximum correlation with each other. T. R. Knapp notes that "virtually all of the commonly encountered parametric tests of significance can be treated as special cases of canonical-correlation analysis, which is the general procedure for investigating the relationships between two sets of variables." The method was first introduced by Harold Hotelling in 1936, although in the context of angles between flats the mathematical concept was published by Jordan in 1875.
In statistics, propagation of uncertainty is the effect of variables' uncertainties on the uncertainty of a function based on them. When the variables are the values of experimental measurements they have uncertainties due to measurement limitations which propagate due to the combination of variables in the function.

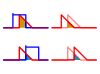
In signal processing, cross-correlation is a measure of similarity of two series as a function of the displacement of one relative to the other. This is also known as a sliding dot product or sliding inner-product. It is commonly used for searching a long signal for a shorter, known feature. It has applications in pattern recognition, single particle analysis, electron tomography, averaging, cryptanalysis, and neurophysiology. The cross-correlation is similar in nature to the convolution of two functions. In an autocorrelation, which is the cross-correlation of a signal with itself, there will always be a peak at a lag of zero, and its size will be the signal energy.

In statistics, particularly in hypothesis testing, the Hotelling's T-squared distribution (T2), proposed by Harold Hotelling, is a multivariate probability distribution that is tightly related to the F-distribution and is most notable for arising as the distribution of a set of sample statistics that are natural generalizations of the statistics underlying the Student's t-distribution. The Hotelling's t-squared statistic (t2) is a generalization of Student's t-statistic that is used in multivariate hypothesis testing.
In statistics, sometimes the covariance matrix of a multivariate random variable is not known but has to be estimated. Estimation of covariance matrices then deals with the question of how to approximate the actual covariance matrix on the basis of a sample from the multivariate distribution. Simple cases, where observations are complete, can be dealt with by using the sample covariance matrix. The sample covariance matrix (SCM) is an unbiased and efficient estimator of the covariance matrix if the space of covariance matrices is viewed as an extrinsic convex cone in Rp×p; however, measured using the intrinsic geometry of positive-definite matrices, the SCM is a biased and inefficient estimator. In addition, if the random variable has a normal distribution, the sample covariance matrix has a Wishart distribution and a slightly differently scaled version of it is the maximum likelihood estimate. Cases involving missing data, heteroscedasticity, or autocorrelated residuals require deeper considerations. Another issue is the robustness to outliers, to which sample covariance matrices are highly sensitive.
In probability theory and statistics, given a stochastic process, the autocovariance is a function that gives the covariance of the process with itself at pairs of time points. Autocovariance is closely related to the autocorrelation of the process in question.
The algebra of random variables in statistics, provides rules for the symbolic manipulation of random variables, while avoiding delving too deeply into the mathematically sophisticated ideas of probability theory. Its symbolism allows the treatment of sums, products, ratios and general functions of random variables, as well as dealing with operations such as finding the probability distributions and the expectations, variances and covariances of such combinations.
In statistics, an exchangeable sequence of random variables is a sequence X1, X2, X3, ... whose joint probability distribution does not change when the positions in the sequence in which finitely many of them appear are altered. Thus, for example the sequences
In probability theory and statistics, partial correlation measures the degree of association between two random variables, with the effect of a set of controlling random variables removed. When determining the numerical relationship between two variables of interest, using their correlation coefficient will give misleading results if there is another confounding variable that is numerically related to both variables of interest. This misleading information can be avoided by controlling for the confounding variable, which is done by computing the partial correlation coefficient. This is precisely the motivation for including other right-side variables in a multiple regression; but while multiple regression gives unbiased results for the effect size, it does not give a numerical value of a measure of the strength of the relationship between the two variables of interest.
In probability theory and statistics, the covariance function describes how much two random variables change together (their covariance) with varying spatial or temporal separation. For a random field or stochastic process Z(x) on a domain D, a covariance function C(x, y) gives the covariance of the values of the random field at the two locations x and y:
In statistics, the concordance correlation coefficient measures the agreement between two variables, e.g., to evaluate reproducibility or for inter-rater reliability.
In the mathematical theory of probability, multivariate Laplace distributions are extensions of the Laplace distribution and the asymmetric Laplace distribution to multiple variables. The marginal distributions of symmetric multivariate Laplace distribution variables are Laplace distributions. The marginal distributions of asymmetric multivariate Laplace distribution variables are asymmetric Laplace distributions.
In statistics, functional correlation is a dimensionality reduction technique used to quantify the correlation and dependence between two variables when the data is functional. Several approaches have been developed to quantify the relation between two functional variables.