Didsbury East (ward)

Last updated

Didsbury East (Manchester)
Didsbury East (Manchester City Council ward) 2018.png
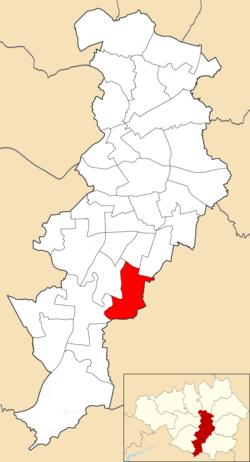
Didsbury East electoral ward within Manchester City Council
Arms of the City of Manchester.svg
Motto(s): 
By wisdom and effort
Coordinates: 53°24′46″N2°13′36″W / 53.4127°N 2.2267°W / 53.4127; -2.2267
Country United Kingdom
Constituent country England
Region North West England
County Greater Manchester
Metropolitan borough Manchester
Created2004
Named for Didsbury
Government
  UK Parliament constituency: Manchester Withington
  Type Unicameral
  Body Manchester City Council
  Leader of the council Bev Craig (Labour)
  Councillorvacant
  CouncillorLinda Foley (Labour)
  CouncillorAndrew Simcock (Labour)
Population
  Total14,333
Area and population statistics from the 2011 Census [1]

Didsbury East is an area and electoral ward of Manchester, England. [2] It is represented in Westminster by Jeff Smith MP for Manchester Withington. [3] The 2011 Census recorded a population of 14,333. [1]

Contents

Councillors

Three councillors serve the ward: Linda Foley (Lab), [4] and Andrew Simcock (Lab) [5] with a vacancy following James Wilson's resignation prior to the May 2024 elections.

ElectionCouncillorCouncillorCouncillor
2004 Anthony Parkinson (Lib Dem)Helen Fisher (Lib Dem)David Sandiford (Lib Dem)
2006 Anthony Parkinson (Lib Dem)Helen Fisher (Lib Dem)David Sandiford (Lib Dem)
2007 Anthony Parkinson (Lib Dem)Helen Fisher (Lib Dem)David Sandiford (Lib Dem)
2008 Anthony Parkinson (Lib Dem)Helen Fisher (Lib Dem)David Sandiford (Lib Dem)
2010 Andrew Taylor (Lib Dem)Helen Fisher (Lib Dem)David Sandiford (Lib Dem)
2011 Andrew Taylor (Lib Dem)Andrew Simcock (Lab)David Sandiford (Lib Dem)
2012 Andrew Taylor (Lib Dem)Andrew Simcock (Lab)Bridie Adams (Lab)
2014 James Wilson (Lab Co-op)Andrew Simcock (Lab)Bridie Adams (Lab)
2015 James Wilson (Lab Co-op)Andrew Simcock (Lab)Bridie Adams (Lab)
2016 James Wilson (Lab Co-op)Andrew Simcock (Lab)Kelly Simcock (Lab)
2018 James Wilson (Lab Co-op)Kelly Simcock (Lab)Andrew Simcock (Lab)
2019 James Wilson (Labour Co-op)Kelly Simcock (Lab)Andrew Simcock (Lab)
2021 James Wilson (Labour Co-op)Linda Foley (Lab)Andrew Simcock (Lab)
2022 James Wilson (Labour Co-op)Linda Foley (Lab)Andrew Simcock (Lab)
2023 James Wilson (Labour Co-op)Linda Foley (Lab)Andrew Simcock (Lab)
Mar
2024
vacantLinda Foley (Lab)Andrew Simcock (Lab)

  indicates seat up for re-election.

Elections in 2020s

* indicates incumbent councillor seeking re-election.

May 2023

2023
PartyCandidateVotes%±%
Labour Co-op James Wilson* 2,450 52.1 Increase2.svg10.2
Liberal Democrats Bryn Coombe1,56033.2Decrease2.svg7.4
Green Anne Guy48410.3Decrease2.svg0.3
Conservative Anjenarra Huque1603.4Decrease2.svg2.8
Independent Paula Matsikidze481Increase2.svg1
Majority89018.9Increase2.svg17.6
Rejected ballots21
Turnout 4,70242.36Increase2.svg0.65
Registered electors 11,149
Labour Co-op hold Swing

May 2022

2022
PartyCandidateVotes%±%
Labour Co-op Andrew Simcock* 2,714 54.6 2.7 Increase2.svg
Liberal Democrats John Cameron1,70434.30.9 Decrease2.svg
Green Paula Watson3316.74.0 Decrease2.svg
Conservative Anjenarra Huque1964.03.5 Decrease2.svg
Majority1,01020.3
Rejected ballots22
Turnout 4,94544.61.0 Increase2.svg
Registered electors 11,134
Labour Co-op hold Swing 1.8 Increase2.svg

May 2021

2021
PartyCandidateVotes%±%
Labour Linda Foley 2,972 51.0 1.2 Decrease2.svg
Liberal Democrats John Cameron2,08235.71.5 Decrease2.svg
Green Liberty Franley5038.64.8 Increase2.svg
Conservative Anjenarra Huque2764.72.1 Decrease2.svg
Majority89015.3
Rejected ballots320.5
Turnout 5,86552.08.4 Increase2.svg
Registered electors 11,283
Labour hold Swing 0.2 Increase2.svg

Elections in 2010s

May 2019

2019
PartyCandidateVotes%±%
Labour James Wilson* 1,948 41.9 Decrease2.svg4.3
Liberal Democrats John Cameron1,88940.6Increase2.svg5.8
Green Wendy Lynas49110.6Decrease2.svg0.1
Conservative James Flanagan2866.2Decrease2.svg1.3
Majority591.27Decrease2.svg9.7
Rejected ballots340.73
Turnout 4,64841.71Decrease2.svg2.9
Registered electors 11,144
Labour hold Swing Decrease2.svg5.05

May 2018

2018 [6]
PartyCandidateVotes%±%
Labour Andrew Simcock* 2,549 51.9
Labour Kelly Simcock* 2,440 49.7
Labour James Wilson* 2,268 46.2
Liberal Democrats Bryn Coombe1,72935.2
Liberal Democrats Dominic Hardwick1,72835.2
Liberal Democrats John Cameron1,71034.8
Green Wendy Lynas52410.7
Conservative James Flanagan3687.5
Conservative Ian Mason3006.1
Conservative Phelim Rowe2745.6
Majority
Turnout 4,90943.6
Labour win (new boundaries)
PartyCandidatesSeats WonVotesVote %
Labour 337,25752.25
Liberal Democrats 305,16737.20
Conservative 309426.78
Green 105243.77

May 2016

2016 [7]
PartyCandidateVotes%±%
Labour Kelly Suzanne Simcock 2,484 53.74
Liberal Democrats Dominic Hardwick1,28127.72
Green Wendy Ann Lynas3166.84
Conservative Robert George Manning3056.60
UKIP Mark Davies2365.11
Majority1,20326.03
Turnout 4,62244.00
Labour hold Swing

May 2015

2015 [8]
PartyCandidateVotes%±%
Labour Andrew George Simcock 3,572 45.4 -5.9
Liberal Democrats Dominic Hardwick2,20528.0-5.4
Conservative Robert George Manning1,00812.8+4.0
Green Rosie Dammers7319.3+3.0
UKIP Mark Davies3564.5N/A
Majority1,36717.4
Turnout 7,87270.7+25.8
Labour hold Swing

May 2014

2014 [9]
PartyCandidateVotes%±%
Labour Co-op James Wilson 1,968 43.18 +6.78
Liberal Democrats Dominic Hardwick1,37530.17-16.53
Green Lucy Jane Bannister4058.89+3.09
Conservative Rob Manning4038.84-2.36
UKIP Mark Falcon Davies3698.10N/A
TUSC Sam Gleadon380.83N/A
Majority59313.0
Turnout 4,55841.6
Labour Co-op gain from Liberal Democrats Swing

May 2012

2012 [10]
PartyCandidateVotes%±%
Labour Bridie Adams 2,039 50.5 +23.5
Liberal Democrats David Sandiford*1,39834.6-17.9
Green Amy Webber3187.9+0.0
Conservative Jamie Williams2806.9-5.7
Majority64116
Turnout 4,03537.6
Labour gain from Liberal Democrats Swing

May 2011

2011 [11]
PartyCandidateVotes%±%
Labour Andrew Simcock 2,465 51.5 +19.3
Liberal Democrats Helen Fisher*1,59833.4-12.5
Conservative Christopher Green4238.8-4.2
Green Kathleen Matthews3036.3-2.6
Majority86718.1
Turnout 4,78944.9
Labour gain from Liberal Democrats Swing

May 2010

2010 [12]
PartyCandidateVotes%±%
Liberal Democrats Andrew Taylor 3,364 46.7 -5.8
Labour Andrew Simcock2,62236.4+9.4
Conservative Asad Khan80611.2-1.4
Green Gerry Gee4195.8-2.1
Majority74210.3-15.2
Turnout 7,21168.8+30.8
Liberal Democrats hold Swing -7.6

Elections in 2000s

2008 [13]
PartyCandidateVotes%±%
Liberal Democrats David Sandiford* 2,050 52.5 +6.6
Labour Andrew Simcock1,05327.0-5.2
Conservative Louise Quigley49212.6-0.4
Green Gerry Gee3107.9-1.0
Majority99725.5+11.8
Turnout 3,90538.0-1.1
Liberal Democrats hold Swing +5.9
2007 [14]
PartyCandidateVotes%±%
Liberal Democrats Helen Fisher* 1,856 45.9 +0.6
Labour Geoff Bridson1,30132.2-2.1
Conservative David Fairclough52613.0+4.0
Green Gerry Gee3598.9-2.6
Majority55513.7+2.7
Turnout 4,04239.10
Liberal Democrats hold Swing +1.3
2006 [15]
PartyCandidateVotes%±%
Liberal Democrats Anthony Thomas Parkinson* 1,809 45.3 -2.4
Labour Geoffrey Bridson1,36934.3+2.9
Green Richard Edgar Gee45911.5+3.4
Conservative Peter Malcolm Schofield3599.0-3.7
Majority44011.0-5.3
Turnout 3,99639.1-9.3
Liberal Democrats hold Swing -2.6
2004 [16]
PartyCandidateVotes%±%
Liberal Democrats David Sandiford* 2,491 47.7 N/A
Liberal Democrats Helen Fisher* 2,228
Liberal Democrats Anthony Parkinson* 2,196
Labour Geoffrey Bridson1,63931.4N/A
Labour Andrew Simcock1,325
Labour Michael Emmerich1,308
Conservative Peter Schofield66612.7N/A
Conservative Daniel Valentine547
Conservative Nicholas Garside522
Green Jennifer Bailey4238.1N/A
Green Frances Simpson335
Green Darren Milton313
Majority55716.3N/A
Turnout 5,21948.4N/A
Liberal Democrats win (new seat)

Related Research Articles

<span class="mw-page-title-main">Manchester Withington (UK Parliament constituency)</span> Parliamentary constituency in the United Kingdom, 1918 onwards

Manchester Withington is a constituency represented in the House of Commons of the UK Parliament since 2015 by Jeff Smith of Labour. Of the 30 seats with the highest percentage of winning majority in 2017, the seat ranks 25th with a 55.7% margin, and is the only one of the twenty nine of these seats won by the Labour Party in which the second-placed candidate was a Liberal Democrat, rather than Conservative. This is despite being a Conservative seat right up to 1987, then becoming relatively safely Labour, then Liberal Democrat from 2005 to 2015 before they lost on a large swing in 2015, after which Smith substantially increased his majority.

<span class="mw-page-title-main">Gorton South</span> Human settlement in England

Gorton South is a defunct Local Government ward in the Gorton area of the City of Manchester. The population of Gorton South ward at the 2011 census was 19,615. Under boundary changes by the Local Government Boundary Commission for England (LGBCE) the ward was abolished and replaced with the new electoral ward Gorton and Abbey Hey from May 2018.

<span class="mw-page-title-main">Charlestown, Manchester</span> Electoral ward in England

Charlestown is a ward in the suburban north of the city of Manchester, England. The population of the ward at the 2011 census was 14,332. Voters from this ward elect three councillors to Manchester City Council.

<span class="mw-page-title-main">Old Moat</span> Human settlement in England

Old Moat is a suburban area of Manchester, England. The population of its electoral ward at the 2011 census was 14,490.

<span class="mw-page-title-main">Chorlton Park (ward)</span> Electoral ward in England

Chorlton Park is an area and electoral ward of Manchester, England. Different parts of this ward are represented by different MPs following boundary changes in 2018; the majority of the ward is part of the Manchester Withington constituency but a portion is part of the Manchester Gorton constituency. The 2011 Census recorded a population of 15,147.

<span class="mw-page-title-main">Baguley</span> Human settlement in England

Baguley is an electoral ward of the city of Manchester in Wythenshawe, England. The population at the 2011 census was 14,794.

<span class="mw-page-title-main">Brooklands (Manchester ward)</span> Electoral ward in England

Brooklands is an area and electoral ward of Manchester, England. It is represented in Westminster by Mike Kane, MP for Wythenshawe and Sale East. The 2011 Census recorded a population of 14,362.

<span class="mw-page-title-main">Little Hulton (ward)</span> Electoral ward in England

Little Hulton is an electoral ward of Salford, England. It is represented in Westminster by Barbara Keeley MP for Worsley and Eccles South. A profile of the ward conducted by Salford City Council in 2014 recorded a population of 13,469.

<span class="mw-page-title-main">Claremont (ward)</span> Electoral ward in England

Claremont (ward) is an electoral ward of Salford, England. It is represented in Westminster by Rebecca Long-Bailey MP for Salford and Eccles. A profile of the ward conducted by Salford City Council in 2014 recorded a population of 10,166.

<span class="mw-page-title-main">Swinton North (ward)</span> Electoral ward in England

Swinton North (ward) is an electoral ward of Salford, England. It is represented in Westminster by Rebecca Long-Bailey MP for Salford and Eccles. A profile of the ward conducted by Salford City Council in 2014 recorded a population of 11,473.

<span class="mw-page-title-main">Ordsall (ward)</span> Electoral ward in England

Ordsall (ward) is an electoral ward of Salford, England. The ward includes Ordsall itself, the Salford Quays redevelopment area and the easternmost part of Salford which adjoins Manchester city centre.

<span class="mw-page-title-main">Pendlebury (ward)</span> Electoral ward in England

Pendlebury is an electoral ward of Salford, England. It is represented in Westminster by Rebecca Long-Bailey MP for Salford and Eccles. A profile of the ward conducted by Salford City Council in 2014 recorded a population of 13,434.

<span class="mw-page-title-main">Burnage (ward)</span> Electoral ward in England

Burnage is an area and electoral ward of Manchester, England. Different parts of this ward are represented by different MPs following boundary changes in 2018; the majority of the ward is part of the Manchester Withington constituency but a portion is part of the Manchester Gorton constituency. The 2011 Census recorded a population of 15,227.

<span class="mw-page-title-main">Chorlton (ward)</span> Electoral ward in England

Chorlton is an electoral ward of Manchester, England. Different parts of this ward are represented by different MPs following boundary changes in 2018; the majority of the ward is part of the Manchester Withington constituency but a portion is part of the Manchester Gorton constituency. The 2011 Census recorded a population of 14,138.

<span class="mw-page-title-main">Didsbury West (ward)</span> Electoral ward in England

Didsbury West is a suburb and electoral ward of Manchester, England. It is represented in Westminster by Jeff Smith MP for Manchester Withington. The 2011 Census recorded a population of 12,455.

<span class="mw-page-title-main">Old Moat (ward)</span> Electoral ward in England

Old Moat is an area and electoral ward in Manchester, England. It is represented in Westminster by Jeff Smith MP for Manchester Withington. The 2011 Census recorded a population of 14,490.

<span class="mw-page-title-main">Withington (ward)</span> Electoral ward in England

Withington is an area and electoral ward of Manchester, England. It is represented in Westminster by Jeff Smith MP for Manchester Withington. The 2011 Census recorded a population of 13,422.

<span class="mw-page-title-main">Clayton and Openshaw (ward)</span> Electoral ward in England

Clayton and Openshaw is an area and electoral ward of Manchester, England created by the Local Government Boundary Commission for England (LGBCE) replacing the previous electoral wards of Ancoats & Clayton and Bradford for the local elections 2018.

<span class="mw-page-title-main">2019 Manchester City Council election</span> 2019 local election in England, UK

Elections to Manchester City Council were held on 2 May 2019, as part of the 2019 United Kingdom local elections. In 2018 Labour retained its majority of the council with 94 seats to the Liberal Democrats making up the opposition of 2, led by former MP John Leech.

<span class="mw-page-title-main">2021 Manchester City Council election</span> 2021 local election in England, UK

Elections to Manchester City Council were held on 6 May 2021, as part of the 2021 United Kingdom local elections. They were originally scheduled for 2020 but were suspended for a year, due to the COVID-19 pandemic. In 2019 Labour had retained its majority on the council, with 93 seats, with the Liberal Democrats led by former MP John Leech increasing the number of opposition councillors to three, but this had fallen back to two in March 2021 when Councillor Greg Stanton defected to the Labour Party.

References

  1. 1 2 "Area: Didsbury East (Manchester Ward)". neighbourhood.statistics.gov.uk. Retrieved 28 April 2017.
  2. "Council wards in Manchester". manchester.gov.uk. Manchester City Council . Retrieved 28 April 2017.
  3. "Jeff Smith MP". parliament.uk. UK Parliament . Retrieved 28 April 2017.
  4. "Linda Foley". manchester.gov.uk. Manchester City Council . Retrieved 23 May 2018.
  5. "Andrew Simcock". manchester.gov.uk. Manchester City Council . Retrieved 23 May 2018.
  6. "3 May 2018 Local Government Election results". manchester.gov.uk. Manchester City Council. 4 May 2018. Archived from the original on 7 May 2018. Retrieved 23 May 2018.
  7. "Local election results - Thursday 5 May 2016". manchester.gov.uk. Manchester City Council . Retrieved 30 April 2017.
  8. "Local election results - Thursday 7 May 2015". manchester.gov.uk. Manchester City Council . Retrieved 30 April 2017.
  9. "Local election results 2014". manchester.gov.uk. Manchester City Council . Retrieved 30 April 2017.
  10. "Results of the Manchester City Council election, 2012". manchester.gov.uk. Manchester City Council . Retrieved 30 April 2017.
  11. "Local election results 2011". manchester.gov.uk. Manchester City Council . Retrieved 30 April 2017.
  12. "Election results: 6 May 2010". manchester.gov.uk. Manchester City Council . Retrieved 30 April 2017.
  13. "Local elections 2008". manchester.gov.uk. Manchester City Council . Retrieved 1 May 2017.
  14. "Local elections 2007". manchester.gov.uk. Manchester City Council . Retrieved 1 May 2017.
  15. "Local elections 2006". manchester.gov.uk. Manchester City Council . Retrieved 1 May 2017.
  16. "Local Elections 10 June 2004". manchester.gov.uk. Manchester City Council. Archived from the original on 26 June 2004. Retrieved 1 May 2017.