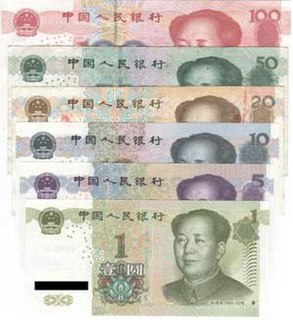
The renminbi (RMB, also known as Chinese yuan; ISO code: CNY) is the official currency of the People's Republic of China. [1] Although it is not a freely convertible currency, and has an official exchange rate, the CNY plays an important role in the world economy and international trade. This page lists past and present CNY exchange rates with other major currencies, in both nominal and purchasing power parity (PPP) terms.
After taking control of economic policy in 1978, Deng Xiaoping opened up China to foreign trade and investment, permitting a large influx of foreign capital and sparking rapid economic growth. In 2010, China's annual level of inward foreign direct investment (FDI) reached a record US$106 billion. [2] As of 2013, China is the world's second-largest economy, with an estimated nominal gross domestic product (GDP) of US$8.25 trillion and a total international trade value of US$3.64 trillion. [3] [4] Since the mid-1990s, the official CNY exchange rate has been adopted by numerous international financial and governmental organizations, such as the International Monetary Fund (IMF), the World Bank and the United Nations (UN). The perceived undervaluing of the CNY by the Chinese government has led to tensions between China and other major economies. [5] [6] In August 2019, US President Donald Trump designated China a currency manipulator, a designation not supported by the IMF. [7]
Official historical average exchange rates of Renminbi for major foreign currencies by year [8] (Chinese yuan per 100 foreign currency units) | |||||
Year | USD | JPY | HKD | Euro | |
2018 | 661.74 | 5.9890 | 84.428 | 780.16 | |
2017 | 675.18 | 6.0244 | 86.643 | 763.03 | |
2016 | 664.23 | 6.1243 | 85.578 | 734.26 | |
2015 | 622.84 | 5.1543 | 80.34 | 691.41 | |
2014 | 614.28 | 5.8196 | 79.220 | 816.51 | |
2013 | 619.32 | 6.3323 | 79.845 | 822.19 | |
2012 | 631.25 | 7.9037 | 81.376 | 810.67 | |
2011 | 645.88 | 8.1050 | 82.968 | 900.11 | |
2010 | 676.95 | 7.7279 | 87.130 | 897.25 | |
2009 | 683.10 | 7.2986 | 88.123 | 952.70 | |
2008 | 694.51 | 6.7427 | 89.190 | 1,022.27 | |
2007 | 760.40 | 6.4632 | 97.459 | 1,041.75 | |
2006 | 797.18 | 6.8570 | 102.620 | 1,001.90 | |
2005 | 819.17 | 7.4484 | 105.300 | 1,019.53 | |
2004 | 827.68 | 7.6552 | 106.230 | 1,029.00 | |
2003 | 827.70 | 7.1466 | 106.240 | 936.13 | |
2002 | 827.70 | 6.6237 | 106.070 | 800.58 | |
2001 | 827.70 | 6.8075 | 106.080 | ||
2000 | 827.84 | 7.6864 | 106.180 | ||
1999 | 827.83 | 7.2932 | 106.660 | ||
1998 | 827.91 | 6.3488 | 106.880 | ||
1997 | 828.98 | 6.8600 | 107.090 | ||
1996 | 831.42 | 7.6352 | 107.510 | ||
1995 | 835.10 | 8.9225 | 107.960 | ||
1994 | 861.87 | 8.4370 | 111.530 | ||
1993 | 576.20 | 5.2020 | 74.410 | ||
1992 | 551.46 | 4.3608 | 71.240 | ||
1991 | 532.33 | 3.9602 | 68.450 | ||
1990 | 478.32 | 3.3233 | 61.390 | ||
1989 | 376.51 | 2.7360 | 48.280 | ||
1988 | 372.21 | 2.9082 | 47.700 | ||
1987 | 372.21 | 2.5799 | 47.740 | ||
1986 | 345.28 | 2.0694 | 44.220 | ||
1985 | 293.66 | 1.2457 | 37.570 | ||
1984 | 232.70 | 0.9780 | 29.710 | ||
1983 | 197.57 | 0.8318 | 27.360 | ||
1982 | 189.25 | 0.7607 | 31.150 | ||
1981 | 170.50 | 0.7735 | 30.410 |
World Bank annual average middle exchange rate for US dollar to Chinese yuan [9] ( 1 US dollar to Chinese yuan ) | |||||||
Year | US dollar | Year | US dollar | Year | US dollar | Year | US dollar |
2019 | 2004 | 8.2768 | 1989 | 4.9400 | 1974 | 1.9612 | |
2018 | 6.98 | 2003 | 8.2770 | 1988 | 4.8600 | 1973 | 1.9894 |
2017 | 6.89 | 2002 | 8.2770 | 1987 | 4.4600 | 1972 | 2.2451 |
2016 | 2001 | 8.2771 | 1986 | 3.4500 | 1971 | 2.4618 | |
2015 | 2000 | 8.2784 | 1985 | 2.9400 | 1970 | 2.4618 | |
2014 | 1999 | 8.2783 | 1984 | 2.8000 | 1969 | 2.4618 | |
2013 | 1998 | 8.2791 | 1983 | 2.6100 | 1968 | 2.4618 | |
2012 | 6.3123 | 1997 | 8.2898 | 1982 | 2.6200 | 1967 | 2.4618 |
2011 | 6.4615 | 1996 | 8.3142 | 1981 | 2.5200 | 1966 | 2.4618 |
2010 | 6.7703 | 1995 | 8.3507 | 1980 | 2.4000 | 1965 | 2.4618 |
2009 | 6.8300 | 1994 | 8.6187 | 1979 | 2.3000 | 1964 | 2.4618 |
2008 | 6.9451 | 1993 | 8.0213 | 1978 | 2.4600 | 1963 | 2.4618 |
2007 | 7.6075 | 1992 | 6.3700 | 1977 | 1.8578 | 1962 | 2.4618 |
2006 | 7.9734 | 1991 | 5.7400 | 1976 | 1.9414 | 1961 | 2.4618 |
2005 | 8.1943 | 1990 | 5.2300 | 1975 | 1.8598 | 1960 | 2.4618 |
International Monetary Fund annual average middle exchange rate for US dollar to Chinese yuan [10] ( 1 US dollar to Chinese yuan ) | |||||||
Year | US dollar | Year | US dollar | Year | US dollar | Year | US dollar |
2019 | 2009 | 6.8310 | 1999 | 8.2783 | 1989 | 3.7651 | |
2018 | 2008 | 6.9480 | 1998 | 8.2790 | 1988 | 3.7221 | |
2017 | 2007 | 7.6071 | 1997 | 8.2898 | 1987 | 3.7221 | |
2016 | 2006 | 7.9735 | 1996 | 8.3142 | 1986 | 3.4528 | |
2015 | 2005 | 8.1942 | 1995 | 8.3514 | 1985 | 2.9367 | |
2014 | 2004 | 8.2768 | 1994 | 8.6187 | 1984 | 2.3200 | |
2013 | 6.15 | 2003 | 8.2770 | 1993 | 5.7620 | 1983 | 1.9757 |
2012 | 6.3124 | 2002 | 8.2769 | 1992 | 5.5146 | 1982 | 1.8925 |
2011 | 6.4614 | 2001 | 8.2771 | 1991 | 5.3234 | 1981 | 1.7045 |
2010 | 6.7704 | 2000 | 8.2784 | 1990 | 4.7832 | 1980 | 1.4984 |
Purchasing power parity (PPP) figures vary based on inflation and the revision of census figures in different periods. The following is a list of CNY exchange rates based on PPP, estimated according to the International Monetary Fund's World Economic Outloo wek (WEO) database from 2006–present. The exchange rate shown is Intl$. 1 to Chinese yuan (CNY).
List sof CNY–$Intl. PPP exchange rates by periods (IMF's WEO data) [11] | ||||||||
Data period | Apr.2012 | Sept.2011 | Apr.2011 | Oct.2010 | Oct.2009 | Oct.2008 | Oct.2007 | Sept.2006 |
2012 | 4.2382 | 4.1314 | 4.0825 | 3.9749 | 3.7210 | 3.9959 | ||
2011 | 4.1731 | 4.0492 | 4.0662 | 3.9366 | 3.7113 | 3.9415 | ||
2010 | 3.9643 | 3.9327 | 3.9460 | 3.8620 | 3.7139 | 3.8823 | ||
2009 | 3.7603 | 3.7593 | 3.7638 | 3.7638 | 3.7241 | 3.7930 | ||
2008 | 3.8231 | 3.8224 | 3.8210 | 3.8217 | 3.7932 | 3.6936 | 2.1728 | |
2007 | 3.6264 | 3.6245 | 3.6220 | 3.6226 | 3.6141 | 3.5471 | 2.1272 | 1.9641 |
2006 | 3.4668 | 3.4661 | 3.4652 | 3.4655 | 3.4603 | 3.4617 | 2.0781 | 1.9427 |
2005 | 3.4476 | 3.4476 | 3.4476 | 3.4476 | 3.4476 | 3.4476 | 2.0767 | 1.9452 |
2004 | 3.4032 | 3.4032 | 3.4032 | 3.4032 | 3.4032 | 3.4032 | 2.0579 | 1.9141 |
2003 | 3.2667 | 3.2667 | 3.2667 | 3.2667 | 3.2667 | 3.2667 | 1.9802 | 1.8374 |
2002 | 3.2512 | 3.2505 | 3.2521 | 3.2551 | 3.2522 | 3.2513 | 1.9709 | 1.8270 |
2001 | 3.2842 | 3.2839 | 3.2855 | 3.2886 | 3.2858 | 3.2888 | 1.9936 | 1.8481 |
2000 | 3.2908 | 3.2902 | 3.2922 | 3.2950 | 3.2926 | 3.3000 | 2.0004 | 1.8544 |
1999 | 3.2951 | 3.2935 | 3.2955 | 3.2983 | 3.2960 | 3.3038 | 2.0027 | 1.8565 |
1998 | 3.3867 | 3.3844 | 3.3865 | 3.3893 | 3.3870 | 3.3942 | 2.0575 | 1.8991 |
1997 | 3.4556 | 3.4522 | 3.4544 | 3.4573 | 3.4549 | 3.4615 | 2.0983 | 1.9372 |
1996 | 3.4641 | 3.4607 | 3.4630 | 3.4659 | 3.4635 | 3.4667 | 2.1014 | 1.9401 |
1995 | 3.3169 | 3.3133 | 3.3156 | 3.3184 | 3.3159 | 3.3188 | 2.0118 | 1.8573 |
1994 | 2.9778 | 2.9747 | 2.9759 | 2.9784 | 2.9770 | 2.9777 | 1.8050 | 1.6664 |
1993 | 2.5206 | 2.5184 | 2.5194 | 2.5215 | 2.5202 | 2.5214 | 1.5284 | 1.4111 |
1992 | 2.2372 | 2.2359 | 2.2368 | 2.2387 | 2.2377 | 2.2408 | 1.3439 | 1.2353 |
1991 | 2.1167 | 2.1147 | 2.1155 | 2.1173 | 2.1164 | 2.1179 | 1.2742 | 1.1712 |
1990 | 2.0508 | 2.0493 | 2.0503 | 2.0520 | 2.0509 | 2.0514 | 1.2356 | 1.1357 |
1989 | 2.0132 | 2.0110 | 2.0118 | 2.0135 | 2.0132 | 2.0131 | 1.2143 | 1.1162 |
1988 | 1.9254 | 1.9233 | 1.9240 | 1.9257 | 1.9248 | 1.9254 | 1.1582 | 1.0646 |
1987 | 1.7768 | 1.7749 | 1.7756 | 1.7771 | 1.7758 | 1.7764 | 1.0683 | 0.9819 |
1986 | 1.7387 | 1.7368 | 1.7375 | 1.7390 | 1.7373 | 1.7354 | 1.0445 | 0.9601 |
1985 | 1.6966 | 1.6947 | 1.6954 | 1.6969 | 1.6961 | 1.6933 | 1.0206 | 0.9381 |
1984 | 1.5861 | 1.5844 | 1.5850 | 1.5863 | 1.5853 | 1.5833 | 0.9548 | 0.8776 |
1983 | 1.5683 | 1.5665 | 1.5672 | 1.5685 | 1.5671 | 1.5654 | 0.9444 | 0.8681 |
1982 | 1.6141 | 1.6124 | 1.6130 | 1.6144 | 1.6128 | 1.6112 | 0.9714 | 0.8929 |
1981 | 1.0073 | 1.0062 | 1.0066 | 1.0074 | 1.7478 | 1.7474 | 1.0535 | 0.9684 |
1980 | 1.2251 | 1.2238 | 1.2243 | 1.2253 | 1.8695 | 1.8602 | 1.1216 | 1.0354 |
Special drawing rights (SDRs) are supplementary foreign exchange reserve assets defined and maintained by the International Monetary Fund (IMF). SDRs are units of account for the IMF, and not a currency per se. They represent a claim to currency held by IMF member countries for which they may be exchanged. SDRs were created in 1969 to supplement a shortfall of preferred foreign exchange reserve assets, namely gold and U.S. dollars. The ISO 4217 currency code for special drawing rights is XDR and the numeric code is 960.
The renminbi is the official currency of the People's Republic of China and one of the world's reserve currencies, ranking as the eighth most traded currency in the world as of April 2019.
A reserve currency is a foreign currency that is held in significant quantities by central banks or other monetary authorities as part of their foreign exchange reserves. The reserve currency can be used in international transactions, international investments and all aspects of the global economy. It is often considered a hard currency or safe-haven currency.
In finance, an exchange rate is the rate at which one currency will be exchanged for another currency. Currencies are most commonly national currencies, but may be sub-national as in the case of Hong Kong or supra-national as in the case of the euro.
The balance of payments of a country is the difference between all money flowing into the country in a particular period of time and the outflow of money to the rest of the world. These financial transactions are made by individuals, firms and government bodies to compare receipts and payments arising out of trade of goods and services.
This article includes a list of China's historical gross domestic product (GDP) values, the market value of all final goods and services produced by a nation in a given year. The GDP dollar estimates presented here are either calculated at market or government official exchange rates (nominal), or derived from purchasing power parity (PPP) calculations. This article also includes historical GDP growth.
Renminbi currency value is a debate affecting the Chinese currency unit, the renminbi. The renminbi is classified as a fixed exchange rate currency "with reference to a basket of currencies", which has drawn attention from nations which have freely floated currency and has become a source of trade friction with Western nations.
Since the late-2000s, the People's Republic of China (PRC) has sought to internationalize its official currency, the Renminbi (RMB). RMB internationalization accelerated in 2009 when China established the dim sum bond market and expanded Cross-Border Trade RMB Settlement Pilot Project, which helps establish pools of offshore RMB liquidity. The RMB was the 8th-most-traded currency in the world in 2013 and the 7th-most-traded in early 2014. By the end of 2014, RMB ranked 5th as the most traded currency, according to SWIFT's report, at 2.2% of SWIFT payment behind JPY (2.7%), GBP (7.9%), EUR (28.3%) and USD (44.6%). In February 2015, RMB became the second most used currency for trade and services, and reached the ninth position in forex trading. The RMB Qualified Foreign Institutional Investor (RQFII) quotas were also extended to five other countries — the UK, Singapore, France, Korea, Germany, and Canada, each with the quotas of ¥80 billion except Canada and Singapore (¥50bn). Previously, only Hong Kong was allowed, with a ¥270 billion quota.
Beijing's economy ranks among the most developed and prosperous cities in China. In 2013, the municipality's nominal gross domestic product (GDP) was CN¥1.95 trillion. It was about 3.43% of the country's total output, and ranked 13th among province-level administrative units. Per capita GDP, at CN¥93,213 (US$15,051) in nominal terms and Int $21,948 at purchasing power parity, was 2.2 times the national average and ranked second among province-level administrative units.